Numerical study of quasi-static crushing behaviors of steel tubular structures according to the slenderness ratio
Copyright ⓒ The Korean Society of Marine Engineering
This is an Open Access article distributed under the terms of the Creative Commons Attribution Non-Commercial License (http://creativecommons.org/licenses/by-nc/3.0), which permits unrestricted non-commercial use, distribution, and reproduction in any medium, provided the original work is properly cited.
Abstract
Crushing failure mainly occurs during collision events between ships or offshore objects, such as collisions between ships or between ships and bridges. To ensure safety against such collision events, the evaluation of the collision resistance is important and is normally conducted experimentally and/or numerically. In this study, the crushing assessment of a steel tube with and without transverse stiffeners for quasi-static compressive loading is numerically evaluated. The finite element series analyses show that the transverse stiffeners do not contribute to the ultimate crushing loads but affect the mean crushing capacities. As the slenderness ratio increases, the effect of the transverse stiffener reinforcement decreases. The finite element results were compared with previous experiment results.
Keywords:
Numerical study, Quasi-static crushing behavior, Steel tubular structure, Transverse stiffeners, Slenderness ratio, Finite element model1. Introduction
The volume of cargo transported by ships worldwide is steadily increasing; consequently, ship collisions are increasing continuously. Ships receive a very large impact load in the event of a collision owing to the addition of cargo weight to their own load, and attention is required in the design of the hull because damage such as tearing, punching, and crushing, as well as indentation, occurs in the stiffened plates constituting the ship [1].
Experiments and numerical analyses are mainly performed on stiffened panels or steel tubular structures to evaluate the collision mechanism of ship structures made of steel plates. [2]-[8].
Lee [9] conducted an experimental study on the ultimate strength and absorbed energy of a thin plate, assuming that the amount of damage to a ship during collision is equal to the amount of kinetic energy loss. The author compared the formula obtained by the experimental analysis with the theoretical analysis results and suggested a relationship between the amount of damage to the plate and the absorbed energy. Park et al. [10] performed finite element analyses to study the buckling and ultimate collapse behavior of stiffened curved plates and presented the parameters affecting the results. Park et al. [11] presented a numerical model to evaluate the quasi-static crushing mechanism of a steel tubular structure under axial compression, which was optimized based on experimental results. They performed a parametric study to tune the coefficients required for the crushing simulation based on the experimental results.
Although many studies have been conducted to elucidate the mechanism of buckling or crushing of the stiffened plate and tubular structure, it is difficult to obtain a standardized result because it shows different results depending on the load condition or the shape of the sample owing to its highly nonlinear behavior.
In this study, the change in the crushing strength of steel tubular structures according to the slenderness ratio of the tube was evaluated using an optimized numerical analysis model derived from a parametric study by Park et al. [11]. A series of nonlinear finite element analyses were performed on stiffened and non-stiffened tubes by changing the plate width and thickness. Finally, the simulation results were validated by comparing them with previous research results.
2. Methodology
2.1 Crushing failure of steel tubular structure
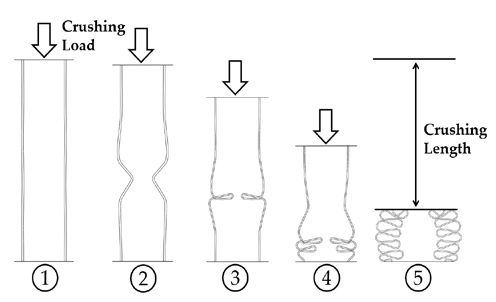
The crushing failure of a steel tube generally proceeds through a five-step process, as shown in Figure 1 [12].
①Axial crushing load on the steel tube
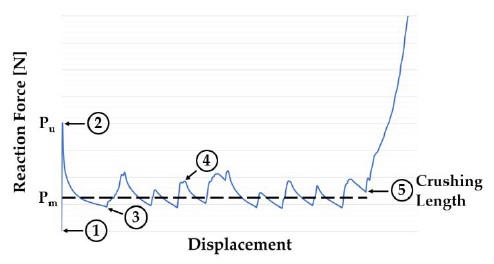
②The first buckling occurs where the maximum crushing load (Pu) is measured, and then the reaction force decreases owing to continuous deformation.
③The reaction force increases after folding occurs.
④Repeated folding occurs
⑤ After the final folding, the tube acts as a rigid body, and the reaction force continues to increase. The average crushing load (Pm) is obtained based on the crushing length.
Through crushing analysis, the reaction force according to the crushing distance, internal energy, and average crushing load (Pm) is obtained. From the relationship between the distance and reaction force, the number of folds and final crushing distance can be determined. The internal energy is the amount of energy used when the steel tube is deformed by the load acting on it. The average crushing load is the average of the crushing force up to the final crushing distance. Therefore, the average crushing load represents the impact resistance of a square steel tube and is affected by the crushing shape.
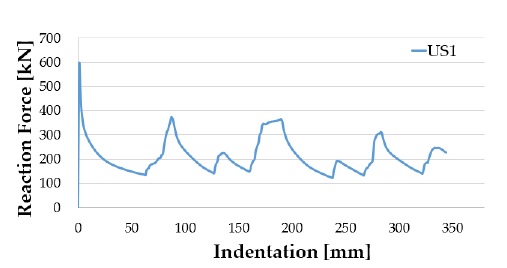
The crushing length ⑤ in Figure 1 is an important parameter that determines the average crushing load. Because it is difficult to visually determine the final crushing distance in the numerical analysis, contrary to the experiment, a criterion for the determination of the crushing length is required (Park et al. [11]). In this study, the crushing length was determined as the point at which the lowest reaction force was measured after the last folding, as shown in Figure 2.
2.2 Finite element analysis
Because the crushing failure of steel tubular structures shows strong nonlinearity, it is recommended that a nonlinear numerical analysis be performed by applying analysis parameters tuned through experiments.
According to Park et al. [11], the following parameters should be considered with great attention in the finite element analysis of the crushing failure of steel tubes:
(1) Boundary condition
(2) Geometrical imperfection
(3) Friction coefficient
(4) Material nonlinearity model
(5) Element size
(6) Element type
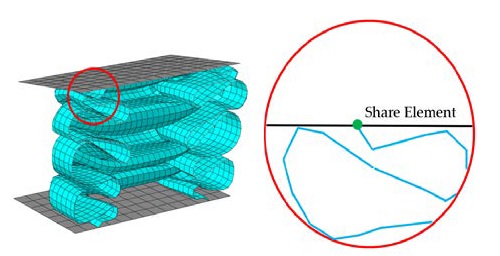
Park et al. [11] performed a sensitivity study on the above parameters and presented a modeling guideline for the nonlinear structural analysis of steel tubes subjected to quasi-static loads. The determined parameters are summarized in Table 1. The fixed boundary condition implies that the nodes of the plate for applying the crushing load and the top of the tube are shared with each other, as shown in Figure 3. The dynamic/explicit solver of ABAQUS, a commercial finite element analysis program, was used for nonlinear crushing analysis [13].
3. Target Model and Analysis Condition
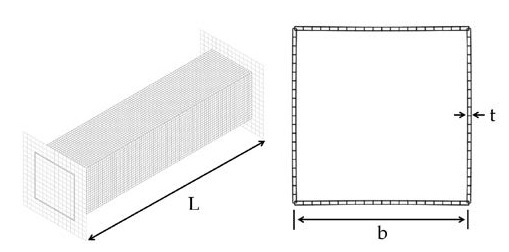
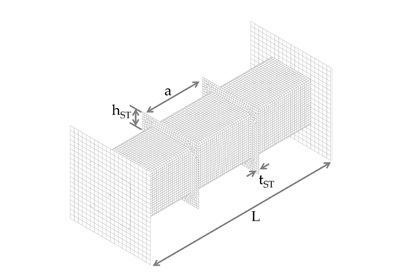
The unstiffened and transversely stiffened square tubes, as shown in Figure 4 and Figure 5 are the target tube models considered in this study. Because our previous study showed that a tube with only one transverse stiffener had an insignificant reinforcing effect, a model with two transverse stiffeners was applied in this study.
Particularly, the slenderness ratio of the steel tube has a significant effect on the strength because it exhibits buckling behavior under a compressive load. Therefore, in this study, the effect of the slenderness ratio was evaluated. Table 2 and Table 3 show the dimensions and material properties of the tubes used in the analysis. The dimensions of the stiffened tube were the same as those of the unstiffened tube, except for the transverse stiffeners.
Each specimen was subjected to a compressive load at a constant rate of 0.05 mm/s to realize crushing failure in a quasi-static situation. The constant rate of 0.05 mm/s is an appropriately selected speed among the load speeds corresponding to the quasi-static speed defined in ASME [14].
4. Analysis Result
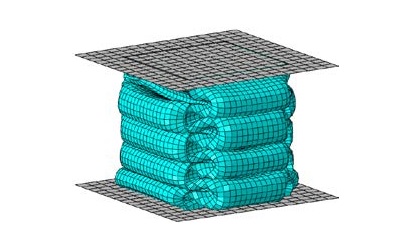
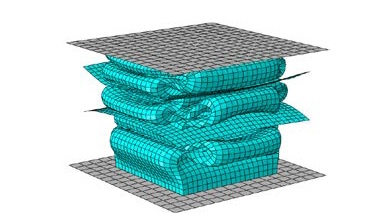
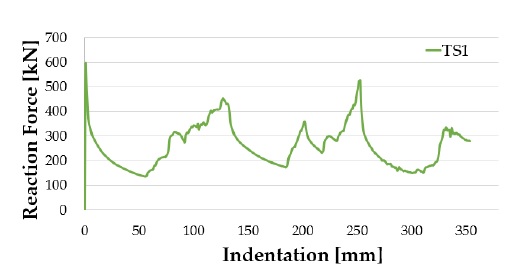
Figure 6 shows the final deformed shape of specimen US1 and Figure 7 shows the reaction force according to the indentation. Figure 8 shows the final deformed shape of specimen TS1 and Figure 9 shows the reaction force according to the indentation.
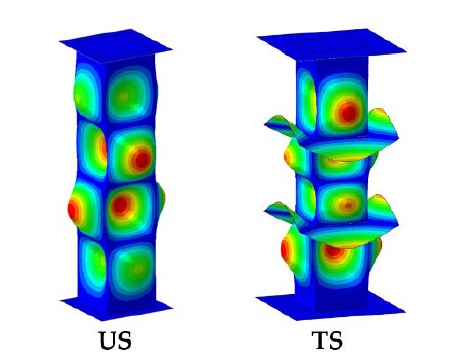
When comparing US1 and TS1, from the simulation results, it can be observed that the transverse stiffeners change the folding shape, and the reaction force of TS1 is generally larger than that of US1. We performed a modal analysis of each tube to evaluate the buckling shapes of the US1 and TS1.
As shown in Figure 10, comparing each shape in the eigenmode with four folds, it can be observed that the shapes are different owing to the transverse reinforcement. Interestingly, the transverse reinforcement does not increase the maximum reaction force, as shown in Figure 7 and Figure 9. This is because the upper transverse stiffener supports the tube after the first folding, where the maximum reaction force is obtained. Therefore, a difference in the reaction force between the two models is observed after the first folding.
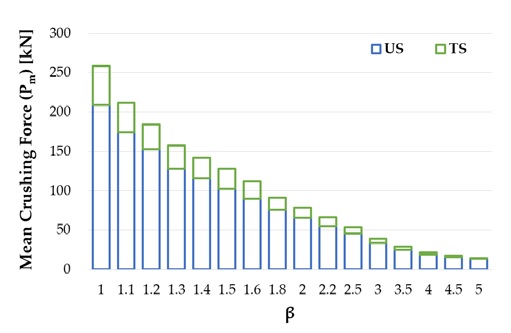
Figure 11 compares the mean crushing forces of the US and TS. Overall, it can be observed that the mean crushing force for TS is larger than that for US, and the effect of the reinforcement decreases as the slender ratio increases. The detailed results are presented in Table 4.
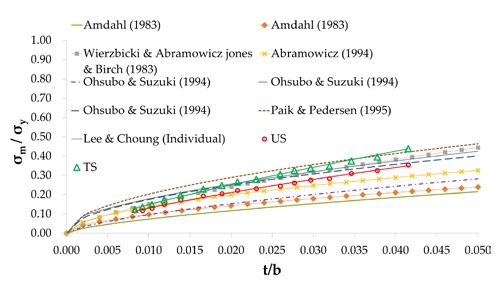
Figure 12 compares the results derived from this study with those of the previously studied empirical formulas. The results of the US and TS are presented through nonlinear regression, as Equation (1) and Equation (2), respectively. The empirical formulas used for comparison are presented in Equation (3) Equation (10). For comparison, the values on the y-axis were normalized by dividing the mean crushing stress (σm) by the yield strength (σy). The x-axis represents the relationship between the width and plate thickness.
US
| (1) |
TS
| (2) |
| (3) |
Amdahl [2]
| (4) |
Warbeck & Abramowicz jones & Birch [3][4]
| (5) |
Abramowicz [5]
| (6) |
| (7) |
Ohsubo & Suzuki [6]
| (8) |
| (9) |
Paik & Pedersen [7]
| (10) |
*η = effective crushing length
Owing to the strong non-linearity of the crushing mechanism, it can be observed that there is a slight difference in the results derived based on each equation. When the plate is thin, both the US and TS have similar average crushing strengths; however, as the plate becomes thicker, the influence of the reinforcement increases, and the difference increases. While the US results show a similar trend to that of Abramowicz [5], the TS result shows a rather large difference from the other results at a large thickness as the slope increases with the increase of the thickness. Overall, the results of this study tend to be conservative compared to the results of other studies. It is expected that the applicability of the numerical simulation model can be more precisely evaluated if an investigation using various types of reinforcements is conducted in a future study.
5. Conclusion
In this study, the crushing performance of a steel tube according to the slenderness was evaluated using finite element models optimized for crushing analysis. To realize the nonlinear crushing phenomenon, a nonlinear finite element analysis with an explicit scheme was performed, and unstiffened and transversely stiffened steel tubes were applied to quantitatively evaluate the reinforcement effect.
The analysis results showed that the transverse stiffeners did not affect the maximum crushing force, which typically occurs during the first folding. However, they started to support the tube after the first folding, which was shown to affect the mean crushing load.
As the slenderness increased, the mean crushing load decreased in both the unstiffened and transversely stiffened tubes. However, as the slenderness ratio increased, the effect of the transverse reinforcement decreased, and eventually, the effect of the transverse stiffener was hardly observed at the largest slenderness ratio considered in the study.
Equation (1) and Equation (2) were derived by the nonlinear regression of the simulation results in this study. It can be observed that the results obtained using Equation (1) and Equation (2) are relatively conservative when compared with other existing experimental results. Further studies considering the effects of various types of reinforcements are recommended.
Acknowledgments
This work was supported by the Dong-A University research fund.
Author Contributions
Conceptualization, Y. I. Park; Methodology, Y. I. Park; Formal Analysis, J. -S. Cho; Investigation, J. -S. Cho; Data Curation, J.-S. Cho; Writing—Original Draft Preparation, Y. I. Park; Writing—Review & Editing, J. -H. Kim; Visualization, J. -H. Kim; Supervision, J. -H. Kim; Project Administration, J. -H. Kim; Funding Acquisition, J. -H. Kim.
References
-
X. Xin, K. Lui, Z. Yang, J. Zhang, and X. Wu, “A probabilistic risk approach for the collision detection of multi-ships under spatiotemporal movement uncertainty,” Reliability Engineering & System Safety, vol. 215, p. 107772, 2021.
[https://doi.org/10.1016/j.ress.2021.107772]

- J. Amdahl, Energy Absorption in Ship-Platform Impacts, Division of Marine Structures, Report No. UR-83-34, University of Trondheim, Trondheim, Norway, 1983.
- T. Wierzbicki, “Crushing behavior of plate intersections,” Proceedings of the First International Symposium on Structural Crashworthiness, pp. 66-95, 1983.
-
N. Jones and R. S. Birch, “Dynamic and static axial crushing of axially stiffened square tubes,” Proceedings of the Institute of Mechanical Engineers, Part C: Mechanical Engineering Science, vol. 204, no. 5, pp. 293-310, 1990.
[https://doi.org/10.1243/PIME_PROC_1990_204_110_02]

- W. Abramowicz, Crush Resistance of “T”, “Y” and “X” Sections, Report No. 24, Massachusetts Institute of Technology, Cambridge, 1994.
-
H. Ohtsubo and K. Suzuki, “The crushing mechanics of bow structure in head on collision (1st Report),” Journal of the Society of Naval Architects of Japan, vol. 176, pp.301-308, 1994.
[https://doi.org/10.2534/jjasnaoe1968.1994.176_301]

-
J. K. Paik and P. T. Pedersen, “Ultimate and crushing strength of plated structures,” Journal of Ship Research, vol. 39, no. 03, pp. 250-261, 1995.
[https://doi.org/10.5957/jsr.1995.39.3.250]

-
S. -J. Park and J. Choung, “Punching fracture experiments and simulations of unstiffened and stiffened panels for ships and offshore structures,” Journal of Ocean Engineering and Technology, vol. 34, no. 3, pp. 155-166, 2020.
[https://doi.org/10.26748/KSOE.2020.023]

- J. W. Lee, “The crushing behavior of thin plates subjected to compression,” Journal of the Society of Naval Architects of Korea, vol. 19, pp. 33-39, 1982.
-
J. -S. Park, Y. -C. Ha, and J. -K. Seo. “Estimation of buckling and ultimate collapse behaviour of stiffened curved plates under compressive load,” Journal of Ocean Engineering and Technology, vol. 34, no. 1, pp. 37-45, 2020.
[https://doi.org/10.26748/KSOE.2019.108]

-
Y. I. Park, J. -S. Cho, and J. -H. Kim, “Numerical and experimental investigation of quasi-static crushing behaviors of steel tubular structures,” Materials, vol. 15, no. 6, p. 2107, 2022.
[https://doi.org/10.3390/ma15062107]

- J. Y. Jung, On the Collision Strength of Ship’s Bow, Ph. D. Dissertation, Pusan National University, Korea, 1997 (in Korean).
- Dassault Systèmes Simulia Corporation, Abaqus 6.14 Theory Manual, 2014.
- U. S. Lindholm, Dynamic deformation of metals, Behavior of Materials Under Dynamic Loading, pp. 42-61, 1965.

