Simple and mechanical augmented feedback training devices for Parkinson’s disease: A pilot study
Copyright ⓒ The Korean Society of Marine Engineering
This is an Open Access article distributed under the terms of the Creative Commons Attribution Non-Commercial License (http://creativecommons.org/licenses/by-nc/3.0), which permits unrestricted non-commercial use, distribution, and reproduction in any medium, provided the original work is properly cited.
Abstract
The goal of this study was to evaluate the feasibility of a novel mechanism, design a rehabilitation device, and evaluate its performance. The feasibility of the mechanism was investigated first. After verifying the potential of a walking detection mechanism using metal beads and microswitches, we designed an algorithm and device for rehabilitation. The device and mechanism were evaluated by several participants. The non-Parkinson’s disease (PD) group recorded a minimum walking detection rate (WDR) on the slowest treadmill speed (0.15 km/h) and maximum WDR on the fastest treadmill speed (0.41 km/h). Additionally, the group recorded a minimum WDR at the highest sensor angle (0.01°) and maximum WDR at the lowest sensor angle (0.78°). The non-PD group had a higher WDR than the PD group (non-PD: 0.24, PD: 0.31). As a result of the long-term usage of the proposed device, gait disorders improved. Walking speed increased by 91.89% and steps per minute increased by 8.5%. The device reflects walking speeds and sensor angles, and its results differ for users with gait disorders. Additionally, PD patients can improve their walking speed and steps per minute as a result of rehabilitation. This research must overcome the limitations of the small number of participants in the study to reinforce arguments related to gait disorder classification.
Keywords:
Augmented feedback training, Parkinson’s disease, Walking detection method, Wearable device1. Introduction
Parkinson’s disease (PD) is the second-most common neurodegenerative disease among geriatric diseases [1]. Globally, the number of individuals with PD is estimated to be 1% of the elderly population over 60 years of age. Additionally, populations are aging in most developed countries. As a result, such countries expect a significant number of elderly people to suffer from various diseases. Therefore, developed nations with sizable elderly populations are currently preparing to treat many geriatric diseases, including PD.
The symptoms of PD include motor symptoms such as bradykinesia, tremors, and freezing of gait, as well as non-motor symptoms such as insomnia and depression. These symptoms significantly degrade the quality of life (QOL) of patients or those around them, including caregivers [1]-[3]. Various treatment methods have been studied to overcome these disadvantages. However, no definite cure has yet been established.
The treatments prescribed for most patients with PD include medication and motor rehabilitation. Decades ago, exercise therapy was used as an aid for medications and surgical plans [4]. However, recently, improvements in the QOL, and motor and non-motor symptoms of patients with PD following rehabilitation have been noted [5]-[8], demonstrating the validity of physical rehabilitation. Therefore, rehabilitation is considered as an independent treatment method for reducing the progression speed of PD [9]-[10], rather than a treatment method that must be combined with medications.
Augmented feedback training is a rehabilitation method that allows patients to maintain or break certain motor conditions [4]. For example, two methods can be implemented as follows. (1) For a patient who cannot maintain a stable physical state, one can provide feedback to the patient when their physical state becomes stable [11]. (2) For a patient who can maintain a stable physical state, one can provide feedback to the patient when their physical state becomes unstable [12]. The former method is called “breaking” and the latter is called “keeping.” The effects of augmented feedback training along with the improved motor skills of PD patients are becoming more apparent because studies have shown that they can increase balance [13]-[21], gait speed, stride length [22]-[26], and QOL [27].
Various wearable devices have been designed and developed to support the rehabilitation of different patients and maximize treatment effectiveness [28]. Similarly, studies on wearable devices using augmented feedback training or similar rehabilitation methods are underway [16][20][29]-[30].
We consider that wearable devices or mechanisms using simple and mechanical techniques could be implemented for augmented feedback training. A user could sense metal bead movements that click a microswitch during walking based on their sense of touch and a user could sense auditory feedback from the clicking of a microswitch with a buzzer module such as a piezo buzzer. We consider that the process of walking detection and feedback generation could be successful for auditory feedback training and could improve walking ability by increasing walking speed and regulating cadence.
Therefore, we designed and developed a walking detection device and mechanism to confirm the feasibility and performance of this concept. The device and mechanism were evaluated in this pilot study to confirm their rehabilitation effects on PD patients.
2. Device Design and Experimental Sequence
2.1 Mechanism for Walking Detection
The best location on the lower limbs for attaching a device should be considered before beginning device design. The most variable locations during one gait cycle are considered to be the best locations for walking detection. Therefore, the movement (position) of each lower limb joint during one gait cycle was observed.
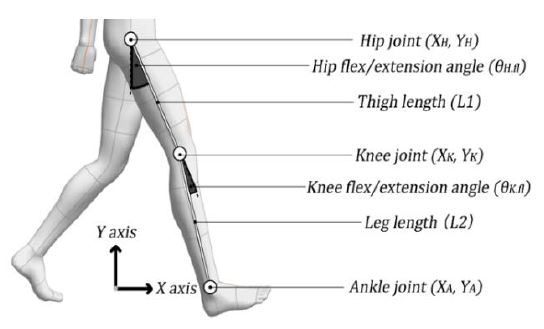
In this test, we considered the hip joint and knee joint flexion/extension angles, thigh length (L1), leg length (L2), and initial hip joint position. These factors are illustrated in Figure 1.
| (1) |
| (2) |
| (3) |
| (4) |
| (5) |
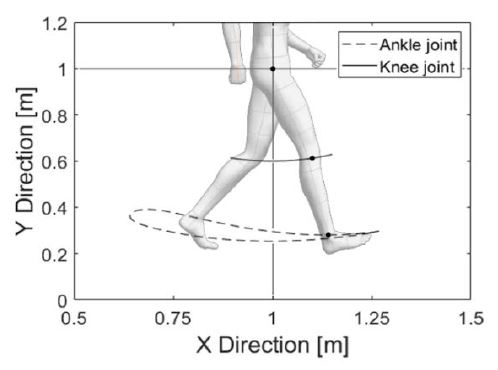
As expressed in Equation (1), the hip joint position is assumed to be fixed and it is used to derive the knee and ankle joint positions. Equation (2) provides an estimation of the knee joint position based on the hip joint position and hip joint angle. Equation (3) provides an estimation of the ankle joint position based on the knee joint position and angle. The estimation of each joint trajectory using these equations is illustrated in Figure 2.
In this estimation, the most variable location of the lower limb during one gait cycle is near the ankle joint. Therefore, a device for walking detection should be designed to be attached near the ankle joint.
Areas below the ankle joint were not considered as suitable locations for attaching a device. We planned to use metal beads and microswitches for walking detection, which were too large to attach below the ankle joint such as on the top or side of the feet or shoes. After confirming that the location where the device would be attached appeared reasonable, we observed how the metal beads and microswitch would react as a result of the force generated during one gait cycle. We observed these relationships using several equations and estimations.
First, the acceleration was estimated using Equation (3), which estimates the ankle joint position. The ankle joint position and time required for 1% of the gait cycle, denoted as T, were required for estimation.
By using Equation (4), the velocity near the ankle joint was calculated based on the ankle joint position and T. Subsequently, the acceleration near the ankle joint was calculated using Equation (5). Then, the angle between the leg and X axis (shown in Figure 2) was calculated to observe the direction of the force that could be measured by the device.
| (6) |
| (7) |
| (8) |
| (9) |
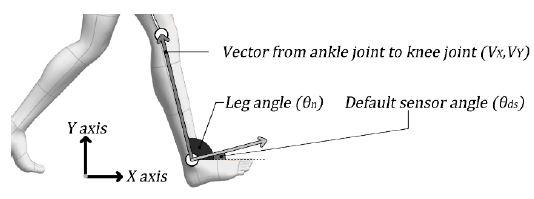
The vector from the ankle to the knee joint was calculated using Equation (6). The angle between the leg and X axis was calculated using Equations (7) and (8). The angle calculated using Equation (8) was converted into the vertical direction of the leg, as shown in Equation (9), and the angle of the device, as shown in Figure 3.
| (10) |
| (11) |
By using Equation (10), the acceleration calculated using Equation (5) was reflected in the frame of the default sensor angle. Subsequently, the force exerted by the metal bead on the microswitch as a result of walking was calculated by inputting the actual mass of the metal bead used in the experiments (0.05 kg), as shown in Equation (11). The maximum calculated force during a gait cycle is the force that can affect the clicking microswitch.
Subsequently, the relationship between the force required to click the microswitch and the sensor angle was observed. The sensor angle is the angle between the vertical direction of the leg and the metal bead/microswitch, as shown in Figure 4. Additionally, the relationship between the sensor angle θS, force to click the microswitch Freq, and force to click the microswitch as the sensor angle increases Freq was observed.
| (12) |
| (13) |
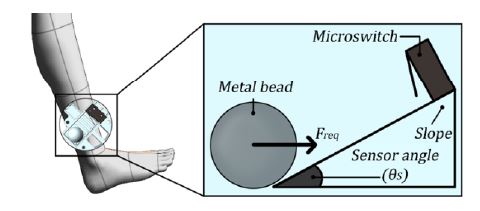
Image illustrating the relationship between the metal bead, microswitch, and sensor angle in the assembly
This relationship can be expressed by a simple triangular function, as shown in Equation (12). Consequently, Equation (13) should satisfy the microswitch clicking condition as a result of the user’s walking motion. Next, we confirmed the feasibility of the mechanism presented above using public data from another study.
Moreira et al. [31] requested that experimental participants walk at a specific speed and collected various features during one gait cycle. We utilized this research data in our walking detection mechanism. Summary statistics for these data are presented in Table 1.

Statistics for research data from Moreira et al. [31]. L1 and L2 were derived from data from Scataglini et al. [33].
The hip and knee joint angles in the research results were converted into a normal distribution using their average and standard deviation. Subsequently, 999 samples covering the range from 0.01% to 99.9% of the normal distribution (each covering 0.01%) were generated. The generated samples were converted into forces using Equations (1) to (11), and the maximum force of each sample was determined. The relationship between the forces from the samples and Freq is presented in Section 3.1.
The force was measured at different walking speeds. However, it was difficult to determine the relationship between force and frequency. Therefore, this relationship was converted into a type of walking detection rate (WDR). The WDR can be derived as shown in Equations (14) and (15).
| (14) |
| (15) |
Equation (14) can be used if all walking features and the number of detected gait cycles are specified. However, Equation (15) should be used if the number of detected gait cycles is not specified. In the case of estimation based on the results from Moreira et al. [31], Equation (15) appears to be more reasonable. Equation (15) indicates where Freq is ranked in the normal distribution of the force generated during walking. If Freq is ranked lower, it indicates that most of the force generated by walking is greater than Freq. It also suggests a higher number of microswitch clicks and higher WDR. In contrast, if Freq is ranked higher, then the number of microswitch clicks and WDR are lower. The relationship between Freq and FA is described in Section 3.1.
2.2 Design and Fabrication
Before designing a device, its operating principles should be considered. We referred to two types of augmented feedback training, namely (1) keeping and (2) breaking. The designed device is expected to detect walking for long periods and frequently because the proposed mechanism is based on walking detection. Under this condition, a keeping-type device could generate excessive feedback. Therefore, we adopted the breaking method for our device. These types are illustrated in Figure 5.
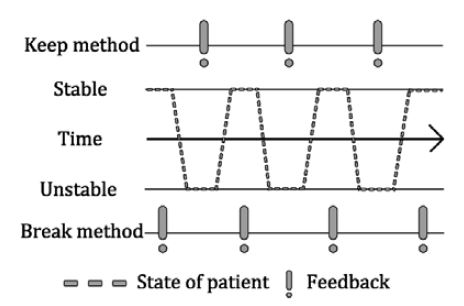
Image illustrating two methods: the keeping and breaking methods of augmented feedback training. Keeping generates feedback under unstable movement. Breaking generates feedback under stable movement
The most important process is to generate feedback from the clicking microswitch as a result of the movement of the metal bead. The device algorithm was designed by incorporating additional options into this process. A flowchart of the overall process is presented in Figure 6.
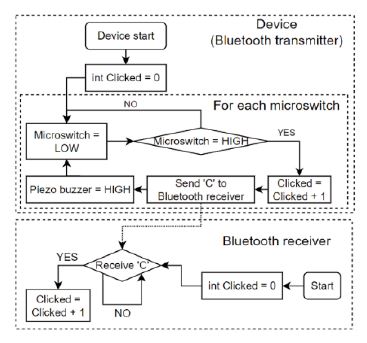
Flowchart of the walking detection counter, feedback generator algorithm, and Bluetooth data receiver
The device was designed under the premise that we would attach a walking detection sensor (metal bead and microswitch) to each ankle of a user as part of the device. Additionally, a Bluetooth data communication function and its corresponding module were used for wireless data communication. Users and their caregivers can receive walking detection results on their smartphones or other devices using Bluetooth.
The initial state of the device, as shown in the flowchart, is “Microswitch = LOW,” indicating an unclicked microswitch, and “Clicked = 0,” indicating the number of detected walking cycles. When the microswitch is clicked during walking, the value of “Clicked” increases and a specific string or integer is sent to the Bluetooth receiver. Subsequently, the piezo buzzer provides auditory feedback. Finally, the status of the microswitch returns to LOW and waits for clicking. The initial state of the Bluetooth receiver is “Clicked = 0.” The value of “Clicked” increases if a specific string or integer is received from the transmitter. However, this device can also be used without a Bluetooth receiver. The user can determine the number of walking cycle detections using the auditory feedback from the piezo buzzer, value of “Clicked” on the device, and Bluetooth receiver.
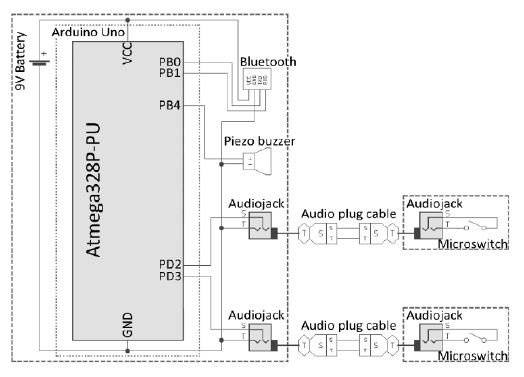
The device was fabricated with the implementation of a device algorithm. An Arduino Uno was used as the microcontroller unit (MCU). A Bluetooth module (HC-06) was used for Bluetooth wireless communication. A piezo buzzer was used as an auditory feedback generator. Audio jacks were used to receive data from the sensor microswitch. These components were used as the main board components of the device.
Microswitches, metal beads, and audio jacks were used for the sensor parts of the device to send microswitch click data to the MCU. Additionally, audio plug cables were used for data communication between the main board and sensor parts. A schematic of both the main board and sensor parts is presented in Figure 7.
FDM 3D printing (GIANTBOT G5, GIANTBOT) was used to fabricate the device structures. The biggest obstacle in designing the structure was the realization of a method for controlling the angle of the sensor. This obstacle is associated with the accuracy of walking detection. The device should have a sensor angle indicator or a similar function. Therefore, the structure shown in Figure 7 was designed.
Figure 8(a) presents the sensor set at 45°. Figure 8(b) presents the sensor parts, including the metal bead and microswitch. As shown in Figure 8(a), the sensor angles are marked every 5° and the user can control the sensor angle using these indicators. After formulating a plan to create the structure of the device, its hardware was fabricated. The main board and sensor parts were fabricated using a 3D printer. The device components were then arranged as shown in Figure 9. It was difficult to attach the sensor to the sagittal plane based on the curved surface of the ankle. To solve this problem, the sensor socket illustrated in Figure 9(i) has a curved area on the outside for attachment to the ankle. Additionally, the socket has a flat area inside for fixing the sensor in the sagittal plane.
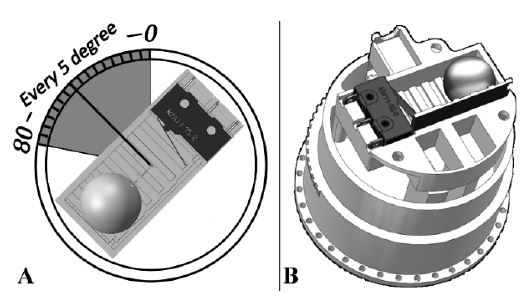
Sensor parts of the device and sensor angle adjustment method with angle indicator. (a) The sensor is set at 45°. (b) Image of the sensor using the metal bead and microswitch, sensor angle indicator, and its socket
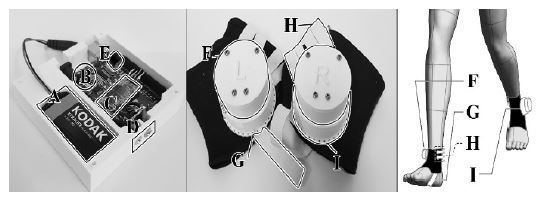
Arranged components of the device. A: 9 V battery, B: Arduino Uno as MCU, C: Bluetooth module HC-06, D: Audio jacks, E: Piezo buzzer, F: Sensor, G: Elastic band to prevent rotating of the sensor, H: Elastic band to fix the position of the sensor, I: Socket for the sensor, including the sensor angle indicator.
Figure 9 presents the main board and sensor parts of the device. A is a 9 V battery for the power supply. B is the Arduino Uno used in the MCU. C is a Bluetooth module (HC-06) for wireless communication. D is an audio jack for data communication between the sensor and main board. E is a piezo buzzer used for auditory feedback. F is the sensor. G and H are the elastic bands supporting the sensor. I is the sensor socket, which includes a sensor angle indicator.
2.3 Experimental Setup
Several experiments were planned to observe whether the designed device could detect user walking and whether the sensor angle could affect walking detection. Before the experiments, all participants provided written consent for the content, goals, and scope of use of the experimental results. They also agreed that they could quit the experiment at any time if they felt uncomfortable.
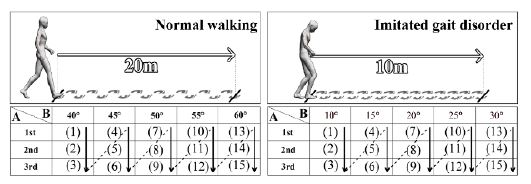
Preliminary experiments were planned to confirm that the designed device could distinguish between normal and abnormal walking. The experimental participants were requested to walk a specific distance while wearing the designed device. The walking detection data were recorded by controlling the walking pattern (normal or abnormal) and the sensor angle was observed. There were three participants and none had PD (non-PD group). Statistical information regarding the participants is presented in Table 2.
The experimental participants walked 20 m normally to confirm the walking detection accuracy for a normal walking pattern. The sensor angles for the experiments were set to 20°, 25°, 30°, 35°, and 40°. Walking detection data from the experiments were collected for each sensor angle.
Experimental participants were shown a short video on gait disorders in PD and were requested to imitate a gait disorder to confirm the walking detection accuracy for abnormal walking patterns. Subsequently, the participants walked 10 m while imitating a gait disorder. The sensor angles for the experiments were set to 10°, 15°, 20°, 25°, and 30°. Walking detection data were collected and analyzed.
The sensor angles were set differently because the walking speed of normal walking may be higher than that of imitated gait disorders. Therefore, we set the sensor angles for normal walking to be greater than those for the imitated gait disorder. The experimental sequence is illustrated in Figure 10.
Experiments were planned to observe how the device would return walking detection results for normal and PD patients. Walking speed was controlled in the experiments using a treadmill. Participants were asked to walk at a specific speed with a specific number of steps per minute (SPM). There were 10 participants in the normal group and two in the PD group. Participant information is presented in Table 3. The Hoehn and Yahr scale was used to evaluate the degree of PD [31].
Normal participants were requested to walk with treadmill speeds of 1.0, 1.5, 2.0, 2.5, and 3.0 km/h. They were also requested to walk with a 90 bpm metronome sound. The sensor angles were set to 20°, 25°, 30°, 35°, 40°, 45°, and 50°. We aimed to determine the relationship between walking speed, sensor angle, and WDR.
The experimental setups for PD patients were set differently to reduce the danger of injuries that could occur in the experiments. First, the participants were requested to determine the most comfortable walking speed and SPM. After determining the speed, the treadmill speeds for the experiment were set at 30%, 60%, 100%, 140%, and 170% of the comfortable walking speed of each participant. Moreover, they were requested to walk with a 90 bpm metronome sound.
However, 30% of walking speed could not be reproduced if it was lower than 0.5 km/h because the lowest treadmill speed was 0.5 km/h. The sensor angles were set to 20°, 25°, 30°, 35°, and 40°. We aimed to determine the relationship between walking speed, sensor angle, and WDR. The experimental sequence is shown in Figure 11. Detailed information about the patients is shown in Table 4.
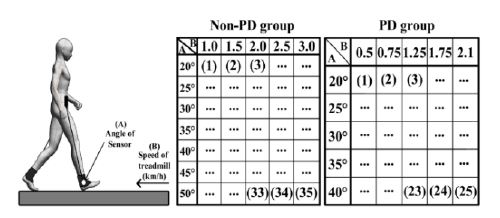
Experimental procedure. A: Sensor angle B: Average speed of treadmill (km/h). The numbers in each table indicate the sequence of experiments
After the experiments, the PD patients who participated were provided with devices to observe the potential of the devices for gait symptom rehabilitation through daily usage. The sensor angles of the devices were set to 40°. At the start of use, approximately 40% of the WDR was generated. Patients were required to report their exercise through smartphone messages (e.g., “Exercised from 14:00 to 16:00”). Consequently, each patient exercised freely (light walking) with the device for eight months, four times per week, for two hours per session. After eight months, the patients were invited back and requested to determine their most comfortable walking speed and SPM. These results were compared to those collected before the eight-month period.
3. Results
3.1 Mechanism validation
The relationship between the forces from the samples and Freq is illustrated in Figure 12.
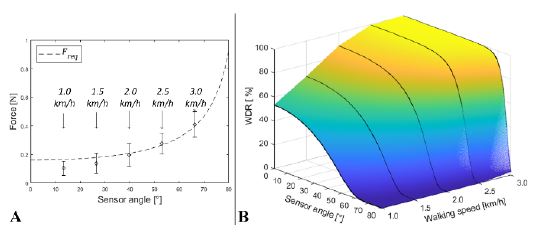
Image of design basis validation. (a) Relationship between Freq and FA with walking speed. (b) Converted WDR based on the sensor angle and walking speed
Figure 12 indicates that the higher the walking speed, the larger the force that can be affected by the microswitch. As shown in Figure 12(a), the forces that occur during walking increase with walking speed. The average force and its standard deviation bar do not overlap with Freq at a walking speed of 1.0 km/h. However, the average force and standard deviation bar overlap by over half at a speed of 3.0 km/h. Figure 12 reveals that the walking detection mechanism can rarely detect walking at low walking speeds and high sensor angles. However, the mechanism can easily detect walking at fast speeds and low sensor angles.
As shown in Figure 12(b), the relationship between Freq and FA was converted into a WDR. The higher the WDR at a smaller sensor angle, the higher the walking speed. Consequently, the mechanism that we derived can reasonably detect walking and calculate WDR using sensor angles and walking speeds. As a result, we can secure evidence for the use of the developed walking detection mechanism with metal beads and microswitches.
3.2 Preliminary experiment to observe the performance of the device
The experimental results are presented in Figure 13. Figure 13(a) shows the WDRs of the participants when they walked freely. Figure 13(b) shows the WDRs when participants imitated a gait disorder after watching a video of the gait disorder in PD.
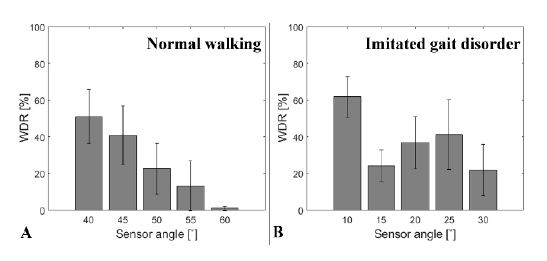
Results for the imitated gait disorder effect test. (a) Data from normal walking; (b) Data from the imitated gait disorder. All error bars represent standard error
The pattern of WDR when participants walked freely was linear. A higher WDR was observed for a smaller sensor angle. Overall, 52% of the WDR was observed at 40° and 2% was observed at 60°. Furthermore, the relationship between the WDR and sensor angle was irregular when the participants imitated the gait disorder. These results indicate that the patterns of the WDR during normal and abnormal walking differ.
3.3 Device performance experiments
Experiments were conducted to confirm that the developed device can perform the desired functions. Figure 14 presents the results. Figures 14(a) and (b) show the results for the non-PD and PD groups, respectively.
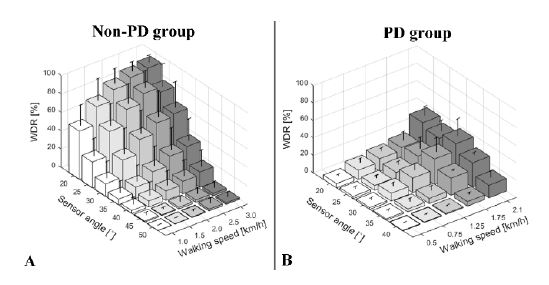
PD and non-PD distinguishability test results. (a) Average WDR for the non-PD group. (b) Average WDR for the PD group. All error bars represent standard deviation
The results reveal that the WDR for normal people is affected by walking speed and sensor angle. Additionally, the pattern of the WDR is similar to the results of the mechanism evaluation (Figure 12(b)) and preliminary experiments (Figure 12). Higher WDR patterns can be observed at higher walking speeds and lower sensor angles. The results of the PD group differed from those of the non-PD group. The relationship between the walking speed and WDR is similar, but the relationship between the sensor angle and WDR is different. In the case of the PD group, the patterns of the sensor angle and WDR relationship are uncertain. These results are presented in Appendix A.
3.4 Preliminary experiments on the potential for gait symptom rehabilitation
Experiments were conducted to determine the potential of the developed system for gait symptom rehabilitation. The results are presented in Table 5.
As shown in Table 5, the walking speed and SPM of both participants increased. In the case of participant A, the most comfortable walking speed increased from 1.4 km/h to 2.7 km/h and their SPM increased from 86 to 88. In the case of participant B, the walking speed increased from 1.1 km/h to 2.1 km/h and their SPM increased from 75 to 86.
4. Discussion & Conclusions
This study investigated the feasibility of a walking detection mechanism and algorithm for augmented feedback training using small metal beads and microswitches. A walking detection device was designed and tested. Experiments demonstrated that the mechanism and algorithm can detect walking in normal people and people with PD. Several wearable devices have been developed by other researchers for augmented feedback training. Byl et al. [29] researched wearable device systems and their effects on gait training using inertia measurement units and pressure sensors. Such a device system can provide feedback based on user gaits. Cho et al. [34] investigated the effects of visual feedback training on gait performance using a double-axis electrogoniometer. Jung et al. [35] investigated the effects of an assistance system in the form of an instrumented cane on gait training. Lee et al. [36] studied the effects of neurofeedback training on brain waves and gait training. Kim et al. [37] researched a gait detection and classification mechanism and algorithm using an inertia measurement unit. In addition to the research mentioned above, many other studies on augmented feedback or wearable device systems have been conducted to overcome or improve gait disorders. The walking detection mechanism and algorithm developed in this study have the following novelty. (1) The developed mechanism is simple and mechanical. Only small beads, microswitches, and angle-adjustable structures are required for fabricating walking-detection devices. (2) The return values from walking detection are simple. The developed device returns a simple digital value of one (detected) or zero (not detected) during device usage. (3) This mechanism is universal. According to the features of the simple return values, they can be used for any type of augmented feedback.
In this study, a simple and mechanical wearable device for augmented feedback training was determined to be novel and feasible. The process of moving a metal bead to click on a microswitch was determined to effective for allowing a user to sense the process of training with auditory and vibrotactile stimuli. Therefore, we developed a device with this mechanism and observed its performance for walking detection and the rehabilitation of gait symptoms. The pattern of movements of the lower limbs during one gait cycle was observed using representative features of gait analysis and joint angles. The velocity and acceleration near the ankle joint were derived based on these patterns. Additionally, the default sensor angle was derived from these patterns. The process of walking, movement of metal beads, clicking of microswitches, and generation of walking detection feedback and signals were derived from the recorded patterns.
This process was evaluated based on research data from Moreira et al. [31]. We verified the feasibility of the walking detection mechanism using metal beads and microswitches by converting the results from the process into WDRs. After observing the feasibility of the mechanism as an augmented feedback generator, a device using this mechanism was designed. Several experiments to observe the actual usage experience were conducted after designing and fabricating the device and the following conclusions were drawn. (1) The WDR resulting from walking detection can be controlled by the walking speed and sensor angle. (2) The WDRs resulting from the walking of healthy people and people with PD differed. (3) The WDRs of the PD patients could not react sensitively to the sensor angle and walking speed. (4) Gait symptoms such as walking speed and SPM can be improved as a result of the long-term usage of the developed device.
There are several noteworthy points of discussion regarding the experimental process. First, young people participated in the non-PD group and PD patients around the age of 71 years participated in the PD group. This significant difference in age may have affected the WDR results. However, this is considered to be acceptable because the significant finding is the trend of WDR based on the sensor angle and walking speed, not the magnitude of the WDR. The results for the WDRs of the non-PD and PD groups indicate how the regularity of WDR differed between the groups. Second, how we attempted to maintain the gait stability of the PD group during the experiments is a point of discussion because it could affect the WDR of the PD group. A participant could request rest time or other accommodations such as drinks and snacks anytime during the experiments. Participants were asked to rest when the sensor angle was changed. These frequent rests could prevent the degradation of gait stability. Additionally, participants were not allowed to hold the hand guide of the treadmill. We considered that this action could affect the WDR. The patients were asked to express their intention to rest when they felt tired. The WDR data from an experiment were deleted if the participant held a hand guide or requested a rest during data collection. Third, similar to the second point, we attempted to maintain the imitation of gait disorders during the experiments. The experimental staff provided example videos before each experiment. Finally, the PD patients used medication before the long-term usage experiment and maintained their medication usage during the experiment. Each experiment before and after rehabilitation was conducted at a similar time of day. In this manner, we attempted to prevent the disturbance of results by unknown factors.
However, we should also consider the limitations of these experiments. Unlike the mechanism and device design, the device performance tests were limited by an insufficient number of participants. The conclusion that the WDR pattern can be controlled by the walking speed and sensor angle is reasonable. However, the conclusion that the WDR can be used for classification between healthy people and PD patients is tenuous. Therefore, future research should include a larger number of experimental participants to standardize the user walking detection data and rehabilitation. Next, we should improve our devices to evaluate user gait. Therefore, we will design a new version of a gait detection device using the microswitch on-off method and a more precise gait evaluation method such as an inertia measurement unit. Additionally, future research should evaluate and confirm that the developed device can classify the results of healthy people and people with PD.
We have addressed the limitations of this study and provided our suggestions for future work. After the success of future work, the device that we have designed can be used as follows:
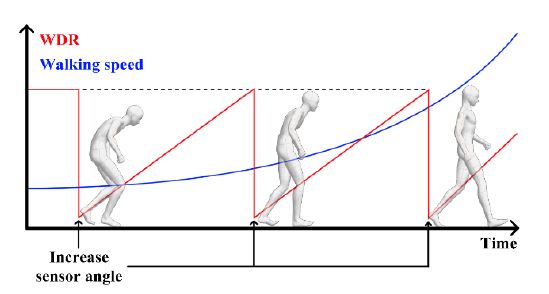
- (1) The device can be used for gait disorder rehabilitation for people with PD or other neurodegenerative diseases. The device can detect walking based on sensor angles and walking speeds. Based on this feature, a user can use the device as follows. If the recorded WDR is too high, the WDR can be reduced by increasing the angle of the sensor. As the sensor angle increases, walking speed should be increased to improve the WDR. The WDR gradually increases if the user attempts to detect walking frequently at increased angles. This process is repeated, sustained, and maintained, and the walking ability of the user improves. This process is illustrated in Figure 15.
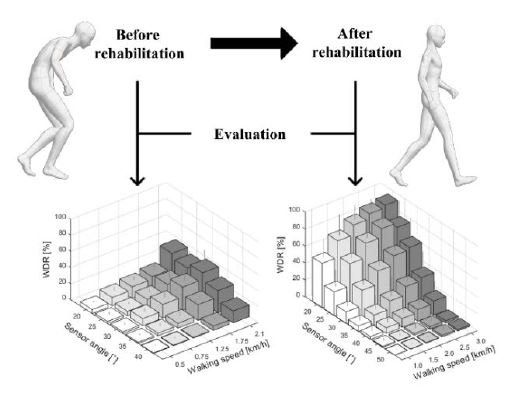
- (2) It can also be used as an additional measurement for gait disorder evaluation in patients with PD and other neurodegenerative diseases. The designed device detects and classifies walking based on the angle and speed of the sensor. If a user experiences an imbalance while walking as a result of gait disorders when using the developed device, the results may be significantly different from those of healthy people. Therefore, the developed device can be used to evaluate the severity of a patient's gait disorder condition and determine their condition after rehabilitation. This process is illustrated in Figure 16.
Acknowledgments
This research was supported by the Basic Science Research Program through the National Research Foundation of Korea (NRF) funded by the Ministry of Education and Ministry of Science (2019R1G1A1009980).
Conflict of Interest
The authors declare no conflict of interest.
Author Contributions
Conceptualization, H. Kim and J. Ko; Software, H. Kim; Formal Analysis, H. Kim and J. Ko; Investigation, H. Kim; Resources, H. Kim; Data Curation, H. Kim and J. Ko; Writing-Original Draft Preparation, H. Kim and J. Ko; Writing-Review & Editing, H. Kim and J. Ko; Visualization, H. Kim; Supervision, J. Ko; Project Administration, J. Ko. All authors have read and agreed to the published version of the manuscript.
References
- E. R. Dorsey, A. Elbaz, E. Nichols, and et al., “Global, regional, and national burden of Parkinson’s disease, 1990–2016: A systematic analysis for the global burden of disease study 2016,” The Lancet Neurology, vol. 17, no. 11, pp. 939-953, 2018.
-
J. M. Hausdorff, “Gait dynamics in Parkinson’s disease: Common and distinct behavior among stride length, gait variability, and fractal-like scaling,” Chaos: An Interdisciplinary Journal of Nonlinear Science, vol. 19, no. 2, pp. 026113, 2009.
[https://doi.org/10.1063/1.3147408]

-
M. E. Morris, R. Iansek, T. A. Matyas, and J. J. Summers, “The pathogenesis of gait hypokinesia in Parkinson's disease,” Brain, vol. 117, no. 5, pp. 1169-1181, 1994.
[https://doi.org/10.1093/brain/117.5.1169]

-
G. Abbruzzese, R. Marchese, L. Avanzino, and E. Pelosin, “Rehabilitation for Parkinson's disease: Current outlook and future challenges,” Parkinsonism & Related Disorders, vol. 22, pp. S60-S64, 2016.
[https://doi.org/10.1016/j.parkreldis.2015.09.005]

-
R. S. Monteiro-Junior, T. Cevada, B. R. R. Oliveira, and et al., “We need to move more: Neurobiological hypotheses of physical exercise as a treatment for Parkinson’s disease,” Medical Hypotheses, vol. 85, no. 5, pp. 537–541, 2015.
[https://doi.org/10.1016/j.mehy.2015.07.011]

-
H. J. R. van Duijnhoven, A. Heeren, A. M. Marlijin, and et al., “Effects of exercise therapy on balance capacity in chronic stroke,” Stroke, vol. 47, no. 10, pp. 2603-2610, 2016.
[https://doi.org/10.1161/STROKEAHA.116.013839]

-
C. L. Tomlinson, S. Patel, C. Meek, and et al., “Physiotherapy versus placebo or no intervention in Parkinson's disease,” Cochrane Database of Systematic Reviews, no. 9, 2013.
[https://doi.org/10.1002/14651858.CD002817.pub4]

-
H. Gunn, S. Markevics, B. Haas, and et al., “Systematic review: The effectiveness of interventions to reduce falls and improve balance in adults with multiple sclerosis,” Archives of Physical Medicine and Rehabilitation, vol. 96, no. 10, pp. 1898-1912, 2015.
[https://doi.org/10.1016/j.apmr.2015.05.018]

-
J. E. Ahlskog, “Does vigorous exercise have a neuroprotective effect in Parkinson disease?,” Neurology, vol. 77, no. 3, pp. 288-294, 2011.
[https://doi.org/10.1212/WNL.0b013e318225ab66]

-
F. Yang, Y. Trolle Lagerros, R. Bellocco, and et al., “Physical activity and risk of Parkinson’s disease in the Swedish National March Cohort,” Brain, vol. 138, no. 2, pp. 269-275, 2015.
[https://doi.org/10.1093/brain/awu323]

-
J. M. Galea, E. Mallia, J. Rothwell, and J. Diedrichsen, “The dissociable effects of punishment and reward on motor learning,” Nature Neuroscience, vol. 18, no. 4, pp. 597-602, 2015.
[https://doi.org/10.1038/nn.3956]

-
A. B. Trotter and D. A. Inman, “The use of positive reinforcement in physical therapy,” Physical Therapy, vol. 48, no. 4, pp. 347-352, 1968.
[https://doi.org/10.1093/ptj/48.4.347]

-
K. Takeda, H. Mani, N. Hasegawa, and et al., “Adaptation effects in static postural control by providing simultaneous visual feedback of center of pressure and center of gravity,” Journal of Physiological Anthropology, vol. 36, no. 1, p. 31, 2017.
[https://doi.org/10.1186/s40101-017-0147-5]

-
A. Mirelman, T. Herman, S. Nicolai, and et al., Audio-biofeedback training for posture and balance in patients with Parkinson’s disease,” Journal of NeuroEngineering and Rehabilitation, vol. 8, no. 1, p. 35, 2011.
[https://doi.org/10.1186/1743-0003-8-35]

-
N. Hasegawa, K. Takeda, M. Mancini, and et al., Differential effects of visual versus auditory biofeedback training for voluntary postural sway,” PLOS ONE, vol. 15, no. 12, pp.1-16, 2021.
[https://doi.org/10.1371/journal.pone.0244583]

-
P. Ginis, A. Nieuwboer, M. Dorfman, and et al., “Feasibility and effects of home-based smartphone-delivered automated feedback training for gait in people with Parkinson's disease: A pilot randomized controlled trial,” Parkinsonism & Related Disorders, vol. 22, pp. 28-34, 2016.
[https://doi.org/10.1016/j.parkreldis.2015.11.004]

-
M. Dozza, L. Chiari, B. Chan, L. Rocchi, F. B. Horak, and A. Cappello, “Influence of a portable audio-biofeedback device on structural properties of postural sway,” Journal of NeuroEngineering and Rehabilitation, vol. 2, p. 13, 2005.
[https://doi.org/10.1186/1743-0003-2-13]

-
K. H. Sienko, R. D. Seidler, W. J. Carender, and et al., Potential mechanisms of sensory augmentation systems on human balance control,” Frontiers in Neurology, vol. 9, 2018.
[https://doi.org/10.3389/fneur.2018.00944]

-
A. Mirelman, I. Maidan, T. Herman, and et al., “Virtual reality for gait training: Can it induce motor learning to enhance complex walking and reduce fall risk in patients with Parkinson’s disease?,” The Journals of Gerontology: Series A, vol. 66A, no. 2, pp. 234-240, 2011.
[https://doi.org/10.1093/gerona/glq201]

-
I. Carpinella, D. Cattaneo, G. Bonora, and et al., Wearable sensor-based biofeedback training for balance and gait in Parkinson disease: A pilot randomized controlled trial,” Archives of Physical Medicine and Rehabilitation, vol. 98, no. 4, pp. 622-630.e3, 2017.
[https://doi.org/10.1016/j.apmr.2016.11.003]

-
M. Dozza, L. Chiari, R. J. Peterka, and et al., “What is the most effective type of audio-biofeedback for postural motor learning?,” Gait & Posture, vol. 34, no. 3, pp. 313-319, 2011.
[https://doi.org/10.1016/j.gaitpost.2011.05.016]

-
X. Shen and M. K. Y. Mak, “Balance and gait training with augmented feedback improves balance confidence in people with Parkinson’s disease: A randomized controlled trial,” Neurorehabilitation and Neural Repair, vol. 28, no. 6, pp. 524-535, 2014.
[https://doi.org/10.1177/1545968313517752]

-
M. R. C. van den Heuvel, G. Kwakkel, P. J. Beek, and et al., “Effects of augmented visual feedback during balance training in Parkinson’s disease: A pilot randomized clinical trial,” Parkinsonism & Related Disorders, vol. 20, no. 12, pp. 1352-1358, 2014.
[https://doi.org/10.1016/j.parkreldis.2014.09.022]

-
Y. -Y. Liao, Y. -R. Yang, Y. -R. Wu, and R. -Y. Wang, “Virtual reality-based Wii Fit training in improving muscle strength, sensory integration ability, and walking abilities in patients with Parkinson’s disease: A randomized control trial,” International Journal of Gerontology, vol. 9, no. 4, pp. 190-195, 2015.
[https://doi.org/10.1016/j.ijge.2014.06.007]

-
P. V. Mhatre, I. Vilares, S. M. Stibb, and et al., “Wii Fit balance board playing improves balance and gait in Parkinson disease,” PM&R, vol. 5, no. 9, pp. 769-777, 2013.
[https://doi.org/10.1016/j.pmrj.2013.05.019]

-
Y. Baram, J. Aharon-Peretz, S. Badarny, “Closed-loop auditory feedback for the improvement of gait in patients with Parkinson’s disease,” Journal of the Neurological Sciences, vol. 363, pp. 104-106, 2016.
[https://doi.org/10.1016/j.jns.2016.02.021]

-
M. Gooßes, J. Saliger, A. -K. Folkerts, and et al., “Feasibility of music-assisted treadmill training in Parkinson’s disease patients with and without deep brain stimulation: Insights from an ongoing pilot randomized controlled trial,” Frontiers in Neurology, vol. 11, 2020.
[https://doi.org/10.3389/fneur.2020.00790]

-
T. Bowman, E. Gervasoni, C. Arienti, and et al., “Wearable devices for biofeedback rehabilitation: A systematic review and meta-analysis to design application rules and estimate the effectiveness on balance and gait outcomes in neurological diseases,” Sensors, vol. 21, no. 10, p. 3444, 2021.
[https://doi.org/10.3390/s21103444]

-
N. Byl, W. Zhang, S. Coo, and et al., “Clinical impact of gait training enhanced with visual kinematic biofeedback: Patients with Parkinson’s disease and patients stable post stroke,” Neuropsychologia, vol. 79, Part B, pp. 332-343, 2015.
[https://doi.org/10.1016/j.neuropsychologia.2015.04.020]

-
R. Escamilla-Nunez, A. Michelini, J. Andrysek, “Biofeedback systems for gait rehabilitation of individuals with lower-limb amputation: A systematic review,” Sensors, vol. 20, no. 6, p. 1628, 2020.
[https://doi.org/10.3390/s20061628]

-
L. Moreira, J. Figueiredo, P. Fonseca, and et al., “Lower limb kinematic, kinetic, and EMG data from young healthy humans during walking at controlled speeds,” Scientific Data, vol. 8, no. 1, p. 103, 2021.
[https://doi.org/10.1038/s41597-021-00881-3]

-
M. M. Hoehn and M. D. Yahr, “Parkinsonism,” Neurology, vol. 17, no. 5, p. 427, 1967.
[https://doi.org/10.1212/WNL.17.5.427]

-
S. Scataglini, G. Andreoni, J. Gallant, and et al., “Smart clothing design issues in military applications,” Advances in Human Factors in Wearable Technologies and Game Design, pp. 158-168, 2018.
[https://doi.org/10.1007/978-3-319-94619-1_15]

-
S. -H. Cho, H. -K. Shin, Y. -H. Kwon, and et al., “Cortical activation changes induced by visual biofeedback tracking training in chronic stroke patients,” NeuroRehabilitation, vol. 22, no. 2, pp. 77-84, 2007.
[https://doi.org/10.3233/NRE-2007-22201]

-
K. Jung, Y. Kim, Y. Cha, and et al., “Effects of gait training with a cane and an augmented pressure sensor for enhancement of weight bearing over the affected lower limb in patients with stroke: a randomized controlled pilot study,” Clinical Rehabilitation, vol. 29, no. 2, pp. 135-142, 2015.
[https://doi.org/10.1177/0269215514540923]

-
Y. -S. Lee, S. -H. Bae, S. -H. Lee, and et al., “Neurofeedback training improves the dual-task performance ability in stroke patients,” The Tohoku Journal of Experimental Medicine, vol. 236, no. 1, pp. 81-88, 2015.
[https://doi.org/10.1620/tjem.236.81]

-
H. Kim, J. -W. Kim, and J. Ko, “Gait disorder detection and classification method using inertia measurement unit for augmented feedback training in wearable devices,” Sensors, vol. 21, no. 22, p. 7676, 2021.
[https://doi.org/10.3390/s21227676]


