Analysis of effects of and potential improvements for vessel speed reduction program
Copyright ⓒ The Korean Society of Marine Engineering
This is an Open Access article distributed under the terms of the Creative Commons Attribution Non-Commercial License (http://creativecommons.org/licenses/by-nc/3.0), which permits unrestricted non-commercial use, distribution, and reproduction in any medium, provided the original work is properly cited.
Abstract
Air pollution has become an important challenge worldwide over the few decades owing to rapid urbanization and industrialization. Among the various sources of measured emissions, the proportion of air pollutants from oceangoing vessels is increasing. In response, the Ministry of Oceans and Fisheries introduced the Vessel Speed Reduction (VSR) program in December of 2019. In this study, we used actual operational records from a 4,600 TEU container vessel to calculate its total emissions on its journey from the Port of Busan to the Port of Tacoma in the US and then compared the emissions generated in four scenarios to determine the optimal operating conditions. Among air pollutants, emissions were calculated only for TSP, PM10, PM2.5, NMVOCs, and CO, which are typically related to the occurrence of fine dust. To simplify our analysis, operating records from the same conditions as the 4,600 TEU container ship were applied to the 10,000 TEU container vessel and 7,500 CEU Pure Car and Truck Carrier (PCTC) to calculate emissions. A bottom-up approach was adopted and air pollutant emissions from the operational scenarios compared according to the results of calculations. Optimal results were not obtained in all scenarios when the speed suggested by the VSR program was applied. This is because of a speed decrease in the maneuvering mode caused by a fixed operating time of 505.5 h, resulting in an increase in speed in the cruising mode. Based on these results, improvement measures are proposed to reduce air pollutant emissions from ships.
Keywords:
Air pollutant, Fine dust, Emission calculation, Emission factors, VSR program1. Introduction
Air pollution has become a critical challenge worldwide based on rapid urbanization and industrialization. According to a recent disease study, approximately 6.1 million early deaths occurred worldwide in 2016, of which 4.1 million were attributed to air pollutants [1]. Exposure to air pollutants in numerous epidemiological scenarios leads to adverse health effects such as cardiovascular and respiratory problems, which can cause early death [2].
Air pollutant emissions in Korea have been calculated using the Clean Air Policy Support System (CAPSS) and the emissions of seven air pollutants (CO, NOx, SOx, TSP, PM10, VOCs, and NH3) have been calculated since 1999. PM2.5 was added in 2011 and BC emissions have been included since 2014 [3]. The CAPSS is a comprehensive air quality management system based on a list of air pollutants and provides information services for implementing policies such as measures to improve the air environment in the Seoul metropolitan area, a total air pollution control system, and the efficiency evaluation of air conservation policies by local governments through the systematic collection and management of basic data [4]. The ratio of air pollutants resulting from marine vessels is increasing based on the continued usage of old ships and low-quality fuels. The emissions of sulfur oxide from a container ship are equal to those of 50 million passenger cars and the amount of generated ultrafine dust corresponds to that of 500,000 trucks, indicating that such vessels have a significant impact on environmental issues [5]-[7]. In response, the Ministry of Environment implemented the Special Act on Fine Dust Reduction and Management on February 15, 2019 for full-scale countermeasures and comprehensive management of fine dust problems. The Ministry of Oceans and Fisheries introduced the Vessel Speed Reduction (VSR) Program, which focuses on ports with many incoming ships in Busan, Ulsan, Yeosu, Gwang-yang, and Incheon, in December of 2019 [8][9]. The range of the defined low-speed operation areas is 20 nautical miles starting from certain lighthouses in the ports. Additionally, ships participating in the VSR program are granted exemption from entry and exit fees, which account for the highest proportion of port facility usage fees. A reduction rate of up to 30% is applied for container vessels with a high entry speed and up to 15% for other ships.
A previous study and policy for managing air pollution sources generated by ships focused on defining ship speeds at ports [10]-[13], but using this method can lead to an increase in the speed of the cruising mode, potentially increasing emissions. Therefore, in this study, optimal operating conditions that can minimize air pollutant emissions were simulated by modifying the operating conditions of various ships. Therefore, the effects of the VSR program were analyzed and optimal operating conditions were determined.
2. Methodology
2.1 Method for calculating emissions
To calculate the emissions of air pollutants generated by vessels, a methodology for calculating bottom-up emissions was adopted in this study. This methodology is suitable when detailed operational information on vessels is available and because the actual operation of individual vessels is considered, the emissions for those vessels can be calculated more accurately. container vessels and car carriers were selected as the target ships for calculating emissions in this study. This is because the number of such vessels entering and leaving the ports where the VSR program is implemented as well as their participation rate in the program are both high [8].
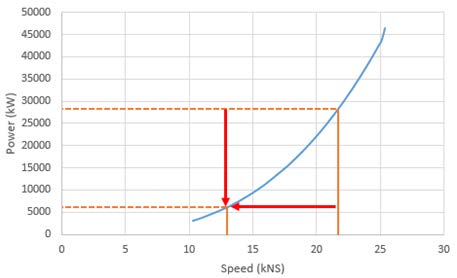
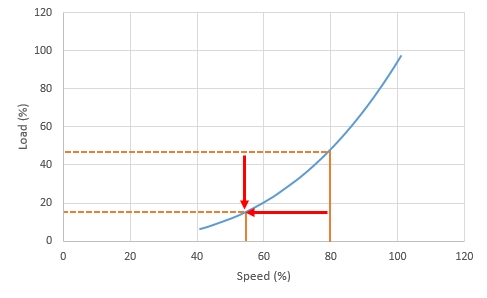
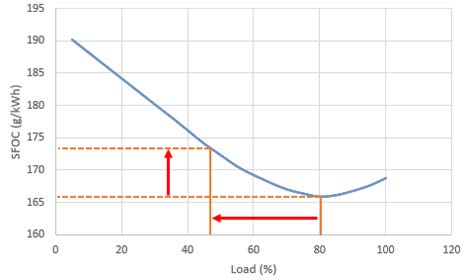
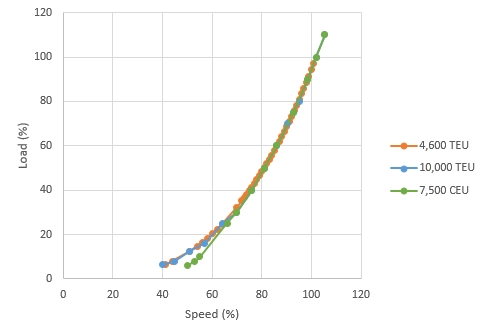
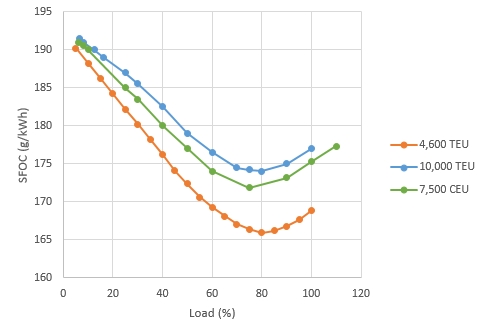
The first step is the analysis of the ship specifications. By using a vessel’s FAT report, the function of the correlation between the power, speed, load, and fuel consumption of the main engine can be determined. The correlation between the power (kW) and speed (knots) of the main engine is derived using Equation (1). According to the load diagram of the main engine, the relationship between the load (%) and speed (%) is presented in Equation (2). The change function of the SFOC (g/kWh) according to the load (%) change is defined in Equation (3). Equation (1), (2) and (3) are shown in Figures 1, 2 and 3, respectively.
Power (kW) vs. Speed (knot)
| (1) |
Load (%) vs. Speed (%)∶
| (2) |
Load (%) vs. SFOC (g/kWh) :
| (3) |
Figures 1 and 2 show the state that the y-axis also decreases with the decrease in the x-axis, but Figure 3 shows the characteristics of increasing the y-axis when the load is lower than 80%.
The following equations define the load, power, SFOC, and sailing time as steps in deriving the items required to calculate the emissions discharged under actual navigation conditions (Equations (4), (5), (6), and (7), respectively).
Calculate the load during actual sailing (%) and substitute x into Equation (2).
| (4) |
Calculate the power during actual sailing (kW).
| (5) |
Calculate the SFOC during actual sailing (g/kWh) substitute x into Equation (3).
| (6) |
Calculate the actual sailing hours (h).
| (7) |
The values of Equations (4), (5), (6), (7), and the EF are used to calculate the final emissions of air pollutants.
| (8) |
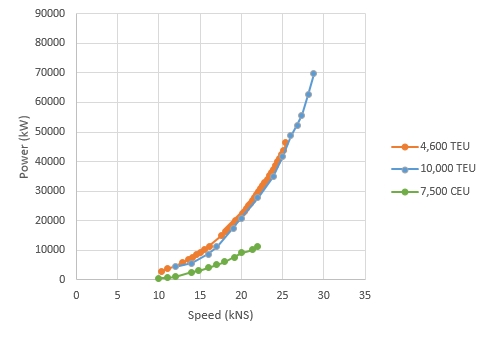
Figures 4-6 present the correlations between the load, power, SFOC, and speed, which represent the characteristics of each ship.
2.2 Selection of emission factors
In this study, we focused on fine dust to determine the effects of the implementation of the VSR program. Fine dust is released as a mixture of solid and liquid particles into the air and is chemically or naturally produced. For PM2.5, a considerable amount of precursors such as SOx and NOx react under certain conditions in the atmosphere, resulting in secondary production. However, the process of converting precursors from ships, excluding the EF of SOx and NOx, is unclear [14].
Among the EEA, EPA, and SMED, which provide EF values, only the EEA and SMED provide EF values for PM2.5 and TSP. The approach proposed by the EEA for estimating emissions is divided into phases. The EF provided by the EEA was selected because the information considered for calculating emissions using Tier 3 can achieve relatively accurate results compared to the data released by other institutions. We also wish to improve the accuracy of calculated results using the SFOC data. Table 1 lists the EF values used to calculate the final emissions of air pollutants [15]-[18].
3. Composition of Target Scenarios
3.1 Specifications of target vessels
In this study, three vessels were evaluated according to their operational records and commissioning reports, and the specifications of each vessel are provided in the table below.
3.2 Determining route and fixation values
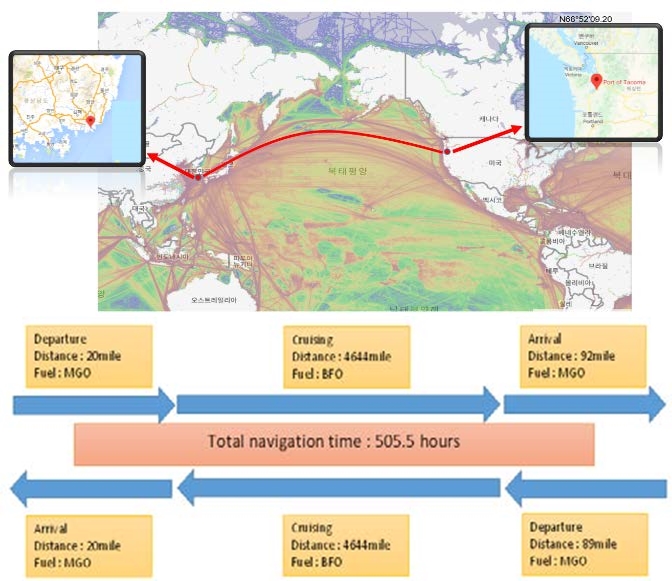
The target route was established by considering the operational data of 4,571 TEU container ships to calculate emissions. In particular, the routes of the Republic of Korea and United States, which implement the VSR program, were considered, and the distances and fuel consumption of each route are presented in Figure 7.
At Busan port, the section in which the maneuvering mode was applied was 20.0 NM and the section in which the cruising mode was applied was 4,644.0 NM. The sections in which these modes were applied at the port of Tacoma were 92.0 and 89.0 NM, respectively. Currently, the New York and New Jersey Clean Ship Incentive Program and San Diego’s VSR zone are designated as 20.0 NM, but an actual reduction in speed from approximately 90.0 NM is intended to protect dolphins. The EF was applied to the maneuvering mode at both ports based on MDO/MGO and BFO data collected in the cruising mode.
These data do not include the amount of air pollutant emissions generated during berthing. The total operating time was fixed at 505.5 h, which accounts for the scenario in which ship speed increases in cruise mode in preparation for the reduction of ship speed under the VSR program at the times of entry and departure.
3.3 Selection of ship operating scenarios
After calculating emissions based on actual operation data, changes in emissions were compared by changing the line speed for each operation section. The scenarios used to compare generated air pollutant emissions are listed in Table 2. The results were calculated by applying a consistent speed of 12.0 knots, which is the speed limit for container ships recommended by the VSR program, in Case 2. Case 3 was defined by applying a speed of 12.0 knots at the Busan and Tacoma ports, and Case 4 was defined by increasing the speed of the line at Busan to 15.0 knots. Cases 1 to 4 have a total sailing time of 505.5 h. Case 5 applies a speed of 12.0 knots at the Busan and Tacoma ports, but in the cruising mode, it applies a speed based on 80% of the engine load, which is the NCR point with the highest fuel consumption efficiency according to the characteristics of the main engine.
4. Results and Discussion
We calculated the emissions for each scenario for the three ships and compared them to derive meaningful results. We refer readers to the FAT and sea trial reports for the data required to calculate the emissions for each vessel.
4.1 Calculation results for a 4,600 TEU container vessel
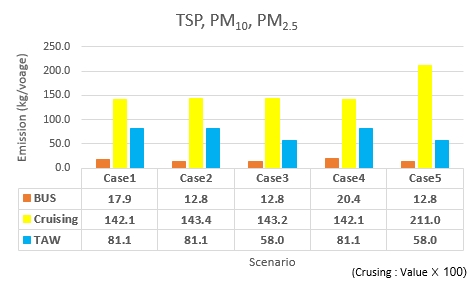
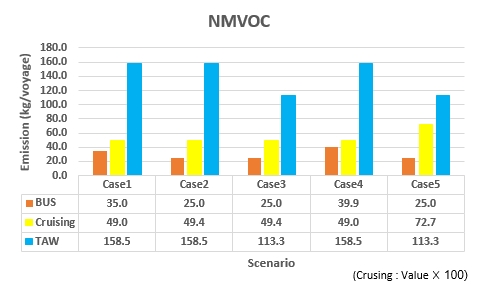
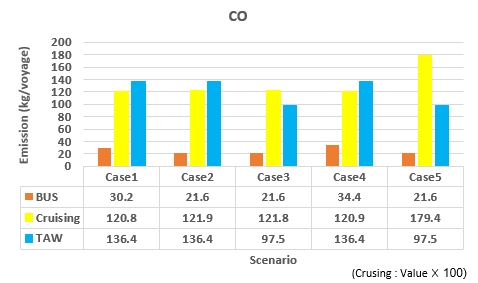
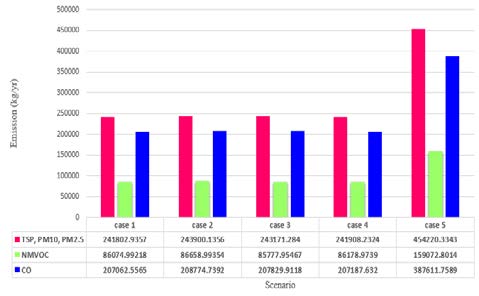
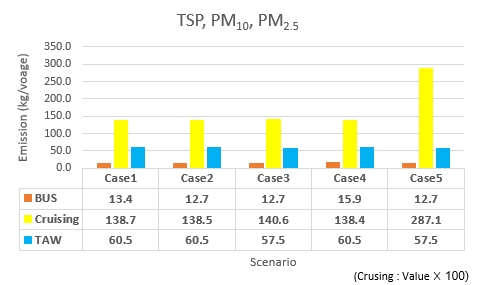
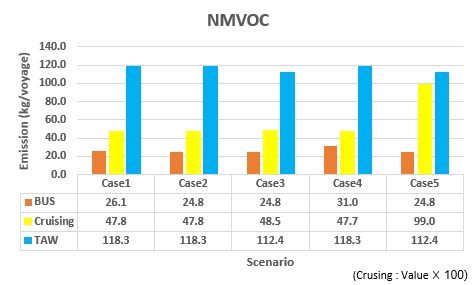
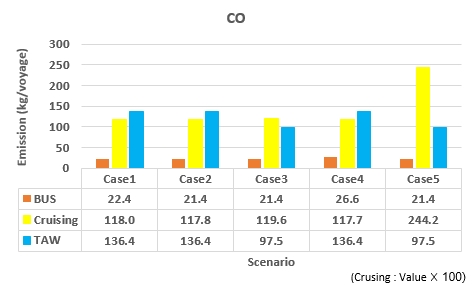
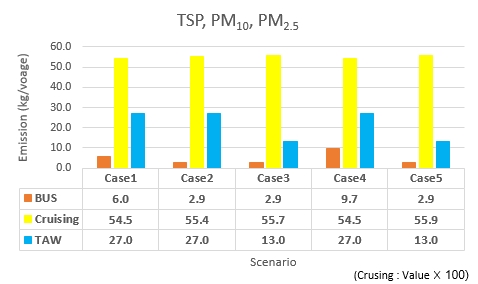
The results of the calculation of air pollutant emissions for each scenario are presented in Figures 8-11. For Case 5, with the SFOC optimality points in cruising mode, a speed of 23.9 knots, 80.0% engine load, and 408.1 sailing hours were applied.
- 1) Figure 7 presents the calculation results for TSP, PM10, and PM2.5 emissions. When calculating emissions for each section, it was determined that when a speed of 12.0 knots was applied from the BUS, emissions decreased by 28.5 and 37.3% compared to when speeds of 14.0 knots or 15.0 knots were applied, respectively. However, when annual emissions are calculated based on the entire section, one can see in Figure 10 that the smallest amount of emissions occurred for Case 1, where a speed of 14 knots was applied within the port. This is because the speed is reduced to 12.0 knots off the coast. Therefore, the speed increased in thecruising mode to meet the limited sailing schedule of 505.5 h. Additionally, the largest amount of air pollutants were emitted when the vessel was operated at 12.0 knots within Busan port and 14.0 knots within Tacoma port. The difference between the maximum and minimum emission levels is 1,368.0 kg per year. In Case 5, the SFOC maximum efficiency points produced 454,325.0 kg of emissions per year, representing an increase of 46.8% compared to Case 1.
- 2) Figure 9, which presents the results of the NMVOC calculation of emissions by section, reveals that applying a speed of 12.0 knots at the BUS reduced emissions by 28.5 and 37.3% compared to applying speeds of 14.0 knots or 15 knots, respectively. Regarding the annual emissions generated throughout the entire section, 85,788.0 kg were generated annually in Case 3 with a speed of 12.0 knots applied in the maneuvering mode. In Case 2, 86,659.0 kg of emissions were discharged annually, representing an increase of only 1% compared to that in Case 3, which generated the lowest amount of emissions.
- 3) Figure 10 presents the emission calculation results for each CO section. Applying a speed of 12.0 knots in the BUS yielded emission reductions of 8.6 and 12.8 kg compared to the Application of 14.0 or 15.0 knots. However, when performing calculations based on the entire section, the smallest emissions occurred in Case 1 with a speed of 14.0 knots applied in the maneuvering mode and the largest in Case 2 with a speed of 14.0 knots in the TIW and 12.0 knots at the BUS.
4.2 Calculation results for a 10,000 TEU container vessel
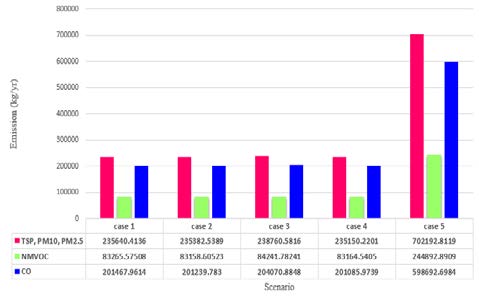
Figures 12-15 present the results of calculating the emissions for each air pollutant for the 10,000 TEU container vessel. For Case 5 with SFOC optimality points in cruising mode, a speed of 27.3 knots, 80.0% engine load, and 359.0 sailing hours were applied.
- 1) Figure 12 presents the results of calculating the emissions of TSP, PM10, and PM2.5. When calculating the emissions for each section, it was determined that when a speed of 12.0 knots was applied along the BUS, emissions decreased by 0.7% and 20.1% compared to the speeds of 14.0 and 15.0 knots, respectively. However, Figure 15 reveals that the smallest amount of emissions were generated in Case 4, where a speed of 15.0 knots was applied at the BUS and 14.0 knots at the TIW when calculating annual emissions based on the entire section. The highest emissions can be observed in Case 3 at 238,761.0 kg per year. In Case 5, the SFOC optimality points generated 702,193.0 kg of emissions per year, resulting in a 66.5% increase in minimum emissions compared to that in Case 4.
- 2) Figure 13 presents the emission calculation results for each section of NMVOC. When applying a speed of 12.0 knots at the BUS, emissions were reduced by 4.9 and 20.3% compared to those at speeds of 14.0 and 15.0 knots, respectively. When annual emissions are calculated based on the entire section, 83,159.0 kg, which is the smallest amount of emissions, were generated annually in Case 2, where a speed of 12.0 knots was applied in the maneuvering mode. In Case 3, 84,242.0 kg of emissions were produced, representing a 1.3% increase compare to Case 2.
- 3) In Figure 14, which presents the results of calculating emissions for each section of CO, one can be seen that applying a speed of 12.0 knots in the BUS reduced emissions by 4.5 and 19.5% compared to those at speeds of 14.0 and 15.0 knots, respectively. However, for annual emissions generated throughout the entire section, the smallest amount of emissions was discharged in Case 4 with a speed of 15.0 knots in the BUS and 14.0 knots in the TIW. Case 3 yielded the highest emissions. Case 5 yielded 598,693.0 kg of emissions per year, representing an increase of 197.7% compared to that in Case 4, where the lowest emissions were generated.
4.3 Calculation results for a 7,500 CEU PCTC
Figures 16-19 present the results of calculating emissions for each air pollutant for the 7500 CEUP PCTC. For Case 5, with the SFOC maximum efficiency points in the cruising mode, a speed of 19.2 knots, 75.0% engine load, and 503.7 sailing hours were applied.
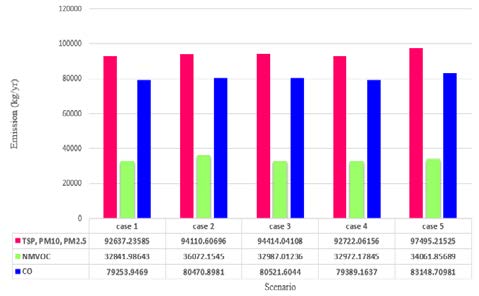
- 1) Figure 16 presents the results of calculating emissions for each section for TSP, PM10, and PM2.5. According to the seresults, when a speed of 12.0 knots was applied at the BUS, emissions decreased by 51.7 and 70.1% compared to those at speeds of 14.0 and 15.0 knots, respectively. However, asshown in Figure 19, which presents calculations results for the entire section, the smallest amount of emissions occurred in Case 1 with a speed of 14.0 knots applied in the maneuvering mode. The largest annual emissions in Case 3 were 94,414.0 kg per year. Case 5 with the SFOC optimality points results in emissions of 97,495.0 kg per year, representing an increase of 5.0% compared to that in Case 1.
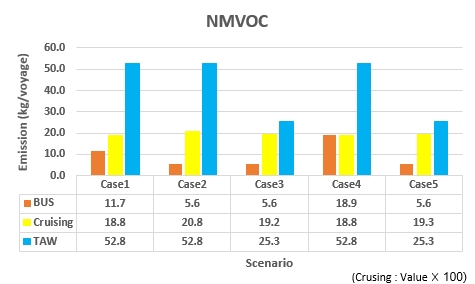
- 2) In Figure 17, which presents the calculation results for each section of NMVOC, one can see that applying a speed of 12.0 knots in the BUS reduced emissions by 52.1 and 70.4% compared to those at speeds of 14.0 and 15.0 knots, respectively. When calculating emissions based on the entire section, the minimum amount of 32842.0 kg was generated annually in Case 1 and maximum amount of 36,072.0 kg in Case 2. The calculation results for Case 5 reveal that 34,062 kg of emissions were generated annually, representing an increase of 3.6% compared to that in Case1. This represents a 5.6% decrease in air pollutant emissions compared to that in Case 2, which produces the most emissions.
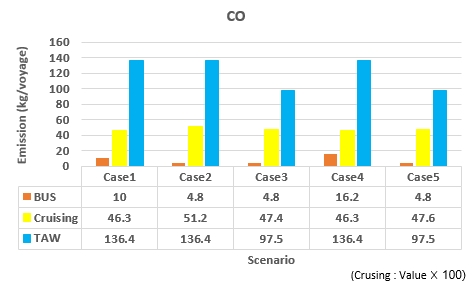
- 3) Figure 18 reveals that applying a speed of 12.0 knots at the BUS reduced emissions by 52.0 and 70.4% compared to those at speeds of 14.0 and 15.0 knots, respectively. However, the emission amount generated in the entire section was minimized in Case 1 and maximized in Case 3 when a speed of 12.0 knots was applied in the maneuvering mode. Case 5 with the SFOC optimality points generated 83,149.0 kg of emissions per year, representing a 4.7% increase compared to that in Case 1.
5. Conclusions
In this study, we compared calculated and compared air pollutant emissions for entire operation sections on the same routes and for the same operating time for three vessels to analyze the effects of the implementation of the VSR program. The target ships were 4,600 TEU container vessels, 10,000 TEU container vessels, and 7,500 CEU PCTCs, and the maneuvering and cruising modes were used to calculate air pollutant emissions in five scenarios. Among the air pollutants generated by the ships, this study focused on fine dust particles according to the purpose of the VSR program.
In the five target scenarios for pollutants of TSP, PM10, PM2.5, NMVOC, and CO, the lowest emissions were observed in Case 3 with the VSR program for NMVOC with a 4,600 TEU container vessel. In the remaining cases, the minimum emissions were calculated throughout the operation sections of the ships when a sailing speed higher than the VSR program speed of 12.0 knots was applied in the maneuvering mode. This is because a change in the speed of the maneuvering mode affects the speed of the cruising mode based on a fixed operating time of 505.5 h, which increases the emissions generated in the entire section. Consequently, the sailing speed of a container ship and the PCTC, which are defined as 12.0 knots in the maneuvering mode, do not yield optimal results when the amount of emissions generated throughout the entire operation was calculated. Additionally, the lowest emissions were observed under varying conditions because the engine load and SFOC were different, and the results clearly differed from theoretically validated values. Therefore, it is necessary to derive optimal conditions considering ship characteristics and operating characteristics.
Throughout this study, it was necessary to calculate the optimal model for emission reduction based on the characteristics of the main engine. Such models must be developed by considering the total emissions generated throughout a sailing operation and not on a local basis. Additionally, improvements to the calculation method for calculating air pollutants generated by individual ships are required to develop an optimal model. Future studies need to consider how emission coefficients can be applied to decrease emissions from each vessel depending on the characteristics of the fuel used.
Acknowledgments
This research was supported by the Ministry of Education of Republic of Korea and the National Research Foundation of Korea (2021R1G1A1008612110)
Author Contributions
Conceptualization, M. G. Cho and J.W. Lee; Methodology, M. G. Cho; Software, M. G. Cho; Validation, M. G. Cho and J. W. Lee; Formal Analysis, M. G. Cho; Investigation, M. G. Cho; Resources, M. G. Cho; Data Curation, M. G. Cho; Writing—Original Draft Preparation, M. G. Cho; Writing—Review & Editing, J.W. Lee; Visualization, M. G. Cho; Supervision, J.W. Lee; Project Administration, J.W. Lee; Funding Acquisition, J.W. Lee.
References
- E. Gakidou, et al. “Global, regional, and national comparative risk assessment of 84 behavioural, environmental and occupational, and metabolic risks or clusters of risks, 1990–2016: a systematic analysis for the Global Burden of Disease Study 2016,” The Lancet, vol. 390, no. 10100, pp. 1345-1422, 2017.
-
G. Oberdorster, E. Oberdorster, and J. Oberdorster, “Nanotoxicology: An emerging discipline evolving from studies of ultrafine,” Environmental Health Perspectives, vol. 113, no. 7, pp. 823-837, 2005.
[https://doi.org/10.1289/ehp.7339]

- National Institute of Environmental Research, 2014 National Air Pollutant Emission, pp. 5-18, 2016 (in Korean).
- National Institute of Environmental Research, 2016 National Air Pollutant Emission, pp. 5-19, 2019 (in Korean).
-
T. T. Zhao, “A study on estimating ship emission – Focusing on Gwangyang port and Ulsan port,” Journal of Korea Port Economic Association, vol. 35, no. 2, pp. 94-102, 2019 (in Korean).
[https://doi.org/10.38121/kpea.2019.06.35.2.93]

- J. S. Lim, “A study on plans to construct green port around port environmental regulations”, Journal of Korea Port Economic Association, vol. 26, no. 2, pp. 100-111, 2010 (in Korean).
- J. Cofala, et al., “The potential for cost effective air emission reductions from international shipping through designation of further emission control areas in EU waters with focus on the mediterranean sea,” International Institute for Applied Systems Analysis, pp. 3-33, 2018.
- Korea Maritime & Ocean University (KMOU) Industry University Cooperation Foundation, “A Study on the Introduction and Operation of the Low Speed Operating Program of Ships”, Ministry of Oceans and Fisheries, 2019 (in Korean).
- S. C. Jo, A Study on Air Pollutant Emission Characteristics of Ships by Vessel Speed Reduction, Master Thesis, Department of Mechanical Engineering, Korea Maritime & Ocean University, Korea, pp. 1-63, 2020 (in Korean).
- Y. G. Son, A Study on Improvement Measurement on the Management of Air Pollution Matter from Ships, Master Thesis, Korea Maritime & Ocean University Graduate School of Maritime Finance, Korea, pp. 1-49, 2018 (in Korean).
- National Institute of Environmental Research, Calculation Method of Domestic and Offshore Ship Pollutant Emissions, pp. 1-15, 2015 (in Korean).
- National Institute of Environmental Research, Data Collection on the Calculation of Pollutant Emissions in Domestic ports, pp. 1-24, 2016 (in Korean).
- W. Park and E. J. Kim, “A study on the regulatory policy of ship emission control zone in China, International Trade Law, no. 145, pp. 55-83, 2019.
- K. H. Cho. Author, Exhaust reduction technology and measurement of diesel engines for ships, Dasom Publisher, 2012.
- C. Trozzi, R. D. Lauretis, EMEP/EEA Air Pollutant Emission Inventory Guidebook 2016, European Environment Agency (EEA), 2016.
- Eastern Research Group, Recommended Procedures for development of Emissions Factor and Use of Web-Fire Database, United States Environmental Protection Agency (EPA), 2013.
- Assessment and Standards Division Office of Transportation and Air Quality U.S. Environmental Protection Agency, Emission Inventories for Ocean-Going Vessels Using Category 3 Propulsion Engines In or Near the United States, United States Environmental Protection Agency (EPA), 2007.
- D. Cooper, T. Gustafsson, Methodology for Calculating Emissions from Ships: 1. Update of Emission Factor, Swedish Environmental Protection Agency, no. 4, 2004.

