[ISMT2021] Object detection in high-resolution sonar images
Copyright ⓒ The Korean Society of Marine Engineering
This is an Open Access article distributed under the terms of the Creative Commons Attribution Non-Commercial License (http://creativecommons.org/licenses/by-nc/3.0), which permits unrestricted non-commercial use, distribution, and reproduction in any medium, provided the original work is properly cited.
Abstract
In this study, object recognition and detection in sound navigation and ranging (sonar) images are investigated using the You Only Look Once approach. Small objects in large images and sparse data pose difficulties to object detection in sonar images. To solve the former problem, an image-segmentation method is proposed herein. Segmentation partitions a large image into smaller sections and then recombines them after object detection is performed. Because object detections in smaller images are performed in parallel, the processing time does not increase significantly. Meanwhile, to solve the latter problem, a large-scale labeled dataset (60,000 images comprising nine classes: tire, diver, shelter, ladder, frame, drum, bedrock, pier, and sandbar) is built by applying various data augmentation methods (reflection, rotation, distortion, etc.). The proposed method shows favorable object recognition and detection performances, with a mean average precision score of 0.745 for 6,000 test data points. In the future, we plan to improve the performance by optimizing the hyperparameters and applying noise-reduction techniques at the preprocessing stage.
Keywords:
Sonar image, Deep learning, Underwater object detection1. Introduction
Object detection, which is a technology widely used in computer vision, identifies objects within a class in digital images [1]. In general, object detection relies significantly on optical images. However, object detection underwater often involves the use of sound navigation and ranging (sonar) images. Sonar images differ significantly from typical optical images in terms of the method by which they are created. Sonar images are expressed in highlight and shadow regions, where sound waves are directly reflected from objects and do not reach, respectively. Furthermore, their image quality is low because the resolution of sound waves is low owing to the various noises that exist underwater [2]. Consequently, object recognition is more difficult in sonar images compared with in optical images. However, sonar images are still used because optical waves exhibit severe attenuation during energy transfer, whereas sound waves are an excellent medium underwater [3].
Various algorithms have been proposed for object detection [4]-[9]. However, unlike in normal images, object detection in sonar images is associated with numerous problems. Primarily, sonar images have a low resolution owing to the various noises that exist underwater. Moreover, most sonar images are expressed in two dimensions by projecting three-dimensional images horizontally. This two-dimensional expression is problematic because objects of different heights have the same topology. These problems complicate the analysis of sonar images. Sonar images are generally acquired using autonomous underwater vehicles. Hence, data sparseness occurs, and real-time object detection is necessitated. Herein, a deep learning method is proposed to overcome this problem. However, owing to the size adjustments of images that occur during training in deep learning, small objects in large sonar images disappear. Moreover, sparse data render deep learning difficult. Hence, it is recommended to build training data by improving the detection performance of small objects via image segmentation and data augmentation.
The remainder of this paper is organized as follows: In Section 2, research pertaining to object detection in sonar images and the You Only Look Once (YOLO) approach is explained. In Section 3, the suggested methods and data augmentation methods are explained. In Section 4, the experimental results are explained and analyzed. Finally, in Section 5, conclusions are provided and future research plans are discussed.
2. Related Studies
2.1 Object detection in sonar images
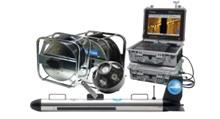
Sonar images show the seabed and underwater objects using sound waves. They appear in various forms depending on the method by which they are created; moreover, side-scan and forward-looking sonar are typically used. Because side-scan sonar is primarily used to acquire information from seabed landforms or underwater objects, a wide range of information can be acquired; consequently, the sonar image sizes are large. Figure 1 shows an equipment used for side-scan sonar.
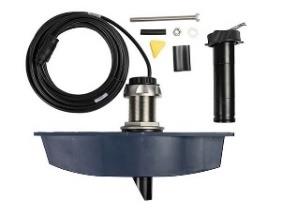
Forward-looking sonar is used to avoid forward obstacles in water. Therefore, it acquires information from specific regions, and the objects are included in most of the sonar images. Figure 2 shows an equipment used for forward-looking sonar.
Depending on the equipment used, as shown in Figures 1 and 2, the sonar images created may differ. The image property changes for different images, and the object detection method must be changed to accommodate the changing property.
The aim of object detection using sonar images is to determine locations and recognize objects. Such an object detection approach is used in fields such as seabed detection, fish identification, and tracking [6]-[7]. Conventionally, this type of object detection using sonar images is performed manually by professionals owing to difficulties in analyzing sonar images. Recently, to overcome this problem, three-dimensional sonar images were used, and object detection was performed using deep learning [8]-[10]. In this study, the difficulty in object detection was alleviated using deep learning. Labeled data are required when applying deep learning methods. However, sonar images have a low resolution and are unfamiliar; hence, training data are difficult to build. Therefore, the effort required to build training data must be reduced. Various existing data generation methods have been investigated via these efforts [11]-[12]. However, the previously investigated data generation methods are complicated and unsuitable for object detection, e.g., the faster-RCNN [13] and YOLO [4]. Therefore, a simple data augmentation method for data generation is proposed herein.
Object detection in sonar images is performed on board ships or divers underwater. Hence, the closer the object detection is to real time, the higher is the efficiency. Therefore, to perform object detection in real time, investigations using various sonar images have been performed [14]-[16]. In this study, to perform object detection as closely as possible to real time, YOLO, which shows high performance in real time, was used.
2.2 YOLO
Among the various object detection techniques, YOLO was used in this study. YOLO demonstrates good performance in terms of execution time as it is a one-stage detector that performs two steps simultaneously; furthermore, it is not a two-stage detector that requires the separate prediction and classification of object candidate regions [5].
Figure 3 shows the object detection method using YOLO [5]. YOLO is based on a convolutional neural network; it is a method in which an object is detected via non-max suppression through the network after the size of the input image is changed.
Figure 4 shows an example of object detection using a basic YOLO network.
The input image is partitioned into S × S grid cells. If the center of a specific object corresponds to the center of the grid cell, then the corresponding grid cell performs object detection [5]. Each grid cell comprises multiple bounding boxes and probabilities of each class, and each bounding box contains the information of each class and a confidence score (CS). The information in a bounding box includes four pieces of information: x-coordinate, y-coordinate, width w, and height h. The CS represents the confidence level of an object in the corresponding bounding box, and is calculated using Equation (1).
| (1) |
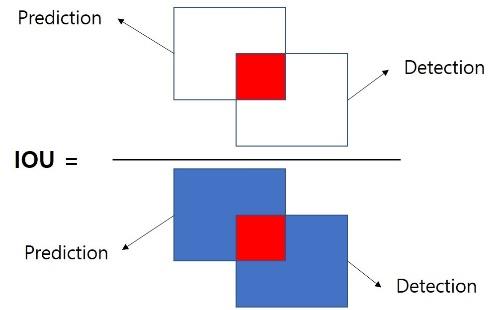
Intersection over union (IOU) refers to the cross-overlapping union. The CS in each cell has an IOU value between the value of the predicted box and the correct answer if an object exists, and 0 if it does not exist. Figure 5 shows a diagram for calculating the IOU [17].
To calculate the class CS for a bounding box, the conditional probability is multiplied by the CS, as shown in Equation (2).
| (2) |
Subsequently, the size of the tensor is expressed as S × S × (B × 5 + C), where S is the number of grid cells, B the number of bounding boxes, and C the number of classes.
3. Object Detection System
3.1 Object detection system
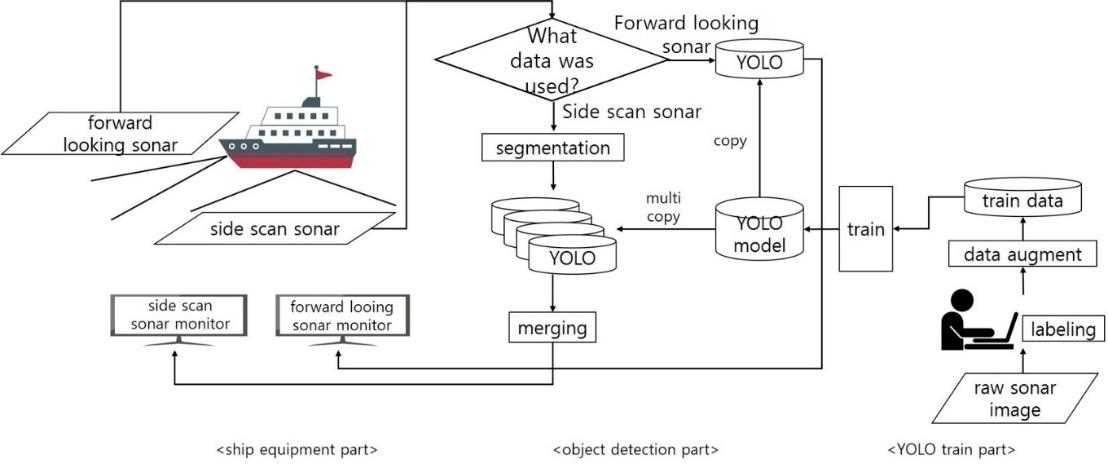
The sonar-imaging equipment used in this study was a side-scan sonar and forward-looking sonar. Therefore, object detection was performed differently in this study. In addition, the object detection algorithm uses YOLO for real-time searches and achieving high performance, as described in Section 2. Figure 6 illustrates the overall process of the object-detection system.
Object detection is performed in the deep seabed using side-scan sonar. By contrast, object detection near the surface of water or detecting objects floating in water is performed using forward-looking sonar. Detailed descriptions are provided next.
3.2 Segmentation
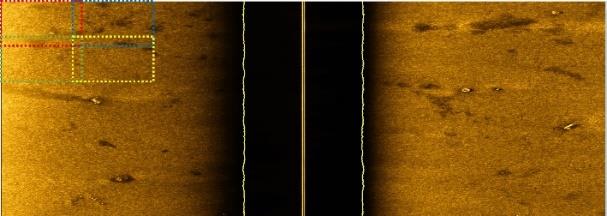
YOLO resizes an input image based on its nature. This causes small objects to disappear. To overcome this problem, image segmentation was proposed. Segmentation is a method for performing object detection by partitioning a large raw image into several smaller input images. Therefore, it is applied to side-scan sonar data and not forward-looking sonar data. Figure 7 shows an example of image segmentation using side-scan sonar.
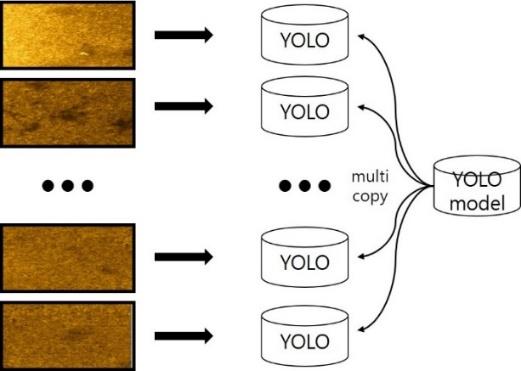
When segmentation is applied, the segments overlap because an object may lie on the boundary dividing the segments. Additionally, YOLO is performed in parallel on the segmented images to reduce the execution time. Subsequently, the final object detection result is obtained via a merging process (refer to Section 3.4).
3.3 Multi-YOLO
Because forward-looking sonar does not apply image segmentation, object detection is performed using a single YOLO model. By contrast, side-scan sonar performs object detection by configuring multiple YOLO models. The learned YOLO model is the same for both forward-looking and side-scan sonar. Figure 8 shows an example of multi-YOLO object detection.
3.4 Merging
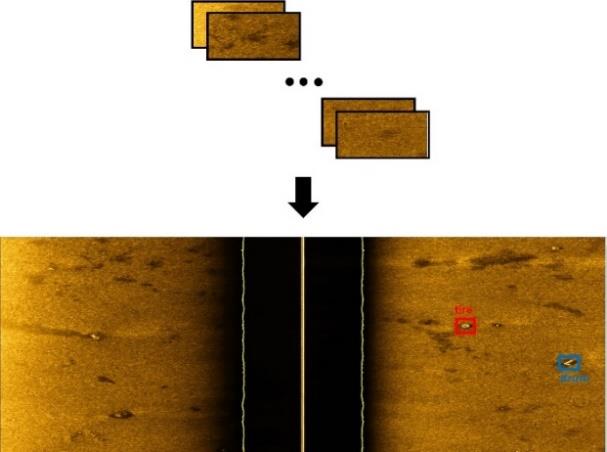
In image segmentation, because multiple inputs are used, multiple outputs are yielded. Therefore, the results should be merged back into one image similar to the input image. If the object detection results overlap during merging, the largest resulting value is selected as the final value, as in the nonmax suppression method.
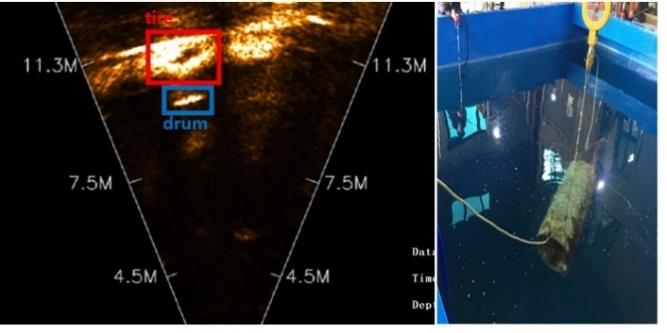
Figure 9 shows an example of the merging process. In terms of the object detection result, the red and blue boxes represent the tire and drum, respectively.
3.5 Labeling
Basic raw data were required to perform data augmentation. Labeling [18] was used to produce raw data. A rectangle was used to assign the position of an object to the raw datum, and the class of the object was selected subsequently. By performing labeling, 2,000 basic side-scan sonar images and 4.000 basic forward-looking sonar images were produced. Based on the prepared raw data, data augmentation was performed (Section 3.6).
3.6 Data augmentation
To use YOLO, high-quality data are required for training. Data augmentation is a method of increasing the amount of data in situations where such data are insufficient [19]. The primary methods of image data augmentation include adding Gaussian noise, color inversion, blur, contrast, inversion, segmentation, and cropping [20]. In this study, data augmentation was performed using Imageaug [21]. Furthermore, methods that are not suitable for sonar images, such as color inversion and blur, were excluded from the study.
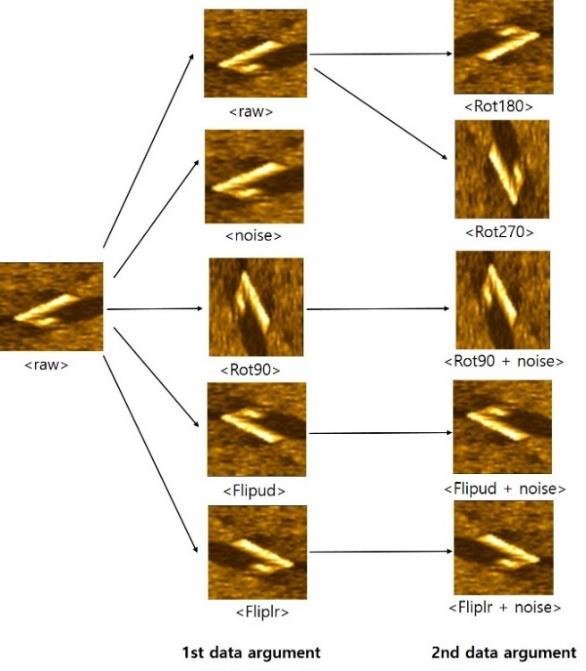
Figure 10 shows the data augmentation method. Data augmentation was performed twice to build the first augmented dataset, followed by the second augmented dataset. For the first augmented dataset, horizontal and vertical inversion, 90° rotation, and distortion were applied to the raw data. For the second augmented dataset, the raw data were rotated by 180° and 270°. Ad-ditionally, distortion was added to the data of horizontal and vertical inversions and 90° rotations among the first augmented data.
4. Experiments and Analysis
4.1 Experimental data
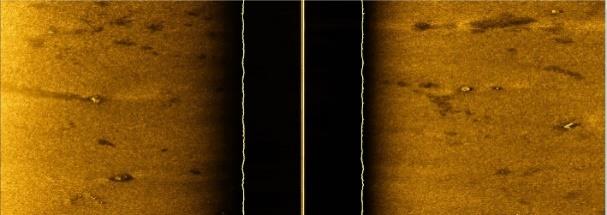
Sidescan sonar images were captured in an actual ocean. Figure 11 shows an example of a side-scan sonar image.
In this study, the side-scan sonar image included six classes of objects (rock, pier, shelter, sandbar, tire, and drum). The side-scan sonar images were large, i.e., they measured 2250 × 898. Moreover, they varied significantly in terms of size from large objects such as piers to small objects such as tires.
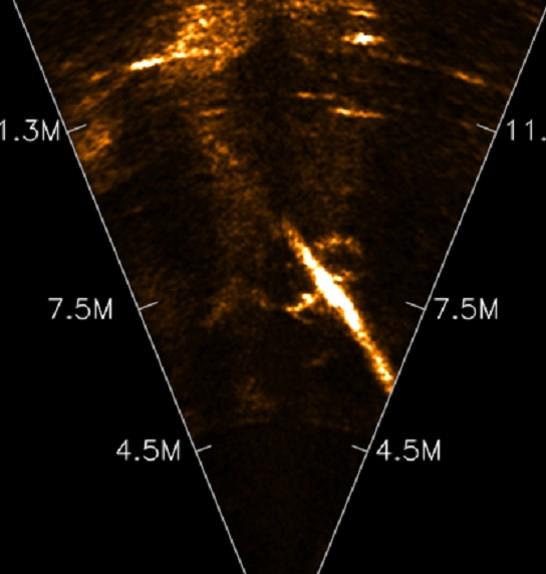
Unlike side-scan sonar, forward-looking sonar uses sonar images captured in an artificial water tank rather than an actual ocean. Figure 12 shows an example of forward-looking sonar. The forward-looking sonar included six classes of objects (tires, divers, shelters, ladders, and drums). The forward-looking sonar images measured 334 × 225 pixels and were smaller than the side-scan sonar images, as they were captured in an artificial water tank. The size difference between the objects was insignificant.
In this study, 2,000 raw side-scan sonar image data points were augmented to 20,000 data points. Meanwhile, 4,000 raw forward-looking sonar image data points were augmented to 40,000 data points. Here, 10% of the images were used as the test data. Table 1 lists the statistics for the training and testing data.
4.2 Experimental method
Based on the trained YOLO model, the performance was evaluated using data that were not used for training. The mean average precision (mAP) was used to evaluate the performance. The mAP is a performance evaluation method used in many object detection tasks, and its precision and recall are measured based on the classification shown in Table 2.
The equations for precision and recall are shown in Equation (3).
| (3) |
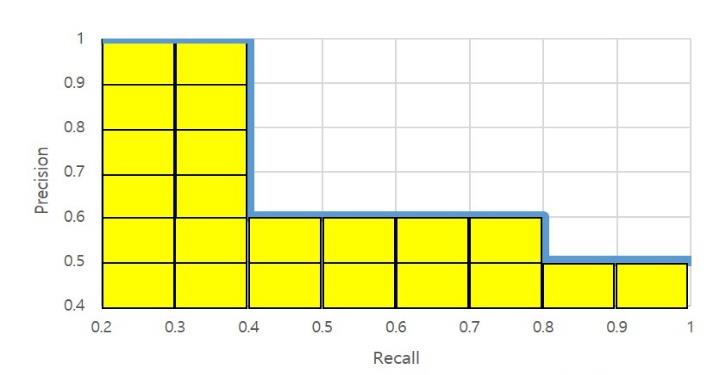
In object detection, true positives (TPs) and false negatives (FPs) are determined based on the IOU values described in Section 2. Figure 13 shows an example of a precision–recall graph based on the precision and recall formulas shown in Equation (3). Average precision (AP) corresponds to the yellow area, and the mAP is the average AP in each class.
4.3 Determining segment size
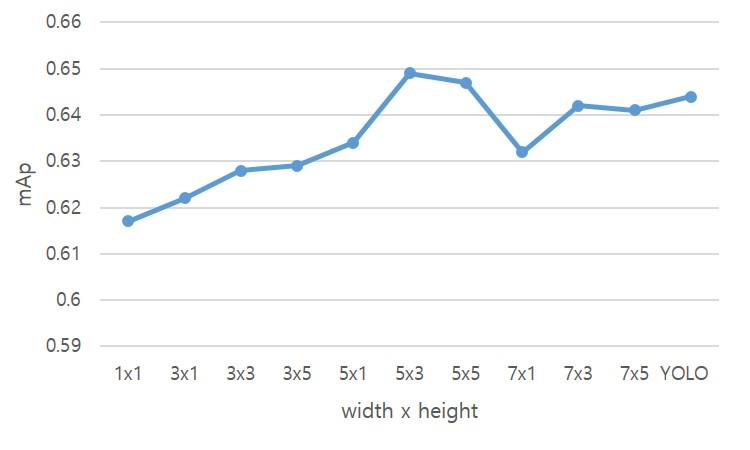
In image segmentation, the number of segments affects the performance. Therefore, this number was determined experimentally. Figure 14 shows the results of segmentation performances based on the number of equal horizontal and vertical segments (x-axis). For instance, 5 × 3 on the x-axis has a corresponding value on the y-axis, which shows the result of partitioning the width into five equal segments and the height into three equal sections. The last row shows the result of segmentation based on the input size of YOLO.
Figure 14 shows that a better performance was achieved when segmentation was performed on both the horizontal and vertical directions compared with when segmentation was performed on only one of the directions. Moreover, a high value was obtained when segmentation was performed based on the input size of YOLO. An analysis of these results show that the standard for segmentation can be adjusted based on the basic YOLO input size. Based on the experimental results, segmentation was performed by partitioning the width and height into five and three segments, respectively.
4.4 Side-scan sonar results
An experiment was conducted on 2,000 basic images, but the results were unsatisfactory, as shown in Table 3. This low performance was speculated to be caused by insufficient data. Therefore, to expand the data, the first data augmentation was performed by applying the data augmentation method described in Section 3. The first data augmentation step significantly improved the performance. Subsequently, a second data augmentation step was performed. Comparing the results of the first and second data augmentations, the performance of small objects such as tires and drums was lower than that of relatively larger objects such as bedrock, piers, and shelters. It is speculated that this occurred because the objects of interest were smaller than the sonar images for input. Hence, an experiment was performed using image segmentation. Consequently, the detection performance for small objects increased significantly.
4.5 Forward-looking sonar results
Table 4 presents the results from 2,000 images, including three objects (tires, divers, and shelters).
The number of object classes in the front-looking sonar was less than that in the side-scan sonar, and hence different from the actual environment. Therefore, after an experiment was performed on the basic data, an additional experiment was conducted using 2,000 additional images with three objects (ladder, frame, and drum). To improve the low performance of the basic experiment, the first and second data augmentations were performed in the same manner as the side-scan sonar. Unlike side-scan sonar, because the input images were not large and the objects to be detected were not small compared with the input images, segmentation was not applied in the forward-looking sonar.
4.6 Analysis results
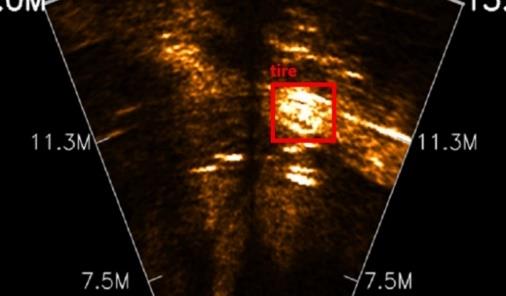
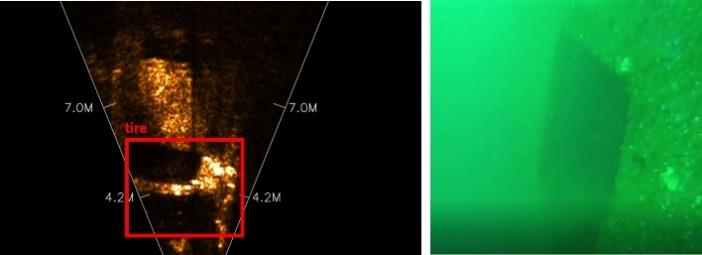
Figure 15 shows the results of a correctly identified tire. Meanwhile, Figure 16 shows the result of incorrectly classifying a frame as a tire.
Figure 17 shows error type 2, where the correct object is a drum. However, in real object detection, both the drum and shadows that appear behind it are recognized as tires. As shown in Table 4, an error occurs when the location of an object is identified but incorrectly classified, or when noise is recognized as an object. It is speculated that this problem occurs because outlines and shadows naturally occupy most of the sonar images, unlike in optical images. Even when the objects are different, if the outlines and shades are similar at certain angles, the object cannot be recognized or classified correctly. Solving this problem will likely improve the performance.
4.7 Discussion
Table 5 presents a comparison between this study and other studies pertaining to sonar object recognition.
As shown in Table 5, the performance differs depending on the experimental environment. Nos. 1 and 3 show data released by the Naval Surface Warfare Center (NSWC). The data provided by the NSWC comprises four classes, and the objects are large. In addition, in No. 1, data are augmented via active learning. No. 2 shows data that have been self-constructed in various shapes. No. 4 shows the result of this study. A comparison of the results shows that a simpler object image yielded a higher performance. Moreover, although the same method was not employed in Nos. 1 and 3, it was assumed that they benefitted from data augmentation, based on the experimental results of this study and that the same data were used. Finally, it was inferred that the performance deteriorated as the number of classes increased.
5. Conclusion and Future Studies
An object detection method using YOLO for sonar images was proposed herein. A small amount of training data was learned by applying data augmentation methods described earlier. Furthermore, an object detection method was proposed using a single model that varied depending on the sonar-image equipment. Specifically, by performing image segmentation on sonar images with large input sizes and object detection with several smaller images, a model was proposed. The respective settings yielded mAP values of 0.649 and 0.745. However, the performance was generally lower compared with that of optical images. Hence, in future studies, more methods will be investigated to increase the AP score by applying hyperparameters as well as removing noise and background.
Acknowledgments
This paper is an expanded version of the proceeding paper entitled “Object Detection in High Resolution Sonar Images” presented at the KOSME ISMT 2021.
The authors would like to appreciate SonarTech’s researchers for their hard work, who have gathered sonar data and have discussed sonar processing. This work was supported by the Ministry of Education of the Republic of Korea and The National Research Foundation of Korea (NRF-2019M3E8A1103533).
Author Contributions
Conceptualization, M. S. Choi and J. H. Kim; Methodology, M. S. Choi; Validation, M. S. Choi and J. H. Kim; Formal Anal-ysis, M. S. Choi; Investigation, Y. S. Oh and S. S. Park; Resources, M. S. Choi; Writing—Original Draft Preparation, M. S. Choi; Writing—Review & Editing, J. H. Kim; Project Administration, J. H. Kim; Funding Acquisition, J. H. Kim.
References
-
J. H. Park, S. Y. Cho, J. S. Lee, S. R. Lee, S. H. Kim, G. H. Lim, J. W. Seo, and J. H. Kim, “An experimental study on performance evaluation for development of compact steam unit applied with hybrid plate heat exchanger,” Journal of the Korean Society of Marine Engineering, vol. 41, no. 4, pp. 296-301, 2017 (in Korean).
[https://doi.org/10.5916/jkosme.2017.41.4.296]

- Z. Zou, Z. Shi, Y. Guo, and J. Ye, “Object detection in 20 years: a survey,” IEEE Computer Vision and Pattern Recognition, vol. 2, 2019.
-
S. Reed, Y. Petillot and J. Bell, “Automated approach to classification of mine-like objects in side scan sonar using highlight and shadow information,” IEE Proceedings-Radar, Sonar and Navigation, vol. 151, no. 1, pp. 48-56, 2004.
[https://doi.org/10.1049/ip-rsn:20040117]

-
S. Kim, “The reason why to use acoustic waves on the sea-bottom survey,” Journal of the Korean Society of Marine Engineering, vol. 32, no. 4, pp. 481-489, 2008 (in Korean).
[https://doi.org/10.5916/jkosme.2008.32.4.481]

-
L. Jiang “Active object detection in sonar images,” IEEE Access, vol. 8, pp. 102540-102553, 2020.
[https://doi.org/10.1109/ACCESS.2020.2999341]

-
J. Redmon, “You only look once: unified, real-time object detection,” Computer Vision and Pattern Recognition, pp. 779-788, 2016.
[https://doi.org/10.1109/CVPR.2016.91]

-
G. J. Dobeck, J. C. Hyl and, and L. Smedley, “Automated detection and classification of sea mines in sonar imagery,” Proceeding of SPIE, vol. 3079, pp. 90-110, 1997.
[https://doi.org/10.1117/12.280846]

-
M. E. Clarke, N. Tolimieri, and H. Singh, “Using the seabed AUV to assess populations of groundfish in untrawlable areas,” The Future of Fisheries Science in North America, pp. 357-372, 2009.
[https://doi.org/10.1007/978-1-4020-9210-7_20]

-
M. Valdenegro-Toro, “Object recognition in forward-looking sonar images with convolutional neural networks,” Proceedings of OCEANS 2016 MTS/IEEE Monterey, pp. 1-6, 2016.
[https://doi.org/10.1109/OCEANS.2016.7761140]

-
J. Kim, H. Cho, J. Pyo, B. Kim, and S. -C. Yu, “The convolution neural network based agent vehicle detection using forward-looking sonar image,” Proceedings of OCCEANS 2016 MTS/IEEE Monterey, pp. 1-5, 2016.
[https://doi.org/10.1109/OCEANS.2016.7761209]

-
H. Baek, “2d and 3d mapping of underwater substructure using scanning SONAR system,” Journal of Korea society for Naval Science and Technology, vol. 2, no. 1, pp. 21-27, 2019 (in Korean).
[https://doi.org/10.31818/JKNST.2019.03.2.1.21]

-
B. Settles, “Active learning,” Synthesis Lectures on Artificial Intelligence Machine Learning, vol. 6, pp. 1-114, 2012.
[https://doi.org/10.2200/S00429ED1V01Y201207AIM018]

-
S. Vijayanarasimhan and K. Grauman, “Large-scale live active learning: Training object detectors with crawled data and crows,” International journal of computer vision, vol. 108, no. 1-2, pp. 97-114, 2014.
[https://doi.org/10.1007/s11263-014-0721-9]

- S. Ren, K. He, R. Girshick, and J. Sun, “Faster R-CNN: towards realtime object detection with region proposal networks,” Advances in neural information processing system, vol. 28, pp. 91-99, 2015.
- L. Henriksen, “Real-time underwater object detection based on an electrically scanned high-resolution sonar,” Proceedings of IEEE Symposium on Autonomous Underwater Vehicle Technology, pp. 99-104, 1994.
-
J. W. Kaeli, “Real-time anomaly detection in side-scan sonar imagery for adaptive AUV missions,” Proceedings of IEEE/OES Autonomous Underwater vehicles, pp. 85-89, 2016.
[https://doi.org/10.1109/AUV.2016.7778653]

-
E. Galceran, et al., “A real-time underwater object detection algorithm for multi-beam forward looking sonar,” Proceedings of International Federation of Automatic Control, vol. 45, no. 5, pp. 306-311, 2012.
[https://doi.org/10.3182/20120410-3-PT-4028.00051]

-
D. Zhou, “IoU loss for 2d/3d object detection,” Proceedings of 2019 International Conference on 3D Vision, pp. 85-94, 2019.
[https://doi.org/10.1109/3DV.2019.00019]

- Github, https://github.com/tzutalin/labelImg, , Accessed November 2nd, 2021.
-
S. Cheng, “Abnormal water quality monitoring based on visual sensing of three-dimensional motion behavior of fish,” Symmetry, vol. 11, no. 9, 2019.
[https://doi.org/10.3390/sym11091179]

-
C. Shorten and T. M. Khoshgoftaar, “A survey on image data augmentation for deep learning,” Journal of Big Data, vol. 6, no. 1, 2019.
[https://doi.org/10.1186/s40537-019-0197-0]

- Github, https://github.com/aleju/imgaug, , Accessed November 2nd, 2021.
-
H. Kang, “Identification of underwater objects using sonar image,” Journal of The Institute of Electronics and Information Engineers, vol. 53, no. 3, pp. 91-98, 2016 (in Korean).
[https://doi.org/10.5573/ieie.2016.53.3.091]

- J. Kim, et al., “The application of convolutional neural networks for automatic detection of underwater object in side scan sonar images,” The Journal of the Acoustical Society of Korea, vol. 37, no. 2, pp. 118-128, 2018 (in Korean).

