Effective utilizations of liquid-phase plasma for remediation of non-degradable organic pollutants in water
Copyright ⓒ The Korean Society of Marine Engineering
This is an Open Access article distributed under the terms of the Creative Commons Attribution Non-Commercial License (http://creativecommons.org/licenses/by-nc/3.0), which permits unrestricted non-commercial use, distribution, and reproduction in any medium, provided the original work is properly cited.
Abstract
Polycyclic aromatic hydrocarbons, which are non-degradable and can cause adverse health effects in humans, exist in various aquatic environments. Conventional contaminated water treatment processes present some disadvantages in eliminating polycyclic aromatic hydrocarbons, such as significant time consumption, low removal efficiency, secondary pollutants, and high maintenance cost. In this study, liquid-phase plasma is employed to decompose fluorene in water. The optimal conditions are investigated by controlling the operating parameters; 85.37% of fluorene is degraded within 10 min, whereas the constant frequency and pulse width remain at 30 kHz and 3 μs, respectively. Additionally, the effects of catalysts for photocatalysis and the Fenton reaction are evaluated to enhance the removal efficiency by effectively using the products resulting from the plasma. The generated active species are identified, and a possible degradation pathway is proposed. The outstanding performance of liquid-phase plasma and its association with photocatalysis and the Fenton reaction are presented herein.
Keywords:
Polycyclic aromatic hydrocarbons, Liquid phase plasma, Contaminated water treatment, Active species, Hydroxyl radical, Photocatalyst, Fenton reaction1. Introduction
Polycyclic aromatic hydrocarbons (PAHs) exist in various aquatic systems, such as influents and effluents from wastewater treatment plants, groundwater, surface water, and seawater [1].
PAHs comprise a large group of non-degradable organic compounds with two or more benzene rings as a result of natural (e.g., forest fires, volcanic eruptions, and reactions in living beings) and anthropogenic (transportation, cooking, and industrial activities) processes [2][3]. Owing to their toxicity, persistence, and accumulation, 16 PAHs have been identified as priority pollutants by the United States Environmental Protection Agency (USEPA) and the European Union [4].
Several technologies have been employed to remediate PAHs-contaminated water [5][6]. Physical processes, such as adsorption, filtration, and coagulation, can reduce the amounts of PAHs in water; however, other processes must be performed to degrade PAHs [7]. Whereas chemical processes afford excellent removal efficiency in the decomposition of PAHs, these methods require expensive chemical reagents and energy utilization (radiation, heating, etc.), as well as result in secondary pollution [8]. In addition, biological remediation requires several days or even months [9].
On the other hand, liquid-phase plasma (LPP) has been recently investigated for many applications, such as the decomposition of organic pollutants [10], synthesis of nanoparticles [11], and surface modifications [12]. LPP is a non-thermal plasma in solution, conducted at room temperature and atmospheric pressure conditions. Plasma in the liquid generates diverse active species (e.g., H•, •O2-, H2O2, and •OH), high-energy electrons, and ultraviolet (UV) radiation, resulting in the degradation of organic compounds. In this study, LPP was investigated to treat water contaminated with fluorene (Flu), which is one of the USEPA 16 PAHs.
The effect of adding a commercial photocatalyst to LPP was evaluated as well. Photocatalysts are semiconductors that accelerate photoreactions owing to their presence. Under irradiation, electrons in the valence band are excited to the conduction band, resulting in positive holes in the valence band [13]. These electrons and holes generate active species and cause the decomposition of organic compounds. Among the various photocatalysts, TiO2 was selected for the experiments in this study owing to its chemical stability, nontoxicity, and high reactivity.
In addition, FeSO4·7H2O was added as a source of iron ions to initiate the Fenton reaction and enhance the decomposition efficiency. The combination of iron (Fe2+) and hydrogen peroxide (H2O2) generates hydroxyl radicals, as shown in Equations (1)-(2) [14].
| (1) |
| (2) |
Herein, the degradation efficiency of Flu by LPP was evaluated by varying the discharge conditions (i.e., the frequency and pulse width). To achieve advanced degradation performance, both photocatalysis and the Fenton reaction were combined with LPP. Additionally, the electrical and optical characteristics of LPP were investigated, and the possible degradation pathways were estimated using Fourier transform infrared spectroscopy (FTIR).
2. Experiment
2.1 Chemicals
Fluorene (analytical grade) was purchased from Aladdin. Commercial titanium dioxide (P25, 80% anatase, 20% rutile, BET area, ≈50 m2/g, Degussa) was used as a photocatalyst, and the iron salt FeSO4·7H2O (≥ 99%, Sigma–Aldrich Co. LLC.) was used for the Fenton reaction. All other organic and inorganic reagents used were of analytical grade and were used as purchased without further purification.
2.2 Water remediation
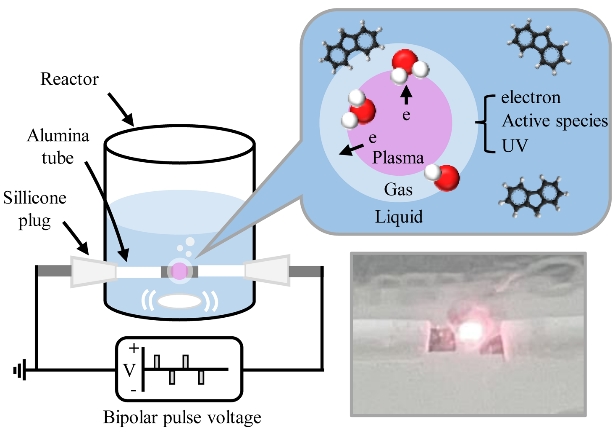
Experiments were performed at room temperature and atmospheric pressure. Flu was dissolved in methanol to prepare a 500 mg/L stock solution because of its inferior solubility, and it was diluted to 10 ppm for all experiments. A 50 mL volume of Flu solution was treated, and plasma discharge in water solution was produced using a bipolar pulse power supply. Tungsten rods were used as electrodes and insulated by an alumina tube. The gap distance between the electrodes and electrode protrusion were set at 1 mm to concentrate the energy. The applied frequency was varied at 10, 20, and 30 kHz, and the pulse width was controlled at 1, 2, and 3 μs. The solutions were mixed using a magnetic stirrer to obtain a homogeneous plasma active field during the experiments. All experiments were conducted at least three times to ensure reproducibility, including the LPP/TiO2 and LPP/Fe2+ experiments. A schematic illustration of the LPP is shown in Figure 1.
For the LPP/TiO2 treatment, the Flu solution was prepared using the same method, and TiO2 was loaded at concentrations of 0.05, 0.1, and 0.2 g/L and stirred for 10 min before performing the experiments. The samples were filtered through polytetrafluoroethylene filters prior to high-performance liquid chromatography (HPLC) analysis.
For the LPP/Fe2+ treatment, the Flu solution was prepared using the same method, and then the pH was reduced to 3 using HCl before the addition of a homogenous catalyst to avoid its precipitation as a hydroxide. The concentrations of iron salt were 1, 5, and 10 mg/L. After the treatment, iron was removed by adding 25% NH4OH to provide alkaline conditions, and the samples were filtered through PTFE filters prior to HPLC analysis.
2.3 Extraction
Samples for HPLC were prepared as follows: A 50 mL volume of the treated solution from the LPP reactor was transferred into a separatory funnel with PTFE caps. Methylene chloride (15 mL) was used to rinse the reactor and transfer the rinsed solvent to the separatory funnel. The separatory funnel was sealed and shaken for 1 min with periodic venting to release excess pressure. The mixture was allowed to equilibrate for 10 min. Subsequently, 10 milliliters of dichloromethane was separated and dried using nitrogen. The extract was dissolved in 2 mL of acetonitrile for HPLC and then filtered through PTFE filters prior to analysis. All samples were stored in brown sample vials in a refrigerator at 4 °C until analysis is performed.
For FTIR analysis, 50 mL of treated contaminated water from the reactor was transferred to a separatory funnel. Next, 10 mL of dichloromethane was added to the separatory funnel. The separatory funnel was agitated for 1 min and left to stand for 10 min. Subsequently, the dichloromethane layer was separated from the water and then dried using nitrogen gas. The extraction was repeated for three times and then combined. The extract was dissolved in dichloromethane (100 μL) and deposited on potassium bromide.
2.4 Analysis
The electrical characteristics of the LPP were monitored using an oscilloscope (Tektronix, MSO 3014) equipped with a voltage probe (Tektronix, P6015A) and a current probe (Tektronix, TCP0020). The optical characteristics of the plasma were recorded using an optical emission spectrometer (OES) (Ocean Insight, FLAME-T-XR1). HPLC (Waters, Waters e2695) was employed to measure the concentration of Flu after treatment, and a photodiode array detector (PDA) (Waters, 2998 PDA) was used to record the absorption spectra at 264 nm. A Sunfire C18 column (Waters, 4.6 mm × 250 mm × 5 μm) was used to perform separation. The mobile phase included acetonitrile as component A and water (5% acetonitrile) as component B. Isocratic elution was performed for 5 min using acetonitrile/water (4:6) (v/v), followed by linear gradient elution to 100 acetonitrile for more than 25 min at a flow rate of 1 mL min-1. The samples were injected into the HPLC system using a microsyringe, and the injection volume was 10 μL. FTIR (Thermo Fisher Scientific, iS50) was employed to characterize the chemical bonds of the samples. The transmittance mode was used, and the spectra were obtained from 400 to 4000 cm-1 with a resolution of 1 cm-1. The production of hydrogen peroxide was determined using the titanium sulfate colorimetric method based on a reaction with titanyl ions in the presence of sulfuric acid, which appears yellow [15]. A UV/Vis spectrometer (UV-1900i, Shimadzu) was used to measure the absorbance of the liquid at 405 nm to determine the generated H2O2.
3. Results and Discussion
3.1 Electrical characteristics of LPP
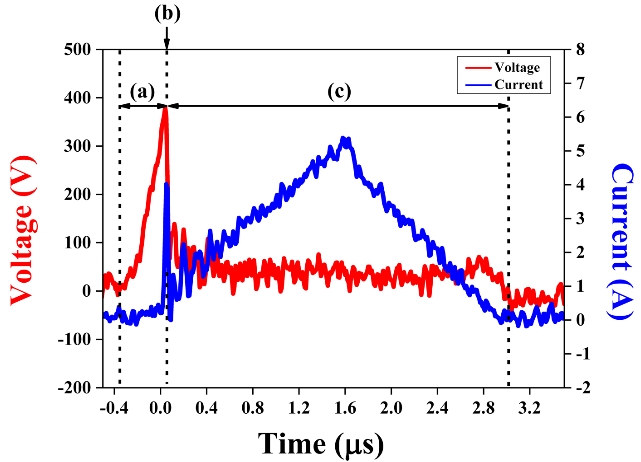
Plasma was generated in the liquid owing to the production of bubbles, which emerged because of Joule heating and electrolysis [16]. Because the current passing through the small surface area of the electrodes generated thermal energy, the liquid between the electrodes was heated to its boiling point, and bubbles were generated. Furthermore, electrolysis occurred because of the ionic current, which generated hydrogen and oxygen gases around the electrode tips. As shown in region (a) of Figure 2, only 0.07 A of the ionic current, which is the consequence of the electrolysis of water, flowed in a short period at the beginning of the pulse. When suitable conditions were attained, electron avalanche occurred, and plasma was generated. Simultaneously, a significant increase in current and a significant decrease in voltage at point (b) were indicated, as shown in Figure 2. The current increased until 5.38 A, and the discharge current predominated over the ionic current in region (c) of Figure 2. After the plasma, the voltage source became a storage capacitor.
3.2 Degradation of Flu by LPP
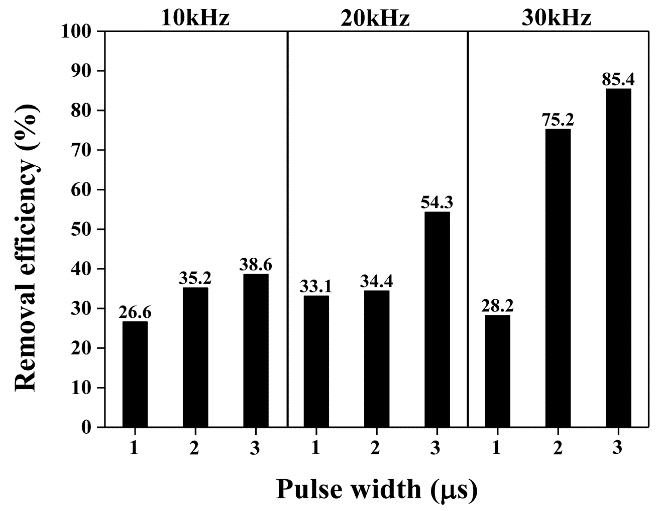
Figure 3 shows the results for Flu removal from aqueous solutions with varying frequencies and pulse widths. The removal efficiency increased with the frequency and pulse width, and the highest degradation efficiency of Flu by the LPP after 10 min of treatment time was 85.4% at 30 kHz and 3 μs. Increasing the frequency and pulse width can increase the energy of the electron, resulting in frequent bombardment between the electron and water and the generation of more active species such as •OH, H2O2, and O3.
It was assumed that the nonlinear increase in the removal efficiency with the increase in the frequencies and pulse widths was due to the interaction among active species. The conversion of the produced species can be represented as follows [17]:
| (3) |
| (4) |
| (5) |
Hence, a slightly reduced removal efficiency was observed at 30 kHz and 1 μs. In addition, excess input energy can generate oxidant species that can react with active species, thereby resulting in less oxidation in Flu.
3.3 Degradation of Flu by LPP/TiO2
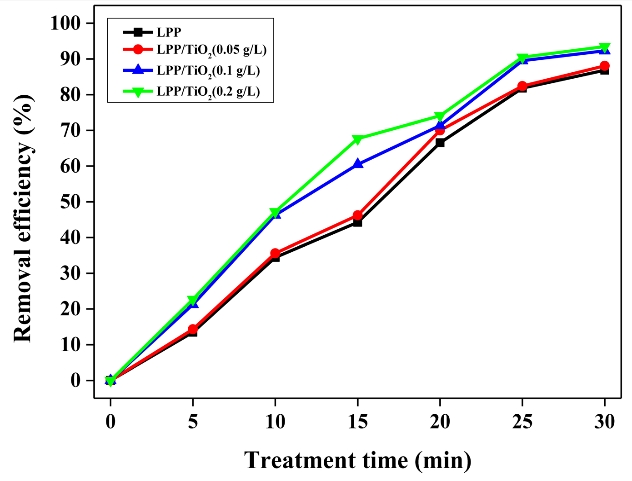
The effect of TiO2 on the degradation of Flu by LPP was investigated. The optimal operating conditions were a frequency of 30 kHz and a pulse width of 3 μs. However, the experiments were performed at 20 kHz and 2 μs because of the instability of the equipment under the former conditions. As shown in Figure 4, even though the samples with 0.05 g/L of TiO2 did not indicate significant differences, the samples with 0.1 and 0.2 g/L of TiO2 indicated improved performances. The degradation efficiency improved from 44.2% to 67.7% when the sample was treated for 15 min with 0.2 g/L of photocatalyst. The improved removal efficiency was primarily attributed to the conversion of surplus UV light to active species. UV radiation was generated by the abrupt deceleration of electrons, thermal radiation of ions, and recombination processes within the plasma [18]. By radiating UV light from the plasma, electron–hole pairs were generated on the surface of the added TiO2, and they participated in redox reactions, thereby resulting in active species. The changed use of UV light effectively degraded Flu.
3.4 Degradation of Flu by LPP/Fe2+
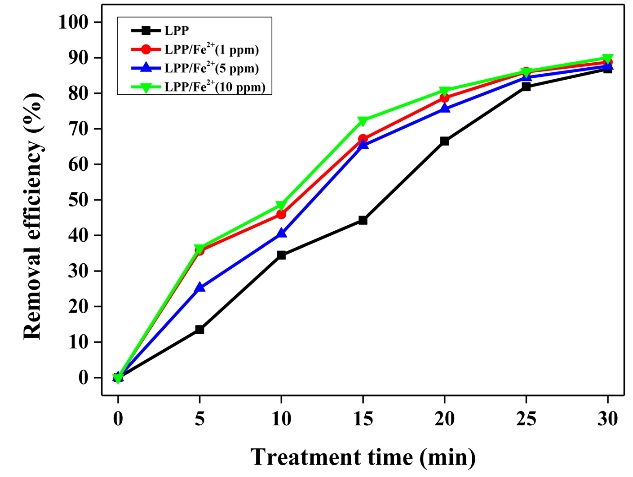
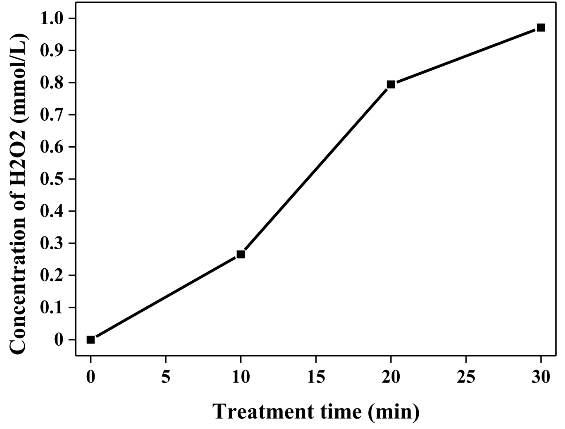
For the same reason as mentioned above, the operating conditions were set at a frequency of 20 kHz and a pulse width of 2 μs. Figure 5 shows the degradation efficiency of Flu by LPP combined with the Fenton treatment. The addition of the catalyst affected the degradation efficiency of Flu in the LPP reactor. The degradation efficiency improved from 44.2% to 72.4% when the sample was treated for 15 min with 10 mg/L of iron salt. This enhancement was primarily attributed to the effective use of H2O2 generated by plasma. The amount of H2O2 as a function of the treatment time is shown in Figure 6. As indicated by Equation 1, a hydroxyl radical is formed by the reaction between iron ions and hydrogen peroxide, which is known as the Fenton reaction. Compared with other studies, the association of the LPP with the Fenton reaction indicated significant benefits, since fewer additional chemical reagents were used and effective Applications of the active species were possible.
3.5 Degradation pathway of Flu under LPP conditions
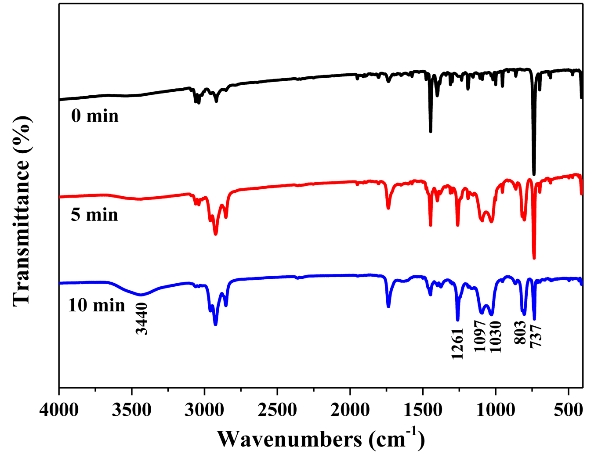
FTIR was used to identify the functional groups of the Flu decomposition intermediates to estimate the degradation pathway. The positions in the 600–900 cm-1 region are characteristic of the number of adjacent hydrogen atoms on the aromatic ring, and the peak at 737 cm-1 in Figure 7 declined, implying the degradation of Flu [19]. Meanwhile, the band centered at 3250–3600 cm-1 increased significantly after treatment, which corresponded to the formation of hydroxyl groups [20]. By contrast, new peaks were observed at 803, 1030, 1097, and 1261 cm-1. These peaks were not considered because they originated from the methyl alcohol used in the stock solutions.
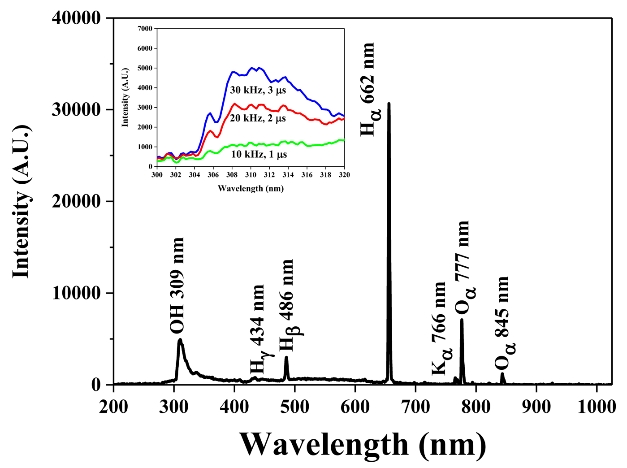
Optical emission spectroscopy analysis was performed under plasma discharge in water to observe the active species. As shown in Figure 8, the major active species were atomic hydrogen (λ = 662 nm), atomic oxygen (λ = 777 nm), and hydroxyl radicals (λ = 309 nm). The inset in Figure 8 shows the variation in the amount of hydroxyl radicals based on the discharge conditions. The quantity of hydroxyl radicals increased with the frequency and pulse width.
The results of FTIR and OES analyses suggested that the presence of hydroxyl radicals whose oxidation-reduction potential was 2.8 V, which is even higher than that of ozone (2.07 V) and hydrogen peroxide (1.8 V), contributed significantly to the decomposition of Flu in the aqueous solution.
4. Conclusion
In this study, the performance of LPP treatment and the effect of addition of catalysts for Flu-contaminated water were investigated. The power operating conditions were directly associated with the degradation efficiency, and the highest removal efficiency obtained was 85.4% in 10 min without any additives. The added photocatalyst was activated by UV light from the plasma. Consequently, electron–hole pairs were generated, which increased the number of active species. In addition, iron salts resulted in more hydroxyl radicals reacting with the hydrogen peroxide, which was created from the plasma. The addition of catalysts enabled the more effective use of the LPP, thereby enhancing the removal efficiencies. This study suggests the possibility of an advanced wastewater treatment system that uses the proposed combination.
Acknowledgments
This work was supported by the New Product Development Project under Purchase Conditions (S2948802) funded by the Ministry of SMEs and Startups (MSS, Korea).
Author Contributions
Conceptualization, S. H. Lee; Methodology, U. J. Kim; Software, U. J. Kim; Formal Analysis, U. J. Kim; Investigation, U. J. Kim; Resources, S. H. Lee; Data Curation U. J. Kim; Writing-Original Draft Preparation, U. J. Kim; Writing-Review & Editing, S. H. Lee; Visualization, U. J. Kim; Supervision, S. H. Lee; Project Administration, S. H. Lee; Funding Acquisition, S. H. Lee.
References
-
A. Mojiri, J. L. Zhou, A. Ohashi, N. Ozaki, and T. Kindaichi, “Comprehensive review of polycyclic aromatic hydrocarbons in water sources, their effects and treatments,” Science of the total environment, vol. 696, 133971, 2019.
[https://doi.org/10.1016/j.scitotenv.2019.133971]

-
M. Howsam and K. C. Jones, “Sources of PAHs in the environment,” PAHs and Related Compounds, pp. 137-174, Springer, Berlin, Heidelberg, 1998.
[https://doi.org/10.1007/978-3-540-49697-7_4]

- B. Maliszewska-Kordybach, “Sources, concentrations, fate and effects of polycyclic aromatic hydrocarbons (PAHs) in the environment. Part A: PAHs in air,” Polish journal of environmental studies, vol. 8, pp. 131-136, 1999.
- Toxicology Profile for Polyaromatic Hydrocarbons, ATSDR’s Toxicological Profiles on CD-ROM. CRC Press, Boca Raton. USEPA, 2005.
-
D. Ghosal, S. Ghosh, T. K. Dutta, and Y. Ahn, “Current state of knowledge in microbial degradation of polycyclic aromatic hydrocarbons (PAHs): a review,” Frontiers in microbiology, vol. 7, 2016.
[https://doi.org/10.3389/fmicb.2016.01369]

-
N. D. Dat and M. B. Chang, “Review on characteristics of PAHs in atmosphere, anthropogenic sources and control technologies,” Science of the total environment, vol. 609, pp. 682-693, 2017.
[https://doi.org/10.1016/j.scitotenv.2017.07.204]

- M. Smol, W. M. Maria, and J. Bohdziewicz, “The use of integrated membrane systems in the removal of selected pollutants from pre-treated,” Monographs of the Environmental Engineering Committee, vol. 119, pp. 143-152, 2014.
-
E. Ntainjua and S. H. Taylor, “The catalytic total oxidation of polycyclic aromatic hydrocarbons,” Topics in Catalysis, vol. 52, no. 5, pp. 528-541, 2009.
[https://doi.org/10.1007/s11244-009-9180-x]

-
P. E. N. G. Hui, Y. I. N. Hua, D. E. N. G. Jun, Y. E. JinShao, et al., “Biodegradation of benzo[a]pyrene by Arthrobacter oxydans B4,” Pedosphere, vol. 22, no. 4, pp. 554-561, 2012.
[https://doi.org/10.1016/S1002-0160(12)60040-X]

-
P. Baroch, V. Anita, N. Saito, and O. Takai, “Bipolar pulsed electrical discharge for decomposition of organic compounds in water,” Journal of Electrostatics, vol. 66, no. 5-6, pp. 294-299, 2008.
[https://doi.org/10.1016/j.elstat.2008.01.010]

-
J. Kang, O. L. Li, N. Saito, “Synthesis of structure-controlled carbon nano spheres by solution plasma process,” Carbon, vol. 60, pp. 292-298, 2013.
[https://doi.org/10.1016/j.carbon.2013.04.040]

-
S. Pitchaimuthu, K. Honda, S. Suzuki, A. Naito, N. Suzuki, K. I. Katsumata, et al., “Solution plasma process-derived defect-induced heterophase anatase/brookite TiO2 nanocrystals for enhanced gaseous photocatalytic performance,” ACS omega, vol. 3, no. 1, pp. 898-905, 2018.
[https://doi.org/10.1021/acsomega.7b01698]

-
J. Schneider, M. Matsuoka, M. Takeuchi, J. Zhang, Y. Horiuchi, M. Anpo, and D. W. Bahnemann, “Understanding TiO2 photocatalysis: mechanisms and materials,” Chemical reviews, vol. 114, no. 19, pp. 9919-9986, 2014.
[https://doi.org/10.1021/cr5001892]

-
A. Babuponnusami and K. Muthukumar, “A review on Fenton and improvements to the Fenton process for wastewater treatment,” Journal of Environmental Chemical Engineering, vol. 2, no. 1, pp. 557-572, 2014.
[https://doi.org/10.1016/j.jece.2013.10.011]

-
G. Eisenberg, “Colorimetric determination of hydrogen peroxide,” Industrial & Engineering Chemistry Analytical Edition, vol. 15, no. 5, pp. 327-328, 1943.
[https://doi.org/10.1021/i560117a011]

-
G. Saito, Y. Nakasugi, and T. Akiyama, “Generation of solution plasma over a large electrode surface area,” Journal of applied physics, vol. 118, no. 2, 2015.
[https://doi.org/10.1063/1.4926493]

-
Y. S. Chen, X. S. Zhang, Y. C. Dai, and W. K. Yuan, “Pulsed high-voltage discharge plasma for degradation of phenol in aqueous solution,” Separation and Purification Technology, vol. 34, no. 1-3, pp. 5-12, 2004.
[https://doi.org/10.1016/S1383-5866(03)00169-2]

-
H. B. Huang, M. L. Fu, F. Da Feng, “Contribution of UV light to the decomposition of toluene in dielectric barrier discharge plasma/photocatalysis system,” Plasma Chemistry and Plasma Processing, vol. 27, no. 5, pp. 577-588, 2007.
[https://doi.org/10.1007/s11090-007-9085-z]

-
M. Czaplicka and B. Kaczmarczyk, “Infrared study of chlorophenols and products of their photodegradation,” Talanta, vol. 70, no. 5, pp. 940-949, 2006.
[https://doi.org/10.1016/j.talanta.2006.05.060]

-
M. L. Wu, M. Q. Nie, X. C. Wang, J. M. Su, and W. Cao, “Analysis of phenanthrene biodegradation by using FTIR, UV and GC–MS,” Spectrochimica Acta Part A: Molecular and Biomolecular Spectroscopy, vol. 75, no. 3, pp. 1047-1050, 2010.
[https://doi.org/10.1016/j.saa.2009.12.051]


