Median-based abnormal heartbeat detection using histogram for arrhythmia reading
Copyright © The Korean Society of Marine Engineering
This is an Open Access article distributed under the terms of the Creative Commons Attribution Non-Commercial License (http://creativecommons.org/licenses/by-nc/3.0), which permits unrestricted non-commercial use, distribution, and reproduction in any medium, provided the original work is properly cited.
Abstract
An abnormal heartbeat caused by the occurrence of arrhythmia in an electrocardiogram signal is very important for arrhythmia reading, and studies on detecting abnormal heartbeats are ongoing. The median absolute deviation method, which is a representative method for detecting abnormal heartbeats, uses the insensitivity of the median value and the median absolute deviation in the feature distribution of the abnormal heartbeat. However, this has a disadvantage in that the processing time is long because the features must be sorted to obtain the median value and median absolute deviation. To improve this, we propose a median-based abnormal heartbeat detection method using a histogram. Unlike the existing median absolute deviation method, the proposed method does not use a sorting process but rather finds the median value and median absolute deviation of the QRS complex’s features, which are shape and interval features of the heartbeat, and detects abnormal heartbeats using the standard deviation method. MIT-BIH ADB, a representative arrhythmia database, was used to evaluate the performance of the proposed method. We confirmed that the proposed method reduced the processing time by approximately 81.79% compared with the existing median absolute deviation method and that the efficiency of the proposed method increases as the amount of heartbeat data increases. In addition, in the proposed method, the non-detection rate of an abnormal heartbeat was 0%, and the over-detection rate of a normal heartbeat was found to be 1.8% on average.
Keywords:
Electrocardiogram signal, Arrhythmia, Abnormal heartbeat, Median absolute deviation, Histogram-based median absolute deviation1. Introduction
The electrocardiogram (ECG) signal represents the electrical activity of the heart through the processes of depolarization and repolarization of the atria and ventricles. To diagnose heart disease, it is necessary to read the ECG signal for longer than 48 h, which burdens the ECG expert [1][2]. In addition, since abnormal heartbeats are more important than normal heartbeats for arrhythmia reading, abnormal heartbeat detection can reduce the burden on the ECG specialist. Specifically, there are approximately 200,000 heartbeats in an ECG signal acquired for 48 h at a sampling frequency of 360 Hz; therefore, so is very difficult to read all of them. Most arrhythmic ECG signals include an abnormal heartbeat of less than 10%. Therefore, if an abnormal heartbeat can be reliably detected, it can considerably help an ECG expert.
Existing abnormal heartbeat detection methods include the standard deviation (STD) method using the characteristics of the heartbeat [3]-[4] and median absolute deviation (MAD)-based abnormal heartbeat detection for arrhythmia reading [5]. The STD method can be applied in various fields because it effectively detects abnormal data when normal data follow a normal distribution and abnormal data have a distribution far from the average value of normal data [6]. Thus, the STD method detects an abnormal heartbeat using a threshold based on the mean and standard deviation of the heartbeat features.
However, as the number of abnormal heartbeats is included, the mean and standard deviation of the features vary greatly, making it difficult to determine the optimal threshold. The MAD method detects an abnormal heartbeat using the insensitivity of the median value and the median absolute deviation from the characteristic distribution of a normal heartbeat. However, this has a disadvantage in that the processing time is long because it requires a process of sorting the features to obtain the median value and MAD of the feature.
Herein, we propose a method to obtain the median value and MAD using a histogram that does not require sorting in the process of finding the median value and MAD of a feature. Most arrhythmias are ventricular arrhythmias, and in the case of atrial arrhythmias, early atrial contraction is the most common. They appear as a shape change of the QRS complex, which is a component of the ECG signal, and a change in the interval between the QRS complex. Therefore, in the proposed method, the amplitude and kurtosis representing the shape change of the QRS complex and the RR interval representing the variation of the interval between the QRS complexes are used as the characteristics of the heartbeat. First, using a histogram, the median value and MAD are obtained, and the amplitude and kurtosis of the R wave and the median value and MAD of the RR interval are obtained.
The remainder of this paper proceeds as follows. Section 2 introduces the existing STD- and MAD-based abnormal heartbeat detection methods. Section 3 describes the median-based abnormal heartbeat detection method using a histogram. In Section 4, we analyze the performance of the proposed method through experiments, and we conclude the paper in Section 5.
2. Existing Abnormal Heartbeat Detection
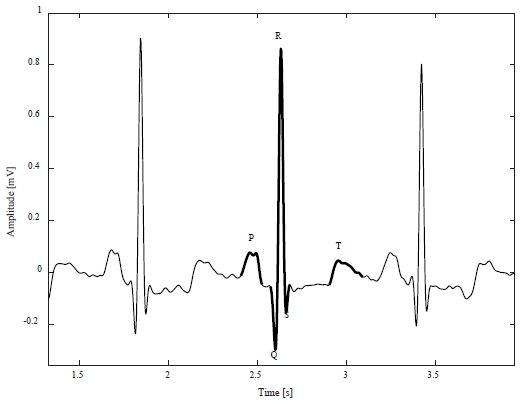
Figure 1 shows an example of a normal ECG signal, which is periodic, and the heartbeat corresponding to one cycle consists of a P wave caused by atrial depolarization, a QRS complex caused by ventricular depolarization, and a T wave caused by ventricular repolarization [7].
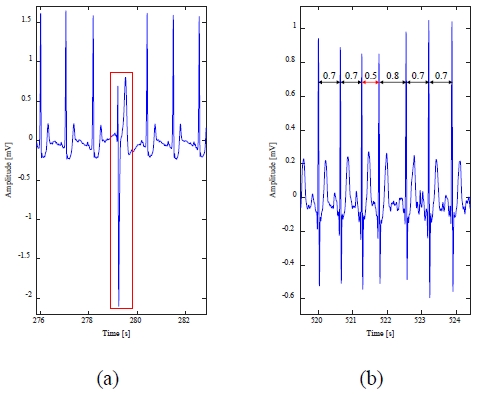
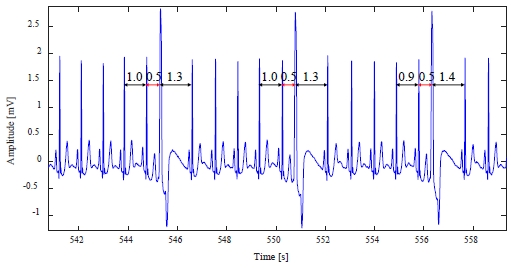
Figure 2 shows examples of arrhythmic ECG signals. Figure 2(a) shows an arrhythmic ECG signal including an abnormal heartbeat with a change in shape from a normal heartbeat, and Figure 2(b) shows an arrhythmic ECG signal including an abnormal heartbeat with a change in the interval from a normal heartbeat.
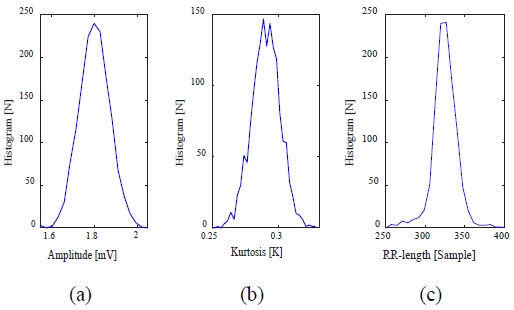
In the existing abnormal heartbeat detection methods, abnormal heartbeats of ventricular arrhythmias and premature atrial contractions are detected. These abnormal heartbeats appear as a shape change in the QRS complex and an interval change between the QRS complex. First, it is assumed that the histograms of the amplitude (V) and kurtosis (K) of the R-peak in the QRS complex and the RR interval (RR) between the QRS complexes for a normal ECG signal follow a normal distribution. Figure 3 shows an example of a histogram of a normal heartbeat in the 119m record of the MIT-BIH ADB [8], a standard arrhythmia database.
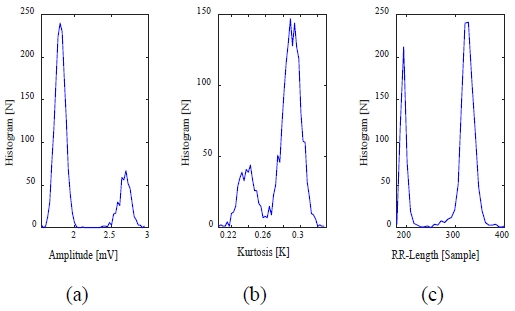
Figure 4 shows an example of a histogram of arrhythmic ECG signals. Figure 4 shows that the histogram of the arrhythmic ECG signal does not follow a normal distribution. This is due to the abnormal heartbeat in the arrhythmic ECG signal.
2.1 STD-based abnormal heartbeat detection
The STD-based abnormal heartbeat detection method ensures that the histogram of arrhythmic ECG signals has a normal distribution. The STD method consists of a feature extraction process to obtain the features of a heartbeat and an abnormal heartbeat detection process using these features.
The feature extraction process is as follows: the R-peak is detected by the R-peak detection method [4] using the refractory period. Then, from the detected R-peak, the amplitude and kurtosis corresponding to the height and curvature at the R-peak are obtained. In addition, the RR interval between the QRS complexes is calculated as the time difference between the current R-peak and the previous R-peak.
The abnormal heartbeat detection process is as follows. It leverages the fact that, as the difference between the feature values from the mean of the normal heartbeat distribution increase, so does the probability of an abnormal heartbeat. Specifically, a heartbeat including an R-peak that satisfies all of the conditions of Equation (1) is detected as a normal heartbeat, and a heartbeat including an R-peak that does not satisfy any of the conditions of Equation (1) is detected as an abnormal heartbeat.
| (1) |
Here, (mV, mK, mRR) and (σV, σK, σRR) denote the mean and standard deviation of (V, K, RR), respectively, and (ωV, ωK, ωRR) denotes the weights for determining the threshold values of (V, K, RR).
In this method, the abnormal heartbeat detection result varies depending on the value, and it is difficult to determine the optimal value. In addition, as the number of abnormal heartbeats is included, the mean and standard deviation of the features vary greatly, making it difficult to determine the optimal threshold value.
2.2 MAD-based abnormal heartbeat detection
In the STD-abnormal heartbeat detection method, it is difficult to determine the optimal threshold value because the mean and standard deviation of the features vary greatly as the number of abnormal heartbeats increases. In the MAD method, reliable abnormal heartbeats are detected, even if the number of abnormal heartbeats is large, using the median value and the median absolute deviation, which are insensitive to the feature values of the abnormal heartbeats.
Equation (2) is an expression showing the median value (MV) and the median absolute deviation (MADV) for V, and the same can be obtained for K and RR.
| (2) |
Here, bM is a constant that causes the standard deviation and the MAD to coincide with the normal distribution.
Similar to the STD-abnormal heartbeat detection method, MAD abnormal heartbeat detection uses the fact that as the difference between the features from the median value increase, the more likely it is to be an abnormal heartbeat. Specifically, a heartbeat including an R-peak that satisfies all of the conditions of Equation (3) is detected as a normal heartbeat, and a heartbeat including an R-peak that does not satisfy any of the conditions of Equation (3) is detected as an abnormal heartbeat.
| (3) |
Here, (MV, MK, MRR) and (MADV, MADK, MADRR) denote the median and MAD of (V, K, RR), respectively, and (ωV, ωK, ωRR) denotes the weights for determining the threshold values of (V, K, RR). Although the MAD method includes a large number of abnormal heartbeats, the median value and the median absolute deviation show only slight changes, so it can reliably detect abnormal heartbeats.
3. Proposed Abnormal Heartbeat Detection
The disadvantage of the MAD method is that the calculation time is long because a sorting process is required to obtain the median value and the median absolute deviation. We propose a histogram-based MAD method (HMAD) that calculates the median value and median absolute deviation without a sorting process.
First, when a histogram with an amplitude value of k for a given amplitude data V = {v1, ⋯ , vN} is expressed as H(V, k), the median value (μM) can be obtained as in Equation (4).
| (4) |
Here, CH(V, i) denotes the number of heartbeats with an amplitude value less than or equal to i, the amplitude data V given as a cumulative histogram. μM(V) represents the amplitude value at the moment over half of the total heartbeats (N) in the cumulative histogram, which is the median value.
Using the median value μM and the histogram, the MAD (σM) is calculated as in Equation (5).
| (5) |
Here, CH′(V, i)denotes the number of heartbeats with an amplitude difference of less than or equal to i. σM(V) represents the amplitude value at the moment over half of the total heartbeats in the cumulative histogram, which is the MAD.
Figure 5 shows the mean and median values, standard deviation, and MAD of the histogram for the normal heartbeat, and the mean and median values, standard deviation, and MAD of the histogram, including the abnormal heartbeat in the 119m record of the MIT-BIH ADB.
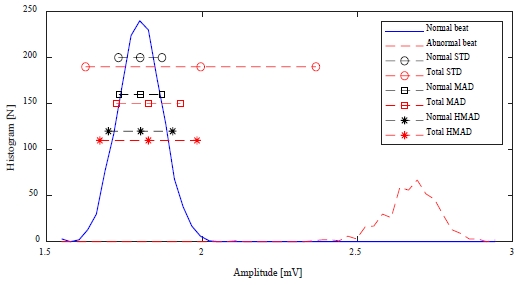
Comparison of STD, MAD, and HMAD according to the distribution of abnormal heartbeats in the MIT-BIH ADB 119m record
From Figure 5, the mean and median values of normal heartbeats, as well as the standard deviation and MAD, are similar. However, when an abnormal heartbeat is included, the mean and standard deviation change significantly, while the median and MAD show little change. This is similar to the cases of K and RR. Therefore, it is difficult to determine the optimal weight in Equation (1) for STD-abnormal heartbeat detection using the mean and standard deviation.
If the median value and MAD are calculated using the histogram, as in Equations (4)-(5), the amount of calculation can be reduced because the sorting process is not required. This can solve one problem associated with the MAD method, in which the sorting time increases in proportion to the total number of heartbeats.
Histogram-based abnormal heartbeat detection uses the fact that as the difference between the feature value and the median value increases, the more likely it is to be an abnormal heartbeat. Specifically, a heartbeat including an R-peak that satisfies all of the conditions of Equation (6) is detected as a normal heartbeat, and a heartbeat including an R-peak that does not satisfy any of the conditions of Equation (6) is detected as an abnormal heartbeat.
| (6) |
Here, (μM(V), μM(K), μM(RR)) and (σM(V), σM(K), σM(RR)) denote the median and MAD of (V, K, RR), respectively, and (ωV, ωK, ωRR) denotes the weights for determining the threshold values of (V, K, RR). The MAD method can reliably detect an abnormal heartbeat because there is little change in the transient, even if many abnormal heartbeats are included.
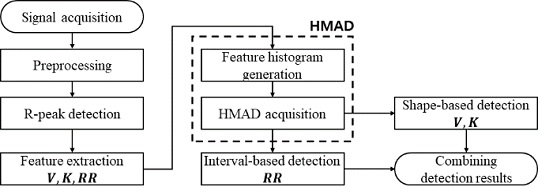
Figure 6 is a flowchart of the proposed method.
4. Experiments and Results
MIT-BIH ADB, an electrocardiogram database including arrhythmias, was used to evaluate the performance of the proposed method. MIT-BIH ADB consists of 48 records of approximately 30 min with a sampling frequency of 360 Hz. A 1- to 25-Hz 3rd-order Butterworth band-pass filter was used for preprocessing to reduce baseline fluctuations and power supply noise.
Next, to confirm the superiority of the computational amount of the proposed method, the time required to obtain the median value and MAD according to heartbeat was measured. The test environment used an Intel i5-10400 2.9-GHz CPU, with 32 GB of RAM, and MATLAB 2021.
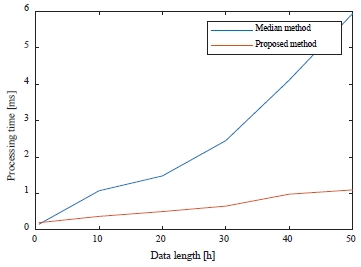
Table 1 shows the results of the time taken to obtain the median value and MAD according to the heartbeat. After measuring the processing time for the 30-min length of the experiment, the processing time was measured up to 50-h data in 10-h increments in consideration of the long-term measurement of 48 h or more.
Figure 7 is a graphical representation of Table 1.
As shown in Table 1 and Figure 7, the proposed method does not require a sorting process, so the processing time is reduced compared to the median method. When the data length increases, the processing time of the median method increases more rapidly than that of the proposed method.
A confusion matrix was used as an indicator for the performance evaluation. True Positive (TP) denotes the number of detections of an abnormal heartbeat as an abnormal heartbeat, and False Negative (FN) denotes the number of detections of abnormal heartbeats as normal heartbeats. TN (true negative) represents the number of normal heartbeats detected as normal heartbeats, and False Positive (FP) represents the number of normal heartbeats detected as abnormal heartbeats. The false-negative ratio (FNR), indicating the non-detection rate of an abnormal heartbeat, and the false-positive ratio (FPR), indicating the over-detection rate of a normal heartbeat, were used. The FNR and FPR are shown in Equation (7).
| (7) |
The results of the STD-based, MAD-based, and proposed methods were compared with respect to shape, interval, and signals in which both shape and interval deformation occurred. The 214m, 209m, and 119m data are records containing a large number of abnormal heartbeats corresponding to each type of deformation, and the detailed detection results are analyzed as follows.
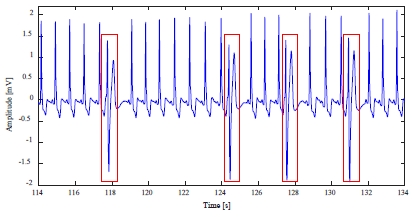
The 214m data includes 256 premature ventricular contraction (PVC) abnormal heartbeats with shape deformation, as shown in Figure 8.
The detection results of Figure 8 are shown in Table 2.
In Table 2, the STD-abnormal heartbeat detection method over-detected the normal heartbeat and a large number of non-detections of abnormal heartbeats. Conversely, the proposed method for detecting an abnormal heartbeat greatly reduced non-detections and over-detections.
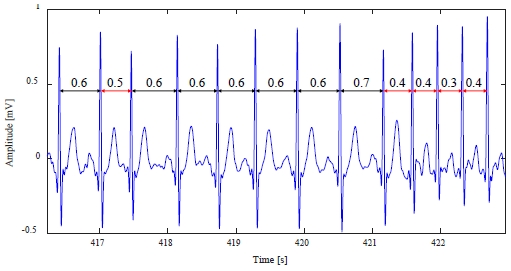
The 209m data includes 383 premature atrial contraction abnormal heartbeats with RR interval deformation, as shown in Figure 9.
In datum 209m, as shown in Figure 9, in the case of a normal heartbeat, the RR interval is 0.6–0.7 s, but when an abnormal beat occurs, it is reduced to 0.3–0.5 s. The abnormal beat detection results from Figure 9 are shown in Table 3.
In Table 3, the STD method has a large number of non-detections because the distortion of the standard deviation according to the ratio of the abnormal heartbeat is large. Conversely, the non-detection rate was greatly reduced in the proposed method.
As shown in Figure 10, the 119m data includes 444 PVC abnormal heartbeats in which shape and RR interval changes occur simultaneously.
Table 4 shows the detection results of Figure 10. From Table 4, the proposed method has excellent performance, while the non-detection and over-detection performance of the STD method are not as good.
Table 5 shows the non-detection and over-detection rates of the proposed method for the MIT-BIH ADB records.
From Table 5, the non-detection rate of the abnormal heartbeat for the MIT-BIH ADB of MAD and the proposed method was 0%, and the over-detection rate was 1.8% on average. Thus, we can confirm that the proposed method preserves the performance of the MAD well. Therefore, we can conclude that the proposed method has excellent abnormal heartbeat detection performance in terms of the calculation amount, non-detection rate, and over-detection rate.
5. Conclusion
We proposed a median-based abnormal heartbeat detection method using a histogram. Unlike the existing MAD method, the proposed method does not use a sorting process but rather finds the median value and median absolute deviation of the shape and RR interval of the QRS complex, which are features of heartbeats, and detects an abnormal heartbeat using the STD method. Through the experiment, we confirmed that the processing time was reduced by approximately 81.79% compared with that of the MAD method. We confirmed that the efficiency of the proposed method increases as the amount of data increases. In addition, through experiments, the proposed method detected all of the non-detection rates of the abnormal heartbeat as 0% and minimized the over-detection rate of the normal heartbeat to 1.8%. Therefore, the proposed abnormal heartbeat detection method can be effectively utilized for expert arrhythmia readings.
Acknowledgments
This study was supported by the BK21 FOUR project funded by the Ministry of Education, Korea (4199990113966), Basic Science Research Program through the National Research Foundation of Korea (NRF) funded by the Ministry of Education (NRF-2020R1I1A1A01072343), funded by the Ministry of Science and ICT (NRF-2020R1F1A1074367).
Author Contributions
Conceptualization, S. Lee and K. Park; Methodology, K. Park; Software, S. Lee; Validation, S. Lee; Formal Analysis, K. Park; Investigation, K. Park; Resources, S. Lee; Data Curation, S. Lee; Writing—Original Draft Preparation, S. Lee; Writing—Review & Editing, K. Park; Visualization, S. Lee; Supervision, K. Park; Project Administration, K. Park; Funding Acquisition, K. Park.
References
-
M. Llamedo and J. Martinez, “Heartbeat classification using feature selection driven by database generalization criteria,” IEEE Transactions on Biomedical Engineering, vol. 58, no. 3, pp. 616-625, 2011.
[https://doi.org/10.1109/TBME.2010.2068048]

-
S. Kim, “Arrhythmia detection using rhythm features of ECG signal,” Journal of The Korea Society of Computer and Information, vol. 18, no. 8, pp. 131-139, 2013 (in Korean).
[https://doi.org/10.9708/jksci.2013.18.8.131]

-
K. Park, J. Kim, C. Ryu, B. Choi, and J. Kim, “Unusual waveform detection algorithm in arrhythmia ECG signal,” Journal of Korean Institute of Intelligent Systems, vol. 23, no. 4, pp. 292-297, 2013 (in Korean).
[https://doi.org/10.5391/JKIIS.2013.23.4.292]

-
S. Lee, C. Ryu, and K. Park, “Adaptive detection of unusual heartbeat according to R-wave distortion on ECG signal,” Journal of The Institute of Electronics and Information Engineers, vol. 51, no. 9, pp. 200-207, 2014 (in Korean).
[https://doi.org/10.5573/ieie.2014.51.9.200]

-
S. Lee and K. Park, “Abnormal heartbeat detection based on shape and interval deformation for arrhythmia reading,” Journal of the Korean Society of Marine Engineering, vol. 43, no. 9, pp. 761-767, 2019 (in Korean).
[https://doi.org/10.5916/jkosme.2019.43.9.761]

-
Y. Jung, S. Lee, and K. Park, “Defect detection based on periodic cell pattern elimination in TFT-LCD cell images,” Journal of the Korean Society of Marine Engineering, vol. 41, no. 3, pp. 251-257, 2017 (in Korean).
[https://doi.org/10.5916/jkosme.2017.41.3.251]

- R. J. Huszar, Basic Dysrhythmias: Interpretation & Management, Mosby, 2007.
- G. Moody and R. Mark, “The MIT-BIH arrhythmia database on CD-ROM and software for use with it,” Proceedings of Computers in Cardiology, pp. 185-188, Chicago, USA, 1990.

