A study on vessel applicable indoor environment monitoring system
Copyright © The Korean Society of Marine Engineering
This is an Open Access article distributed under the terms of the Creative Commons Attribution Non-Commercial License (http://creativecommons.org/licenses/by-nc/3.0), which permits unrestricted non-commercial use, distribution, and reproduction in any medium, provided the original work is properly cited.
Abstract
Recently, interest in indoor fine dust and indoor environment improvement has been increasing. Compared to land transportation, ships have a more restricted indoor environment owing to stability and space constraints. Due to the nature of the activities, such as, eating and moving on board a ship, if the indoor environment is polluted, exposure to that pollution can occur for a long time. Therefore, in this study, a vessel-applicable indoor environment monitoring system is developed that measures the indoor environmental values and communicates with the server using Wi-Fi. Further, to improve the reliability of the implemented system, an algorithm for removing the outliers in the data is proposed.
Keywords:
Environment monitoring, Noise filtering, Ship indoor environment1. Introduction
Recently, with the increased interest in indoor fine dust, the interest in improving indoor environments to maintain a comfortable indoor space is also increasing [1].
In accordance with the recent amendments to the Indoor Air Quality Management Act, the maintenance and management of indoor air quality in apartment houses and public transportation vehicles is regulated. In public transportation (buses and trains), the research on indoor environment measurement and measurement systems is being actively conducted; however, the research on ships is insufficient [2].
Compared to general structures including land transportation, it is essential for ships to maintain the confidentiality of the outer shell for water immersion protection and crevice wind protection because of stability and space restrictions. Accordingly, the indoor environment of ships can be exposed to pollutants for a long time [3].
Therefore, in this study, a ship-applied indoor environment monitoring system is developed that combines an indoor environment measurement system and a Wi-Fi-based data communication system.
This paper is organized as follows: Section 2 introduces the current indoor environment management standards based on the Air Quality Control Act and related systems applied to land transportation. In Sections 3 and 4, the design and performance evaluation results of the indoor environment monitoring system for ships are presented. Finally, concluding remarks are presented in Section 5.
2. Indoor Environment Management Standards and Related Systems
In the Indoor Air Quality Management Act for public facilities, indoor space pollutants are divided into five maintenance requirements and five recommended standards, and these pollutants are managed according to the relevant laws of the relevant ministries. Table 1 shows the indoor air quality management status defined by the Ministry of Environment and Ministry of Health and Welfare [5].
Efforts are being made to maintain a comfortable indoor environment based on these management regulations, and various studies are being conducted on indoor environment monitoring for this purpose [3].
As an indoor environment monitoring technology for land transportation, the London underground and Siemens mobility provide indoor environment information through an in-train display after applying air monitoring and ride comfort monitoring to new railway vehicles currently operating in the London underground system [6]. Hyundai Rotem is developing a service that measures the fine dust, ultrafine dust, temperature, and humidity in a train and provides passengers with cabin congestion and fine dust figures [7].
3. System Design
3.1 System implementation
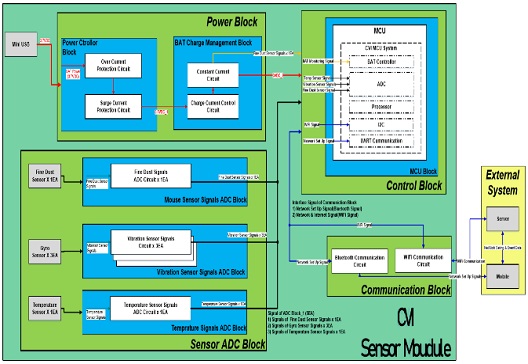
In this study, an IoT-based indoor environment monitoring system is designed. The system consists of a monitoring sensor module that collects real-time indoor environment information, a calculation and data processing module that analyzes information and transmits control signals, and a Wi-Fi-based communication module. Each sensor collects information about the indoor environment, integrates the collected information within the sensor module, and delivers it to the indoor environment integrated management module server through a wireless network.
Figure 1 shows the system architecture showing the overall operational flow of the system to be developed and the configuration of each module.
The measurement equipment for monitoring the indoor environment of a ship and maintaining and improving the indoor environment at an appropriate level must acquire data on indoor environment information (temperature, humidity, and fine dust) and indoor activity information (vibration and noise). The information collected from each sensor module is presented in Table 2.
3.2 Outlier removal algorithm
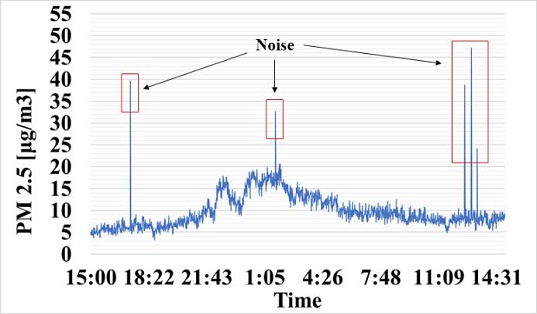
The actual indoor environment changes continuously at a slow rate. However, in the case of an indoor environment monitoring system in a ship, it is an environment in which the outliers are prone to occur because of challenges such as communication errors due to closed spatial characteristics.
Figure 2 shows the actual collected PM 2.5 (particulate matter less than 2.5) data. In this figure, the x-axis is time in minutes, and the y-axis is the concentration of PM 2.5. The overall signal is stable; however, a signal with an exceptionally high transient value can be observed, as represented by the red box. The majority of these are communication errors that occur in the shielding environment of ships, which makes it difficult to monitor and manage the indoor environment through this system.
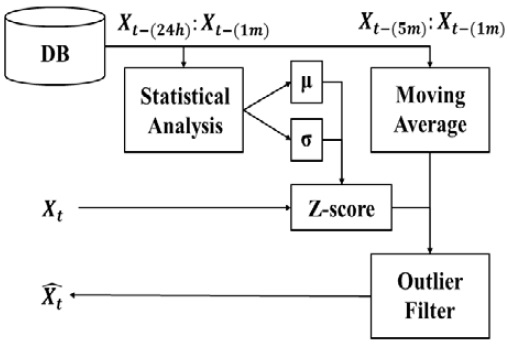
To address this problem, an outlier removal algorithm is proposed, as shown in Figure 3. The mean and standard deviation were calculated by statistically analyzing the data of the previous 24 h based on the measurement time, and the calculated statistical values were converted into a Z-score. Based on this result, it is determined whether the data at the current time point is normal or abnormal, and if it is abnormal, the outlier is replaced by a moving average filter.
Using Equation (1), the Z-score value Zt can be derived.
| (1) |
where, Xt is the air condition at time t, μ(24h) and σ(24h) are the mean and standard deviation, respectively. Zt becomes a criterion for filtering, as shown in Equation (2).
| (2) |
The estimation value of Equation (2) is determined through the threshold, and Xt is the moving average.
4. Experiment and Performance Verification
4.1 Proposed algorithm feasibility analysis
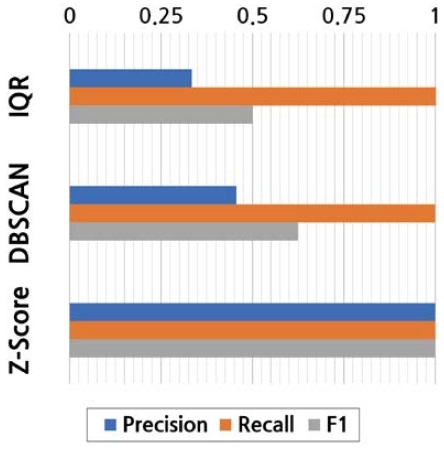
To verify the validity of the proposed outlier removal algorithm, it was compared and analyzed with widely used IQR and DBSCAN [8, 9]. The experiment was based on the data collected for a single day by installing the actual equipment on the ship. As shown in Figure 4, the Z-score applied in this study displayed the best accuracy.
4.2 Performance verification
To evaluate the actual performance of the proposed indoor environment monitoring system, it was installed in an actual vessel environment, and experiments were conducted.
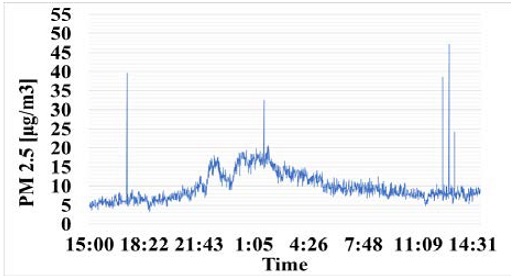
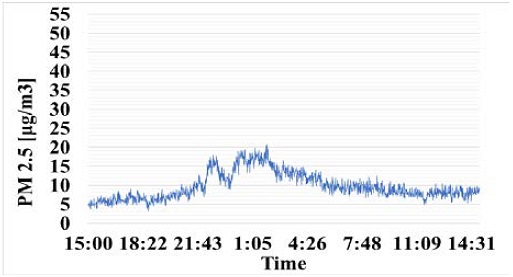
Figure 5 and 6 show the raw measured data of PM 2.5 and the same filtered result, respectively. It can be seen that the outliers generated in Figure 5 are all removed as a result of the filter in Figure 6.
5. Conclusion
In this study, an indoor environment monitoring system and an outlier removal algorithm to minimize noise for the efficient management of indoor air quality in ships was proposed. To verify the performance of the proposed system, it was installed on an actual ship, and the experimental data were collected. The experimental results confirmed that the proposed system can be operated in a ship environment.
Acknowledgments
This research is the result of a study on the “Leaders in Industry-university Cooperation+” Project, supported by the Ministry of Education and National Research Foundation of Korea.
Author Contributions
Conceptualization, Y. -I. Joo ; Methodology, G. -D. Choi and Y. -I. Joo; Writing-Original Draft Preparation, G. -D. Choi and Y. -I. Joo; Validation, G. -D. Choi, O. C. Kwon and Y. -I. Joo; Writing-Review & Editing, G. -D. Choi and Y. -I. Joo.
References
- J. Y. Kim, Design and Implementation of Automatic Control System with Indoor Environment Monitoring Based on Internet of Things, M. S. Thesis, Daegu University, Korea, 2006 (in Korean).
-
S. Lee and J. K. Lee, “Visualization of the comparison between airborne dust concentration data of indoor rooms on a building model,” Journal of the Korean Housing Association, vol. 26, no. 4, pp. 55-62, 2015 (in Korean).
[https://doi.org/10.6107/JKHA.2015.26.4.055]

-
G. Y. Doe, H. S. Lee, Y. G. Lee, and H. K. Lee, “A study on indoor air quality in new ship,” Journal of Korean Navigation and Port Research, vol. 31, no. 5, pp. 427-434, 2007 (in Korean).
[https://doi.org/10.5394/KINPR.2007.31.5.427]

- C. Cho, Y. Jeon, K. Kwon, J. Seo, H. Park, S. Oh, and I. J. Chung, “IoT-based real-time air quality measurement system in residential environments,” Korea Intelligent Information System Society, vol. 201, no. 8, p. 133, 2017 (in Korean).
-
T. W. Kim, Y. K. Yang, M. Y. Kim, J. W. Moon, and J. C. Park, “Development of ‘Internet of Things’ based indoor environment measurement sensor module,” Journal of Korean Society Living Environment System, vol. 26, no. 1, pp. 92-100, 2019 (in Korean).
[https://doi.org/10.21086/ksles.2019.02.26.1.92]

-
M. Stone and E. Aravopoulou, “Improving journeys by opening data: the case of Transport for London (TfL),” The Bottom Line, vol. 31, no. 1, pp. 2-15, 2018.
[https://doi.org/10.1108/BL-12-2017-0035]

- M. Kozłowska, “MEDCOM exports and wins new global markets," TTS Technika Transportu Szynowego, vol. 25, 2018.
-
H. P. Vinutha, B. Poornima, and B. M. Sagar, “Detection of Outliers using Interquartile Range Technique from Intrusion Dataset,” Information and Decision Sciences, Springer, Singapore, pp. 511-518, 2018.
[https://doi.org/10.1007/978-981-10-7563-6_53]

- K. Khan, S. U. Rehman, K. Aziz, S. Fong, and S. Sarasvady, “DBSCAN: Past, present and future,” In the Fifth International Conference on the Applications of Digital Information and Web Technologies (ICADIWT 2014), IEEE, pp. 232-238, 2014.


