Study on characteristics of GHG life cycle assessment for alternative marine fuels
Copyright © The Korean Society of Marine Engineering
This is an Open Access article distributed under the terms of the Creative Commons Attribution Non-Commercial License (http://creativecommons.org/licenses/by-nc/3.0), which permits unrestricted non-commercial use, distribution, and reproduction in any medium, provided the original work is properly cited.
Abstract
Greenhouse gas reduction is becoming an important global issue due to global warming. In particular, greenhouse gas reduction goals for each country have been set in accordance with the UN Framework Convention on Climate Change (UNFCCC). In the case of ships, the 72nd Marine Environmental Protection Committee (MEPC) established an "initial greenhouse gas reduction strategy" and developed related regulations with the goal of 50% greenhouse gas reduction by 2050 compared to 2008. In the case of alternative fuels for ships, hydrogen, ammonia, and LNG are being reviewed as alternative fuels. However, there is a need to minimize the amount of greenhouse gases generated in the production process of alternative fuels. Therefore, in this study, we examined the fuel production process and the total amount of greenhouse gases generated by ships in accordance with recently announced European standards.
Keywords:
Alternative fuel, Greenhouse gas, Life cycle assessment, IMO, Well to Wake1. Introduction
Greenhouse gas reduction is now an important global issue due to global warming. In particular, according to the UN Framework Convention on Climate Change (UNFCCC), greenhouse gas reduction targets are set by country, and in Korea, greenhouse gas reduction targets (NDC) are set at 35% or more compared to 2018[1].
In the case of ships, the 72nd Marine Environmental Protection Committee (MEPC) established an initial IMO greenhouse gas reduction strategy and developed related regulations with the goal of 50% greenhouse gas reduction by 2050 compared to 2008. To reduce the greenhouse gas emission of ships, energy conversion and transformation of the propulsion system are required, and technologies are required to improve energy parameters such as hull efficiency and reduce hull resistance.
In particular, technologies for introducing low-carbon and carbon-free fuels in existing fossil fuels are expected to become a major technology for GHG reduction.
Until now, the application technology of low-carbon and carbon-free fuels has been Tank-to-Propeller, evaluating only greenhouse gases generated from ships. Therefore, greenhouse gases generated during the production process have not been considered. To achieve the ultimate goal of greenhouse gas reduction, the importance of fuel life cycle evaluation through well-to-propeller is recognized in the international community. Additionally, the objective is to evaluate low-carbon and non-carbon fuel through the evaluation of the entire process of production, transportation, and consumption.
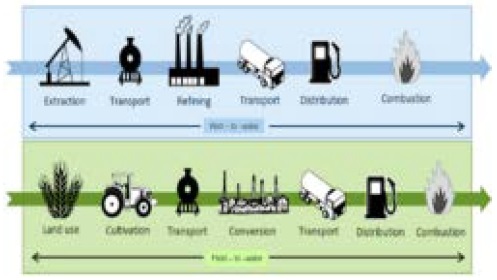
Figure 1 shows a schematic diagram of the entire process of production, transportation, purification, and combustion by dividing it into fossil fuels and biofuels. As such, it is expected that greenhouse gases are generated not only by the ship itself but also from the fuel production process. Therefore, in this study, we analyzed the change in greenhouse gas evaluation characteristics through the life cycle evaluation of hydrogen, ammonia, low-carbon fuel LNG, and fuel, which have been considered as carbon-free fuels.
2. Evaluation Method of Life Cycle Assessment for Fuels
2.1 Definition of greenhouse gas
The United Nations Convention on Climate Change defines carbon dioxide, methane, nitrous oxide, hydrogen fluoride, sulfur hexafluoride, nitrogen trifluoride, and PFCs as the seven major greenhouse gases [3]. However, recently, black carbon has also been classified as a greenhouse gas, and black carbon has been designated as a greenhouse gas material. However, this study was conducted according to the IPCC standards, according to which black carbon is not defined as a greenhouse gas [4].
Most of the greenhouse gases generated through combustion on ships are carbon dioxide, methane, and nitric oxide. When LNG fuel, ammonia fuel, etc. are used, the emission amounts of methane and nitrogen dioxide are partially changed owing to the influence of methane slip.
To evaluate the greenhouse gas impact of methane and nitrous oxide, a global warming potential (GWP) must be designated, which is calculated based on the period of existence in the atmosphere in the event of greenhouse gas generation and is classified into 20 and 100 years [5].
In the recent IPCC and national greenhouse gas reduction plans, the global warming index was selected based on GWP-100, and GWP used the standard of methane GWP 28 and nitrogen dioxide GWP 265 based on carbon dioxide as one.
2.2 Scope of greenhouse gas life cycle
From the production process of ship fuel oil to the conversion from propeller to power, the entire process from production to propeller is defined as well-to-tank, combustion-to-discharge from ship, and is summarized as follows.
Table 1 shows the classification of the pre-term life cycle evaluation of the LCA, where GHGe is the sum of greenhouse gases emitted throughout the process. Well-to-Tank is the greenhouse gas emissions generated during production, purification, and transportation from oil wells to ship tanks, and Tank-to-Propeller is the amount of greenhouse gas generated during combustion in the ship.
2.3 Evaluation method of Well-to-Tank
In the method of evaluating the production process of ship fuel oil, the result changes according to the approach, such that the characteristics of the fuel or the production process must be appropriately reflected. To this end, it is necessary to apply the evaluation method commonly used worldwide. However, the currently applied international standard ISO14044:2006 is a criterion, which is applied to industrial products and is considered unsuitable for ship fuel oil. Therefore, the IMO is developing separate LCA guidelines, but as it has not been completed yet, this study was conducted based on evaluation through ISO 14044:2006.
2.4 Evaluation method of Tank-to-Propeller
The greenhouse gases generated by supplying power to the propeller in the fuel tank of the ship are divided into carbon dioxide, methane, and nitrogen dioxide. Currently, carbon dioxide emission standards are defined as fuel consumption and carbon dioxide emission factors. Methane and nitrous oxide do not have unified values yet, hence the values were calculated based on the values defined in the 4th IMO GHG.
2.5 Calculation method of GHG emission for Well-to-tank
To date, the well-to-wake values for all fuels of a ship have not been set. This includes processes, methods, types of facilities, and methods of emitting greenhouse gases, such as post-treatment of greenhouse gases. Greenhouse gases generated during fuel production, have not been treated as greenhouse gases of ships. However, a review of greenhouse gases generated in the production process of ship fuel has been initiated in response to international greenhouse gas reduction, and the result of Well-to-Tank, which is currently the most reliable, is "Emission from the fuel in use" issued by the EU.
In addition, when analyzing the greenhouse gas of fuel according to Tank-to-Propeller, the amount of methane slip and nitrogen dioxide generated, should be reviewed. Therefore, this value is used to evaluate the amount of greenhouse gas reduction by fuel using the value of "Fuel EU Maritime" provided by the European Union.
The greenhouse gas generated by supplying power to the propeller in the fuel tank of a ship is divided into carbon dioxide, methane, and nitrogen dioxide. Currently, carbon dioxide emission standards are defined as fuel consumption and carbon dioxide emission coefficient (Cf). Methane and nitrous oxide do not have unified values yet, hence the values were calculated based on the values defined in the 4th IMO GHG study.
3. Assessment of Greenhouse Gas Reduction by Alternative Fuel
3.1 Sample Vessel
The ship selected for comparative analysis of greenhouse gases by fuel was an MR tanker, and annual greenhouse gas emissions were calculated based on the fuel consumption of the main institution of the ship species, which made it difficult to reduce greenhouse gases compared to container ships. The target ship was an MR tanker, and its main specifications are as follows:
The annual fuel consumption of the ship was calculated using the fuel use method of the average MR tanker ship, which was the value reported in previous studies. The output was 10,965 kW, 168 g/kW based on fuel consumption (NCR), and the annual sailing days were calculated as 264 days.
| (1) |
Equation (1) was constructed to calculate the annual fuel consumption based on the engine fuel consumption and voyage data. As a result of the above calculation, the annual fuel consumption was calculated as 11,671.67 ton. When greenhouse gas emissions were calculated based on Tank-to-Wake, we applied the Cf value of HFO as 3.114 [8], and found that approximately 36345.58 tons of greenhouse gas were emitted.
3.2 GHG assessment for Well-to-Tank
Table 4 shows the GHG emissions generated by the production process and ships as developed by the EU. First, we calculated the value of Well-to-Tank based on the fuel consumption above.
First, hydrogen, ammonia, and LNG were converted based on the calories of HFO (base fuel) (11,167.67 tons) used annually in MR tanker ships to calculate the greenhouse gas emitted annually by the target ship.
The amount of alternative fuel used, was calculated by converting based on the amount of low heat generated as shown in Equation (2):
| (2) |
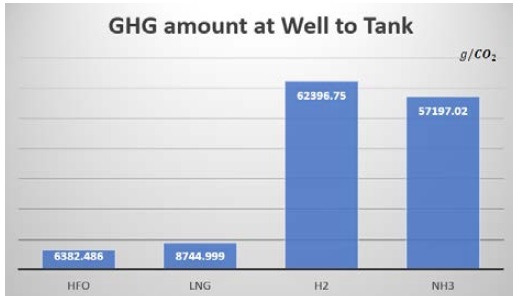
The following Well-to-Tank values were calculated when greenhouse gas emissions generated during the fuel production process were applied according to Table 4 LCA Emission Factor.
Based on Well-to-Tank, hydrogen had a value approximately 9.77 times higher than that of existing fuels and ammonia had a value 8.96 times higher than that of existing fuels, which shows that a very high amount of greenhouse gases are emitted during fuel production.
3.3 GHG assessment for Tank-to-Wake
When calculating the Tank-to-Propeller values, hydrogen and ammonia were considered as zero, and for HFO and LNG, the values of carbon dioxide, methane slip, and nitric oxide were calculated additionally.
First, in the case of methane slip of LNG, we calculated greenhouse gas emissions by applying the values of medium-speed auto cycle engine as 3.1, low-speed auto cycle engine as 1.7, and low-speed diesel engine [9].
In the case of tank-to-wake evaluation, hydrogen and ammonia do not emit carbon in the existing IMO regulations, but LNG HFO is evaluated as a fuel that emits carbon.
3.4 Assessment of Well-to-Propeller by alternative fuel
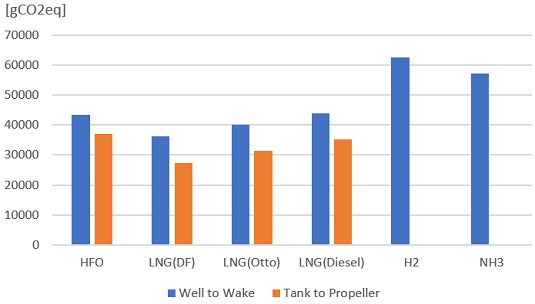
The well-to-wake values of HFO, LNG, H2, and NH3 are as follows:
When evaluating LCA, the fuel that reduces the maximum greenhouse gas is LNG, and the order is identified as HFO, ammonia, and hydrogen, resulting in values that are significantly different from the results of tank-to-wake.
4. Conclusion
This study compared hydrogen ammonia, which is undergoing technology development in Korea, with HFO LNG, an existing fuel, through the evaluation of the entire process of greenhouse gases as claimed by the International Maritime Organization and the European Union.
- 1. In the case of Tank-to-Wake, as per the existing evaluation methods, hydrogen and ammonia were evaluated as carbon-free fuels with zero carbon emissions.
- 2. When the entire process was evaluated, fossil fuel-based hydrogen and ammonia had significantly higher carbon emission values than conventional fuels.
In the case of ammonia and hydrogen, which have recently been evaluated as carbon-free fuels, the actual greenhouse gas emssion increases during fossil fuel-based production. Therefore, in order to use hydrogen and ammonia as true carbon-free fuels, the energy input during production must be without carbon emissions, i.e., from renewable energy sources.
Author Contributions
Conceptualization, S. H. Jung and J. M. Cheon; Writing—Review & Editing, S. H. Jung, S. W. Kim, and J. H. Kim; Visualization, J. M. Cheon.
References
- The Ministry of foreign affair, Division of Climate strategy, https://www.mofa.go.kr/www/brd/m_4080/view.do?seq=370841, 12, 2020.
- EU, IMO ISWG-GHG 9/2 Introducing lifecycle guidelines to estimate well-to-wake greenhouse gas (GHG) emissions of sustainable alternative fuels to incentivize their uptake at global level.
- J. K. Lim, A study on the IMO’s Market-based Measures for mitigating GHG Emission from ships: Perspectives of Governance and sustainability.
- IMO, 4TH IMO Greenhouse gas Study, p. 26, 2021.
- IMO, 4TH IMO Greenhouse gas Study, p. 23, 2021.
- S. J. Choi, A Study on the Greenhouse Gas emission from Ships in KOREA, p. 4, 2010.
- S. T. Kim, A study on economic efficiency of MR Tanker using Liquefied natural gas fuelled propulsion system, p. 46, 2015.
- S. J. Choi, A Study on the Greenhouse Gas emission from Ships in KOREA, p. 3, 2010.
- EUROPEAN COMMISSION, REGULATION OF THE EUROPEAN PARLIAMENT AND OF THE COUNCIL on the use of renewable and low-carbon fuels in maritime transport and amending, ANNEX. II.


