Local structural stability evaluation using model reduction
Copyright © The Korean Society of Marine Engineering
This is an Open Access article distributed under the terms of the Creative Commons Attribution Non-Commercial License (http://creativecommons.org/licenses/by-nc/3.0), which permits unrestricted non-commercial use, distribution, and reproduction in any medium, provided the original work is properly cited.
Abstract
Herein, a practical method is proposed to evaluate the local stability of large-size structures by combining two methods: direct evaluation and model reduction. The local stability of structures can be evaluated using a direct evaluation method that investigates the second variation of the local strain energy via nonlinear finite element (FE) analysis. For FE solutions with large degrees of freedom, the computational efficiency is improved significantly by applying the model reduction method. This combined method offers three primary advantages. First, it can be applied to any arbitrary part of a general structure. Second, it accounts for complicated interactions between local and global structures. Finally, it can be used easily by engineers in industries to reduce the computational cost. The effectiveness of the evaluation methodology is presented based on two numerical examples.
Keywords:
Local stability, Strain energy variation, Nonlinear finite element analysis, Model reduction, Buckling1. Introduction
Steel is typically used in civil, ship, and offshore structures. Steel can be used to design thin-walled structures because it is characterized by high strength and toughness. However, these characteristics are likely to cause local structural failures, primarily due to buckling. Structural instability, such as buckling, is a very dangerous phenomenon in terms of structural safety.
Buckling refers to the stability loss of a component structure. Figure 1 shows various local parts of structures (or local structures), for which local buckling is considered in the structural design. When local buckling occurs, excessive local deformation occurs, and the entire load resistance can be reduced significantly. Progressive local buckling results in the global failure of the structure.
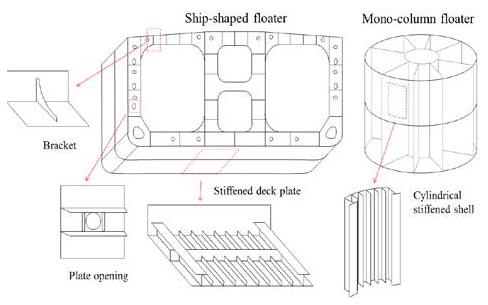
Typical local structures in thin-walled ship and offshore structures: stiffened panels, cylindrical shells, brackets, and opening structures
The design standards for determining the resistance capacity of local structures involve the use of the design formula for buckling and ultimate strengths, which are specified in Codes and Rules [1]-[12]. Problems arise when the local structure is of a non-typical shape that is not predefined in the formula. In this case, the geometry shape and load pattern of the local structure are idealized to a pre-defined evaluation category in the design formula [2][3]. However, this approach can significantly reduce the reliability of the formula. Further investigations into the arbitrary shape of local structures are essential to accurately predict the critical load of local buckling. To evaluate any arbitrary geometric shapes, a numerical evaluation method using the nonlinear finite element method, which can be applied to any shape without limitation, is typically recommended [13].
Kim and Kim [14] calculated the elastic buckling load of double-walled bellows for dual-fuel engines through finite element (FE) analysis and confirmed that local buckling did not occur until the design pressure. Kim et al. [15] evaluated the safety of a slender cantilever-type helideck structure via nonlinear FE analysis and defined the inelastic buckling load as the corresponding external load when a plastic strain of 0.2% occurred.
FE analysis is extensively performed to evaluate the stability of various engineering problems for thin-walled and frame steel structures However, the resistance capacity of local structures is difficult to distinguish because the local structures are included in a global structure with complicated interactions for a large structure. Hence, Zi et al. (2017) separated local behavior from global behaviors and evaluated the stability only for the local structure via nonlinear FE analysis [16]. The energy criterion of the local structure was investigated to evaluate its structural stability. As an extension of this method, Oh et al. [17] proposed an adoptable method to directly evaluate the local stability of structures. This method can fully consider complicated interactions between local and global structures without requiring local FE analysis. However, for an FE model with a large degree of freedom, considerable computational resources are required owing to the iterative solving involved to obtain nonlinear solutions.
As a cost-effective FE analysis procedure, Oh et al. [18] proposed an enhanced computational method using model reduction for large floating offshore structures with nonlinear structural behavior. The static condensation technique developed from the Guyan model reduction method was used [19]. The time required to compute forces on the local structures with nonlinear behavior was effectively reduced compared with that required in a nonlinear analysis involving a full FE model.
In this paper, a practical method is proposed to evaluate local buckling by combining two methods reported previously [17][18]. The critical point at which the local structure loses its stability is explicitly determined, and its resistance capacity is quantified using the direct evaluation method. The computational efficiency is improved significantly by applying the model reduction method to an FE model with a significant number of degrees of freedom. The practicability of the proposed method is presented based on two examples: a horizontally stiffened cylindrical shell structure with radial bulkheads, and a bracket girder in the column–pontoon connection structure of the tension leg platform. The evaluation involves a nonlinear finite element analysis based on the Newton–Raphson method or the arc-length method [20].
The proposed method offers three primary advantages:
- • First, the method can be applied to any arbitrary part of general structures.
- • Second, the complicated interactions between local and global structures ware fully considered without requiring local FE analysis.
- • Finally, engineers in the industry can use this method easily to reduce computational costs.
In Section 2, structural stability is briefly reviewed, and the formulation used in the proposed method is presented. In Section 3, the performance of the proposed method is verified based on two numerical examples, and the computational efficiency of the model reduction is analyzed. Finally, the conclusions are presented in Section 4.
2. Theoretical Formulation
2.1 Variation criterion for stable state
Structural stability refers to the phenomenon in which a structure returns to an equilibrium state when an external displacement disturbance is applied to the structure under this equilibrium state. To maintain a structurally stable state, the potential energy at the equilibrium state must be minimum [21].
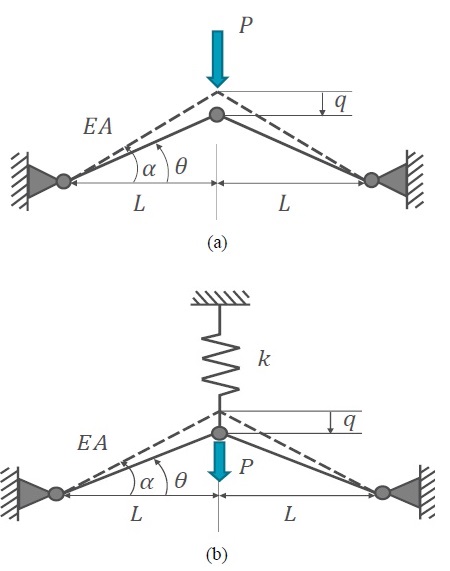
An example of abrupt snap-buckling is introduced to assess the structural instability, as shown in Figure 2(a). Figure 2(b) illustrates a truss beam with a spring that simplifies the adjacent structures. The overall behavior changes without snap-buckling if an additional structure is attached.
In the equilibrium state, the potential energy of Π is always constant. If Π is a continuous derivative, then the function of Π may be expanded into a Taylor series with second-order variations in the equilibrium state, as follows:
| (1) |
with
where δqi is the small variation in the i-th generalized displacement from the equilibrium state at a constant load; δΠ and δ2Π are the first and second variations of the potential energy, respectively.
The conditions of equilibrium are as follows:
| (2a) |
| (2b) |
According to the Lagrange–Dirichlet theorem, the equilibrium state is stable under a constant load if the following condition holds:
| (3) |
The potential energy is calculated as follows to obtain the variation criterion for satisfying the stable state of the snap-through problem shown in Figure 2(a):
| (4) |
where E , ε , L , and A are the Young’s modulus, strain, length, and section area of the truss member, respectively; α is the initial angle; θ is the applied angle; P is the applied load; q is the applied vertical displacement.
To determine whether the equilibrium state is stable, the second-order derivative of Π is calculated as follows:
| (5) |
The truss is stable if the expression above yields a positive number, i.e.,
Subsequently, the following condition is yielded:
| (6) |
By adding rigidity to the structure exhibiting snap-through, the change in snap-through can be investigated. Figure 2(b) shows a case where a grounded spring is added to the load application point. Considering the case of a spring in the direction of the load, the potential energy with vertical stiffness can be obtained as follows:
| (7) |
where K is the additional grounded spring stiffness.
To determine the stability of the equilibrium states, the secondorder derivative of Π is calculated as follows:
| (8) |
The truss is stable if the expression above yields a positive number, i.e.,
Subsequently, the following condition is yielded:
| (9) |
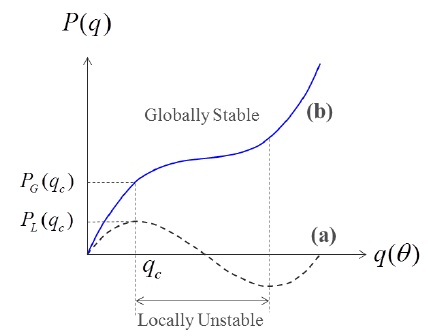
The stability of the entire structure depends on the stiffness of the spring attached to the truss structure, as shown in Figure 3. A global load PG(qi) is applied when the displacement is qi , and the local load PL (qi) of a part of the local structure is imposed. It was observed that the global load and displacement were correlated nonlinearly. The truss structure with zero spring stiffness exhibits snap buckling after the load reaches the critical load, PL (qc) , as shown in curve (a). However, the entire structure may be in a stable state when the adjacent structure is relatively stiff, as shown in curve (b). In other words, even if the entire structure is stable, the local structure may already be losing stability. If additional external loads are applied, then the local deformation may increase rapidly. By investigating the second variation of the potential energy of the local structure, the time at which the local structure loses stability can be identified.
When the load is constant, the formulation of the second variation of the potential energy can be simplified to a second variation of the strain energy [16]. For practical purposes, it can be assumed that no load change occurs due to the small external displacement disturbances. When this assumption is applied, the term of the second-order work pertaining to the constant load (P) is absent in Equations (5) and (8). Therefore, when the second variation of the strain energy stored in the structures is from positive to negative, the structure loses stability. This is the energy criterion for evaluating the stability of structures. The structural resistance can be defined as the maximum load level within the stable load range obtained from the stability evaluation.
2.2 Direct evaluation procedure via FE analysis
The stability of the structure can be easily evaluated via nonlinear FE analysis. The energy criterion for the target structure is applied using the incremental strain energy value at each analysis step while incrementing the load or displacement. If the analysis is performed at sufficiently small intervals, then the instant-losing stability can be precisely determined. In the equilibrium state, the second variation of the strain energy becomes the second-order term of the incremental external work, based on the law of energy conservation. Depending on preference, the second-order term of the incremental external work can be evaluated as an energy criterion for stability evaluation.
Therefore, if δ2Wi > 0 , a stable state is achieved when
| (10) |
where δfi and δui are the first variations of the force and displacement distributions along the boundary of the local structure, respectively; Δfi and Δui are the incremental force and displacement distribution obtained directly from the results of the nonlinear FE analysis, respectively; subscript i refers to the i-th analysis step.
This method is effective for evaluating the stability of elastic structures; furthermore, it is applicable to inelastic structures based on the assumption that they are tangentially equivalent elastic structures during each small loading step. In other words, the structural stability of the material can be evaluated while considering its plasticity.
Additionally, in this method, initial fabrication imperfections are applied to the target structure in the elastic buckling mode, which occurs easily in the load configuration considered. By applying the initial imperfections, incremental displacement disturbances corresponding to the intended specific load paths induce predominant instability in the structure. This method does not incur a long calculation time because it does not consider all possible displacement disturbances and only reflects the displacement disturbances corresponding to a specific load.
In the direct evaluation procedure [17], the buckling failure of a local structure is directly evaluated from solutions of the global nonlinear FE analysis. Let us consider a global structure with a target local structure, as shown in Figure 4. The direct evaluation method can be summarized as follows:
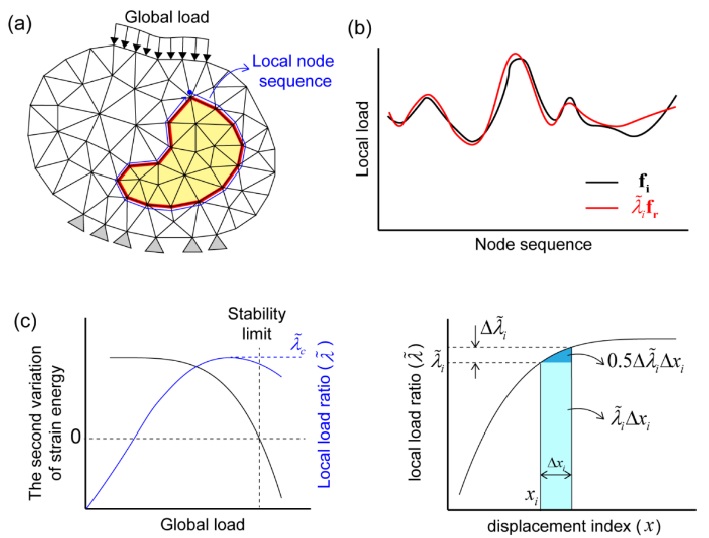
Finite element models and local load ratio: (a) FE model of global structure; (b) local load distribution and its approximation; (c) second variation of strain energy, local load ratio, and displacement index
(Step 1) To evaluate the stability of the local structure, the effective load component of the local structure must be defined. The internal load distribution at the boundary of the local structure is extracted when an external load is applied to the global structure. The load distribution at the boundary of the local structure while the external is increased is denoted as fi. The reference load of the local structure is introduced fr as a unit for measuring the magnitude of the local load distribution.
An FE model for the global structure was constructed, as shown in Figure 4(a). Nonlinear incremental FE analysis was performed on the global structure. The external load was imposed incrementally with load steps i =1, 2, 3, …… First, the reference interface force distribution fr (i.e., force distribution along the boundary of the local structure), which is selected from the results of the early load step within the linear response stage, is obtained. Subsequently, the interface force fi is identified at each load step, as shown in Figure 4(b).
(Step 2) In this step, a single scalar value that represents the interface force level is identified. Because the force distribution varies depending on the external load level, the interface force fi is approximated at load step i using the reference force distribution .
For the typical shapes of local structures, the applied and reference load distributions on the loaded area are typically converted into single scalar loads by averaging or integrating the load distributions, and the ratio of these scalar loads is calculated as the local load ratio. However, this method is not effective for an arbitrarily shaped local structure because the averaged or summed value may be zero even if significant loads exist when the signs of the nodal loads are different.
The present approximation method is proposed to overcome this problem in arbitrarily shaped local structures. The local load ratio () was derived using the least-squares fitting method. The sum squared error function (φi) of the local load is expressed as follows.
| (11) |
The local load ratio () is calculated such that the error function (φi) has a minimum value, and this is known as the approximated load method.
| (12) |
For comparison, another measure, i.e., the local load ratio (), was used. It is defined as the ratio of the norm values (magnitudes) of the critical local load and reference local load as follows, and this is known as the norm value method:
| (13) |
Because the translational and rotational degrees of freedom have different unit systems, it is inappropriate to calculate them simultaneously in Equations (12) and (13). Therefore, only the translational degrees of freedom of the nodal load components were considered in both methods to calculate the local load ratio. The contribution of the rotational degrees of freedom to the strain energy was not considered, as they are negligible in most numerical problems.
(Step 3) The critical state, i.e., the stability limit, is determined. The stability limit is determined by the load level at which the sign of the second variation of the strain energy shifts from positive to negative at each analysis step, as shown in Figure 4(c). The highest local load ratio within a stable load range is selected as the critical local load ratio . The stability of the structure can be evaluated by the second variation of the strain energy, which is obtained from the second-order term of the incremental external work (0.5Δfi ⋅ Δui).
The displacement index was introduced to investigate tendencies such as the severity of deformation at a specific load step. The correlation curve between the local load ratio and the displacement index was derived from the strain energy at each step. The scalar value of the incremental displacement index (Δxi) is calculated as follows:
| (14) |
in which i Δ is the incremental local load ratio.
(Step 4) The usage factor () is calculated as follows:
| (15) |
in which is the load factor corresponding to the service load.
The local safety factor (LSF) with an inverse form of the usage factor was proposed as a measure of safety in the structural design. A higher safety factor implies a safer local structure.
| (16) |
The safety factor, characterized by the ratio of the load levels, is used to accurately evaluate the residual buckling strength of the local structure in a more rational manner.
2.3 Applicability of model reduction method
In general, the FE model of a global structure has many degrees of freedom, as compared with that of the local structure. In this case, from a computational cost perspective, it is useful to condense the stiffness for the degrees of freedom except for the region of interest using the model reduction method [18], and proceed to perform the nonlinear analysis only for the region of interest, as shown in Figure 5. A condensed stiffness is linear and does not require nonlinear iterations at each time; therefore, the computational cost can be reduced significantly.
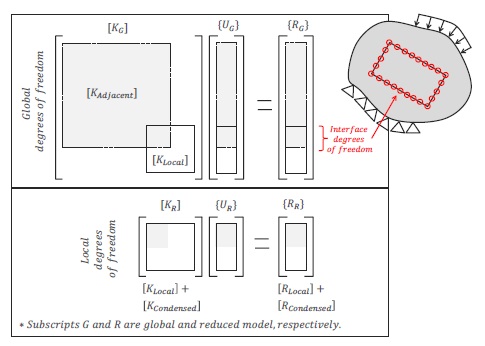
Schematic illustration of model reduction method with static condensation for evaluation of local structural stability
Next, the derivation for the static condensation technique is presented briefly. The relationship between the displacements and loads in static equilibrium is expressed as follows:
| (17) |
where [K] is the stiffness matrix; {U} is the displacement vector; {R} is the load vector; subscripts 1 and 2 denote the slave (removed) and master (residual) degrees of freedom, respectively.
The expression for {U2} can be written as follows:
| (18) |
Finally, the stiffness matrix [] and load vector {} are derived based on the residual degrees of freedom of {U2}, as follows:
| (19a) |
| (19b) |
3. Numerical Examples
3.1 Horizontally stiffened cylindrical structure with radial bulkheads
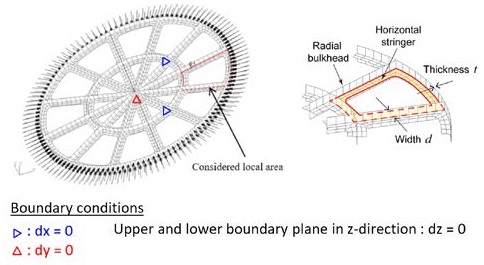
In the mono-column-type structure, a stringer structure is designed between the radial bulkhead and the cylindrical shell to resist the external pressure load, as shown in Figure 6. To investigate the behavior of the internal members of the cylindrical structure, a simplified and reduced-size model considering the local stringer area was established, as shown in Figure 7.
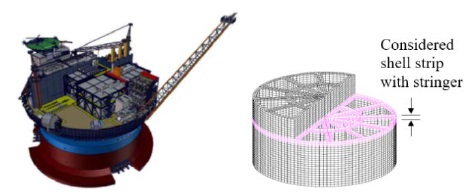
Mono-column FPSO for North Sea field [22] and inner view of cylindrical shell and radial bulkhead with horizontal stringer in simplified model
An overall diameter of 2.0 m was considered in the FE model. The width and thickness of the stringer were 0.05 and 0.01 m, respectively. Buckling mode analysis was performed to apply an initial imperfection. The model geometry was modified to fit the first mode shape with a maximum imperfection of 2.5 mm. The main loads were the external uniform pressure loads. The reference (service) load was defined as 1 MPa, and the applied load was 100 MPa, corresponding to 100 times the reference load, with a load increment step of 1 MPa. To account for the force equilibrium, boundary conditions were considered to avoid rigid body motions. Four node-shell elements were used in the FE models. The material properties of high-tensile steel were applied (yield stress = 355 MPa, Young’s modulus = 210 GPa, and Poisson’s ratio = 0.3). A perfectly plastic stress–strain relationship without stress hardening was assumed for the material nonlinearity.
The nonlinear analysis solution converged within a load of 10.76 MPa, which was 10.76 times the reference load of 1 MPa, as shown in Figure 8. The structure was stable until the global load of 10.76 MPa because the sign of the second variation of the strain energy was positive. Figure 9 shows the maximum local load ratio, which was 10.23 times the local load, for the approximated load method in the stable range. In the norm value method, however, the local load ratio increased steadily and was overestimated compared with the approximated load method after the local load ratio of 9.0.
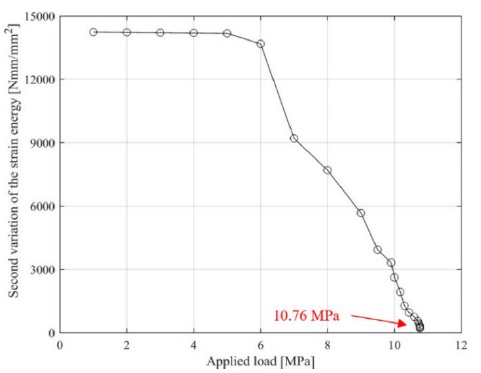
Second variation of strain energy in local domain of horizontally stiffened cylindrical structure with radial bulkheads
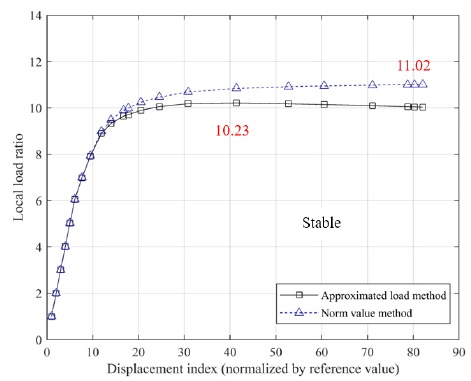
Local load ratio–displacement index curve of horizontally stiffened cylindrical structure with radial bulkheads
The structural stability was evaluated by applying the model reduction method to the local stringer part considered. To improve the accuracy of the analysis result, two cases were evaluated for different ranges of the nonlinear analysis. One was the stringer region of interest, and the other was the extended range of the stringer with adjacent bulkheads. The stiffness of all areas, except the selected area, was condensed. The model reduction method uses both the stiffness of the region of interest and the condensed stiffness of the other region. Additionally, the structural stability was evaluated by applying a linear increment of the initial prescribed displacement. The prescribed displacement analysis method only uses the stiffness of the region of interest. Subsequently, the results of the model reduction and prescribed displacement cases were compared with the results of full-domain analysis.
The detailed procedure for the prescribed displacement case is as follows. First, a linear FE analysis was performed for the global structure. The displacement distribution along the interface between the local and global structures (or the boundary of the local structure) can be found. The interface displacement distribution is represented by a nodal displacement vector u. Subsequently, the FE model is conducted only for the local structure, and the prescribed displacement λu with a factor λ is applied. It is noteworthy that the displacement distribution varies depending on the load level in the global structure; however, it is assumed that the distribution does not change. By increasing the displacement factor representing the magnitude of the prescribed displacement, a nonlinear incremental FE analysis was performed. Subsequently, Steps 2 to 4 in Section 2.2 were performed out.
As shown in Figure 10, the nonlinear analysis was performed only on the stringer region of interest while model reduction was performed in the other regions. In addition, the analysis was performed by incrementing the prescribed displacement at the initial reference load application. Figure 11 shows an extended nonlinear analysis domain with an extended model reduction.

Nonlinear analysis domain of stringer of horizontally stiffened cylindrical structure with radial bulkheads for model reduction and prescribed displacement analysis
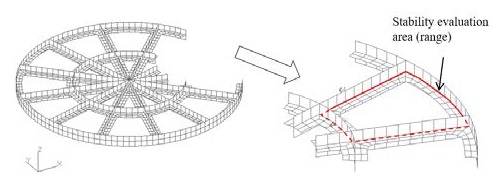
Nonlinear analysis domain of extended stringer of horizontally stiffened cylindrical structure with radial bulkheads for extended model reduction
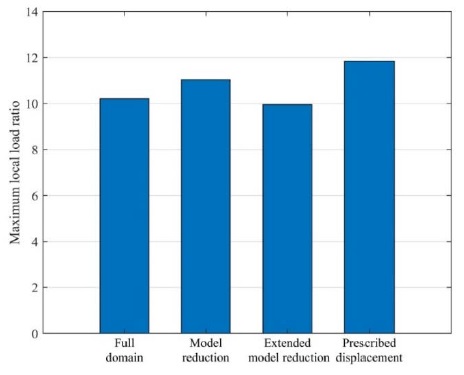
The stability limits for the local strain energies for the model reduction, extended model reduction, and prescribed displacement cases were determined based on the sign of the second variation of the local strain energy. Figure 12 shows the local load ratio–displacement index curve for the full model analysis, model reduction analysis, and prescribed displacement analysis using the approximated load method. The local safety factors are listed in Table 1 and Figure 13. Considering the result of the full model analysis as a reference value, the difference in the model reduction result was calculated to be 8%; however, in the extended model reduction case, it was reduced to -3%. The difference in the prescribed displacement analysis result was calculated to be 16%; this was attributed to the prescribed displacement constraint of the local structure, which resulted in a greater stability as compared with the actual capacity. Based on comparing the results, it was found that the extended model reduction was the best method among those investigated.
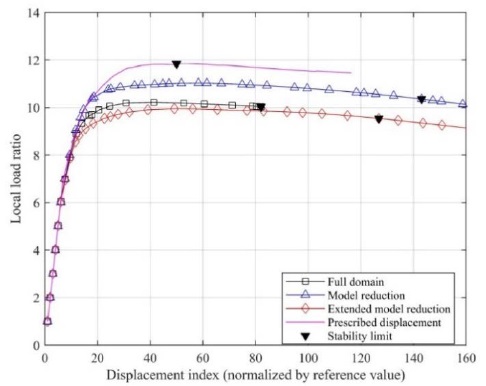
Local load ratio–displacement index curve of horizontally stiffened cylindrical structure with radial bulkheads.
3.2 Bracket girder in column–pontoon connection structure of tension leg platform
The local bracket girder structure in the tension leg platform (TLP) hull, which has a non-typical geometry that is not applicable to the conventional design formula, is presented as another example herein. The TLP is a vertically moored floating structure for deep water, as shown in Figure 14. The structural model for the column–pontoon connection evaluated in a previous study [17] was used, and further evaluation using the model reduction method was conducted in this study. The horizontal pontoon is typically connected to the vertical column, which is locally reinforced by a stiffener and a bracket girder, as shown in Figure 15.
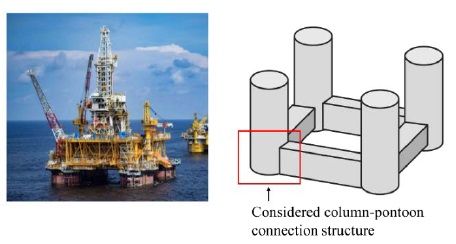
TLP installed in West Africa field [23] and schematic illustration of TLP hull with column and pontoon structures
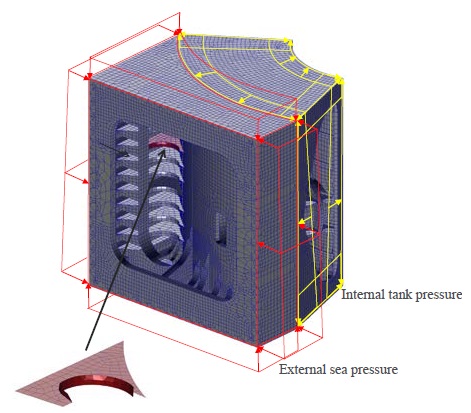
Finite element model and applied loads of bracket girder in column–pontoon connection structure of tension leg platform
The initial imperfection of the bracket girder was assumed to be 3.5 mm in the vertical direction, and the geometry of the FE model was modified to the lowest local mode shape. The inner tank and external water head pressure were defined as the global reference (service) load. The structural stability of the local bracket girder structure was evaluated by linearly increasing the global reference load on the column–pontoon connection structure.
Three and four node-shell elements were used in the FE models. The material properties of high-tensile steel were used (yield stress = 355 MPa, Young’s modulus = 210 GPa, and Poisson’s ratio = 0.3). A perfectly plastic stress–strain relationship without stress hardening was assumed for the material nonlinearity.
Because the sign of the second variation of the strain energy was positive, the structure was stable until the external load was 3.5 times the reference (service) load, as shown in Figure 16. As shown by the local load ratio–displacement index curve, the highest local load ratio was 3.25 when the approximated load method was used. However, the result of stability verification indicated that the local load ratio of 3.22 was the stable state limit, which is the representative critical local load ratio, as shown in Figure 17. The first instability local load ratio based on the norm value method was 3.31,
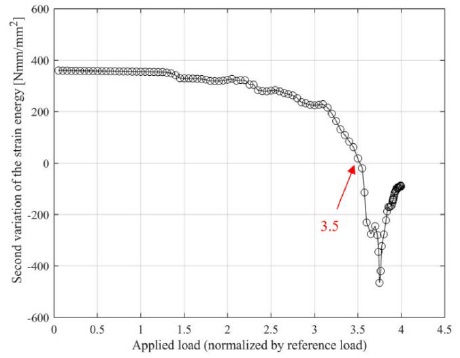
Second variation of strain energy in local domain of bracket girder in column–pontoon connection structure of tension leg platform [17]
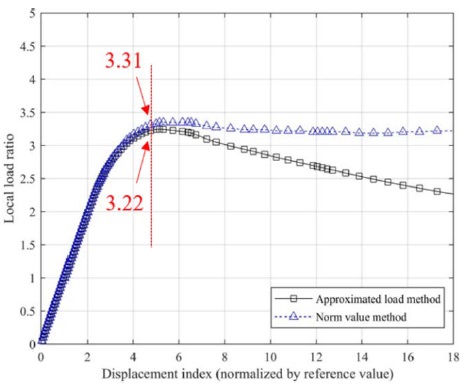
Local load–displacement index curve of bracket girder in column–pontoon connection structure of tension leg platform
which is 2.8% higher than that obtained using the approximated load method. After the stable state limit, the local load ratio by the norm value method did not decrease significantly as compared with the approximated method.
The structural stability was evaluated by applying a model reduction method for the local bracket girder. As shown in Figure 18, nonlinear analysis was performed only on the region of interest in the bracket girder. Two analysis cases were investigated, namely, the model reduction of the remaining regions, and the prescribed displacement increment based on the reference displacement. Figure 19 shows the extended nonlinear analysis domain for the extended model reduction.
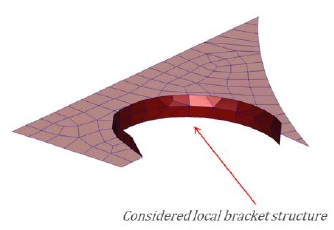
Nonlinear analysis domain of bracket girder in column–pontoon connection structure of tension leg platform for model reduction and prescribed displacement
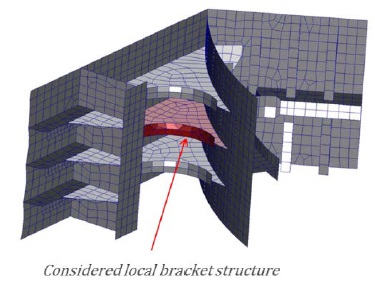
Nonlinear analysis domain of extended bracket girder structure in column–pontoon connection structure of tension leg platform for extended model reduction
Figure 20 shows the local load ratio–displacement index curve for the full model analysis, model reduction analysis, and prescribed displacement analysis. The LSF values obtained using the approximated load method are listed in Table 2 and Figure 21. Considering the result of the full model analysis as a reference value, the difference in the model reduction result was calculated to be 12%; however, for the extended model reduction, it reduced to -6%. The difference in the prescribed displacement analysis result was 4%, which was the lowest. However, an unrealistic result was obtained, where the structure became stable in the next step immediately after the first instability of the local structure occurred in the prescribed displacement analysis case. It was found that the prescribed displacement analysis may yield unstable results, and that the calculated critical local load ratio was low compared with the maximum local load ratio shown in Figures 20 and 21. Therefore, the extended model reduction provided more reliable results among the reduced analysis cases.
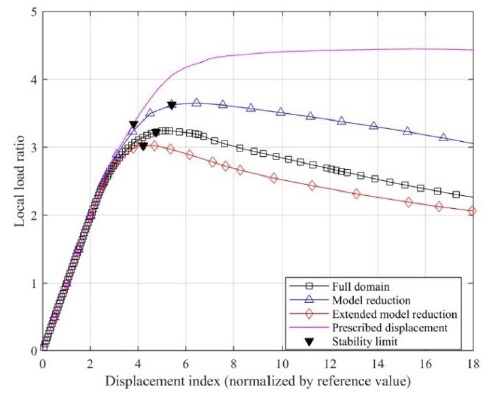
Local load ratio–displacement index curve of bracket girder in column–pontoon connection structure of tension leg platform

Local safety factors (LSF) of bracket girder in column–pontoon connection structure of tension leg platform.
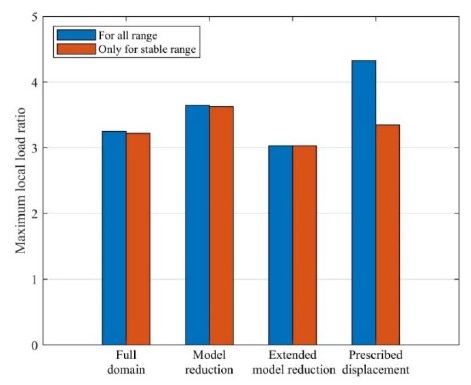
Maximum local load ratios of bracket girder in column–pontoon connection structure of tension leg platform
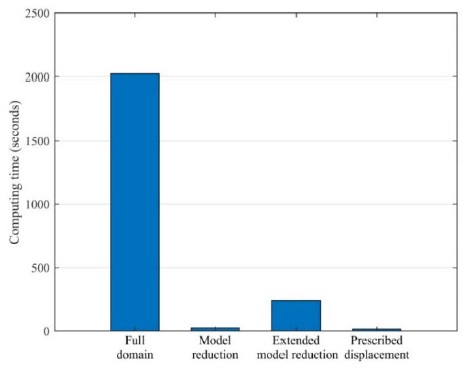
The computing efficiency was verified for this example, which involved a large degree of freedom. The required computing time was measured for each evaluation method, i.e., model reduction and prescribed displacement. The former evaluation method required a certain amount of time to perform static condensation. As shown in Table 2, the extended model reduction method provided the most reliable result among the reduced domain methods, except for the prescribed displacement case. In addition, the time required for the analysis of the local region reduced to 11.9% (= 240/2,023) compared with the full domain, as shown in Table 3 and Figure 22.

Computing costs of evaluation domains for bracket girder in column–pontoon connection structure of tension leg platform
4. Conclusion
The local structure of ships and offshore structures has changed from a typical detailed design in the past to various shapes by location. Therefore, the area to evaluate the stability of the local structure has expanded and necessitates considerable computing resources.
By applying the proposed method, the instability of the local structure can be explicitly identified, and the local resistance capacity can be precisely quantified based on the LSF. For large FE models, the analysis time can be reduced using the model reduction method, which allows nonlinear iterative solving to be performed only for the local structure. Reliability and computational efficiency were investigated, and it was found that the extended model reduction method yielded the best solution.
In future studies, the proposed evaluation method will be applied to demonstrate the strength of the local structures of various arbitrarily shaped ships and offshore structures. In addition, how to determine the extended analysis region in the extended model reduction method will be further investigated to increase reliability.
Acknowledgments
This paper is written based on my doctoral dissertation thesis (A practical method for evaluating stability of local structures using strain energy variation, Korea Advanced Institute of Science and Technology).
Author Contributions
Conceptualization, M. H. Oh; Methodology, M. H. Oh; Software, M. H. Oh; Formal Analysis, M. H. Oh; Investigation, M. H. Oh; Resources, M. H. Oh; Data Curation, M. H. Oh; Writing-Original Draft Preparation, M. H. Oh; Writing-Review & Editing, M. H. Oh; Visualization, M. H. Oh; Supervision, M. H. Oh; Project Administration, M. H. Oh; Funding Acquisition, M. H. Oh.
References
- DNVGL, DNVGL-CG-0128, Class Guideline: Buckling, 2015.
- DNVGL, DNVGL-RU-SHIP Pt.3 Ch.8, Rules for Classification: Buckling, 2018.
- BV, Rule Note NI 615 DT R02 E, Buckling Assessment of Plated Structures; Paris, France, 2018.
- AISC, ANSI/AISC 360-16. An American National Standard: Specification for Structural Steel Buildings, Chicago, U.S.A, 2016.
- API, RP 2A-WSD. Recommended Practice for Planning, Designing and Constructing Fixed Offshore Platforms-Working Stress Design, Washington, U.S.A, 2014.
- DNVGL, DNVGL-RP-C202. Recommended Practice: Buckling Strength of Shells, 2017.
- DNV, DNV-RP-C201. Recommended Practice: Buckling Strength of Plated Structures, 2010.
- ABS, Guide for Buckling and Ultimate Strength Assessment for Offshore Structures, New York, U.S.A, 2018.
- ABS, Guide for Building and Classing: Floating Offshore Liquefied Gas Terminals, New York, U.S.A, 2012.
- BV, Rule Note NR 622: Structural Assessment of Independent Tanks and Supports for Asphalt Carriers, Paris, France, 2015.
- DNV, Classification Notes 31.12. Strength Analysis of Liquefied Gas Carriers with Independent Type B Prismatic Tanks, 2013.
- LR, Guidance Notes for Liquefied Gas Carriers Adopting IMO Type B Independent Tanks Primarily Constructed of Plane Surfaces, London, U.K, 2012.
- DNVGL, DNVGL-RP-C208. Recommended Practice: Determination of Structural Capacity by Non-linear Finite Element Analysis Methods, 2016.
-
P. -S. Kim and J. -D. Kim, “A study on the optimization of manufacturing processes of double wall bellows for dual fuel engine: Design optimization by buckling and stress analysis,” Journal of the Korean Society of Marine Engineering, vol. 40, no. 6, pp. 499-503, 2016 (in Korean).
[https://doi.org/10.5916/jkosme.2016.40.6.499]

-
B. -M. Kim, J. -J. Leem, and S. -H. Ha, “Safety evaluation of a cantilever-type helideck under nonlinear buckling,” Journal of the Korean Society of Marine Engineering, vol. 42, no. 3, pp. 203-209, 2018 (in Korean).
[https://doi.org/10.5916/jkosme.2018.42.3.203]

- G. Zi, H. -H. Kim, J. -Y. Ahn, and M. -H. Oh, “Evaluation of buckling strength of non-structured plates by using the deformation energy”, Journal of the Korea Institute for Structural Maintenance and Inspection, vol. 21, no. 3, pp. 102-113, 2017 (in Korean).
- M. -H. Oh, H. -J. Kim, K. Yoon, and P. -S. Lee, “Direct evaluation of the local stability of structures using nonlinear FE solutions,” Structural Engineering and Mechanics (Submitted).
- M. -H. Oh, S. -H. Boo, P. -S. Lee, J. -M. Kim, J. -S. Moon, and W. -S. Sim, “Application of the static condensation technique to nonlinear structural analysis of floating offshore structures,” Proceedings of the 36th International Conference on Ocean, Offshore and Arctic Engineering, 25-30 June, 2017.
-
R. Guyan, “Reduction of stiffness and mass matrices,” AIAA Journal, vol. 3, no. 2, pp. 380-380, 1965.
[https://doi.org/10.2514/3.2874]

- MSC Software, MSC Nastran 2018 Quick Reference Guide. Newport Beach, U.S.A, 2018.
- Z. P. Bazant and L. Cedolin, Stability of Structures: Elastic, Inelastic, Fracture, and Damage Theories, New York, U.S.A., Oxford University Press, 1991.
- Y. Lei, S. Chen, L. Wang, and H. Xu, “Global strength analysis of a monocolumn FPSO,” The 28th International Ocean and Polar Engineering Conference, 10-15 June, 2018.
-
E. Blarez, “OTC-28406-MS. Moho Nord, A Complex Integrated Project,” Offshore Technology Conference., 20-23 March, 2018.
[https://doi.org/10.4043/28406-MS]


