A velocity prediction program for an autonomous sailing drone
Copyright © The Korean Society of Marine Engineering
This is an Open Access article distributed under the terms of the Creative Commons Attribution Non-Commercial License (http://creativecommons.org/licenses/by-nc/3.0), which permits unrestricted non-commercial use, distribution, and reproduction in any medium, provided the original work is properly cited.
Abstract
In recent, there has been considerable improvement in ocean awareness owing to the use of autonomous vehicles, which have played an important role in helping engineers, researchers, and scientists in observing the environment and gathering oceanographic data. Therefore, it is useful to predict the speed of these vehicles. Velocity prediction programs (VPPs) are broadly used as tools to predict sailing yachts’ speeds but existing VPPs are unable to implement the new sail design concepts. Therefore, this study aimed to build a VPP for a particular sailing drone model that unitizes the curvy twin sail design. We theoretically derived relations describing a sailing drone’s motion as that of a rigid body having three degrees of freedom (three DOFs). We were interested in the proposed VPP’s dynamic behavior, the effect of sail designs, and the precise prediction of actual attainable speeds. The algorithm and process for predicting the sailing drone speed were established. The sailing drone VPP model was validated via comparison with previous experimental results, and the model achieved an acceptable level. It was also able to help designers evaluate their sail and hull configurations. In addition, we evaluated the utilization of a sailing drone hull and curvy twin sail. The hydrodynamic results indicated that the speed of the designed sailing drone should be limited to 2.2 m/s. Although the maximum lift coefficient of the curvy twin sail was recorded at an angle of attack (AOA) of 25 °, the optimized AOA for the curvy twin sail was found to be 15 °. The curvy twin sail could improve the sailing drone’s speed under downwind conditions at true wind angles above 40 °. In contrast, it did not work effectively compared to wing sails under upwind conditions at true wind angles between 20 ° and 40 °.
Keywords:
Autonomous sailing drone, Velocity prediction, Curvy twin sail, True wind, Angle of attack1. Introduction
The most critical aspect in sailing drone design is precise velocity prediction. The need for aerodynamic and hydrodynamic simulations is growing in sailing-drone designs. Such designs permit the investigation and comparison of prototypes and processes at much lower costs than actual full-scale experiments. The sailing drone obtains its propulsion force by utilizing its sail to absorb wind power. Hence, in a sailing drone, it is essential to optimize the aerodynamic performance of the sail, which transforms wind into a thrust force.
The speed and altitude of a sailing drone are calculated according to wind angles and speed by using essential specifications, such as the lift and drag coefficients of the sail and the hydrodynamic characteristics of the hull. A velocity prediction program (VPP) calculates the balanced forces acting on a sail and hull and predicts the sailing drone's speed. A good performance from sailing drones is still strongly expected even when applying a VPP. Nevertheless, there are certain limitations in predicting the performance of sailing drones that operate using new sail concepts because of differences in their principal specifications and other characteristics.
There is a lack of methods that predict the velocity of sailing yachts carrying hydrofoil sails or other rigid sails. Many VPP commercial software such as WinDesign, AHVPP, and Maxsurf VPP [1][2][3] can describe the behavior of sailing yachts using different methods. Many studies have been conducted previously to obtain a simulation system model for calculating the performance of autonomous sailing yachts. An iterative process used to determine a boat's state specifications, such as its heel angle and speed, under constant wind direction and speed, was carried out by Larsson and Eliasson [4]. Based on their study, the Florida Atlantic University project [5] developed a VPP for single-wing sail and two-wing sails. The IBOAT project [6] suggested a model that relied on dynamic boat assumptions. The relationship between the resultant force and speed was estimated by calculating the dynamic force created by the hull and sail. A six-degree-of-freedom model was proposed in the Avalon project [7]. The forces acting on the sail and rudder were observed, while maintaining an uncomplicated relationship with experimentally determined parameters, to estimate the resistance and damping forces. Four 2 m boats (USNA sailboats 1-4) were designed in USNA projects and appeared in a sailboat competition in an undergraduate academic schematic section [8][9][10]. The first three boats were operated under light wind conditions, while the fourth was reserved for longer journey voyages and stronger winds. Elkaim [11] proposed a simplified state process that applies a limitation on the calculation system by assuming that the rudders cannot move sideways through the water. This leads to a transfer in a triple integrator, which is related to the distance traveled.
Therefore, the main goal of this study was to develop a prediction program for a sailing drone that targets the preliminary design stage of the drone using the curvy twin sail described in our previous study [12]. Due to the high complexity of the program, which requires an aerodynamic and a hydrodynamic understanding of an entire craft and its interaction, we aimed to develop a VPP based on empirical and analytical equations and yield a program with a low computational cost. The hydrodynamic model is based on the Delft Systematic Yacht Hull Series (DSYHS) (Keuning and Sonnenberg, 1998) [13] and the aerodynamic model is based on the Offshore Racing Congress (ORC, 2020) [14]. Once the VPP successfully runs and is validated, the obtained results can help us better understand the new autonomous sailing drone that is assisted by curvy twin sails.
2. Methodology
2.1. Geometry of the autonomous sailing drone
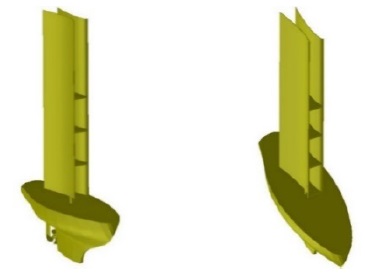
The general specifications of the autonomous sailing drone are shown in Figure 1 and Table 1.
The cross-section geometry of the curvy twin sail is shown in Figure 2 and Table 2. The non-dimensional number for characterizing the flow of the fluid Reynolds number was calculated as follows:
| (1) |
where μair is the viscosity coefficient of air, ρair is the air density, vair is the velocity, and L is the sail chord length. No experiments for the curvy-twin sail were available to validate the numerical results. Therefore, a conventional numerical setting was used for comparison with previous experimental studies for a NACA 0018 airfoil to produce reliable results.
2.2. Procedures
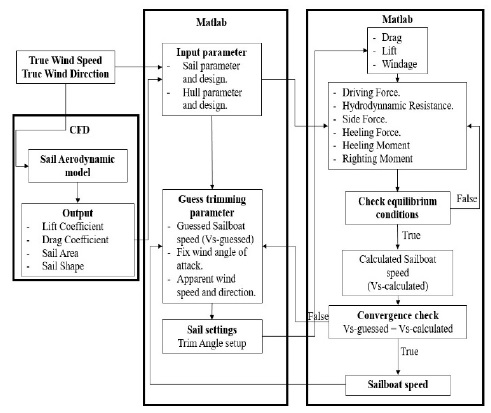
A MATLAB code was used to build a VPP to predict the sailing performance of an autonomous sailing drone. The theory behind a VPP can be obtained from the ORC world leader in rating technology 2020 [14]. The VPP determines the sailing drone speed for a given true wind angle using the iterative process that is shown in Figure 3.
The objective was to determine a sailing drone’s speed at a fixed true wind angle and speed. The process was set into motion by calculating the sail aerodynamics in the CFD model and then exporting the lift and drag coefficients, sail areas, and shapes, which were used as aerodynamic input parameters. Then, the sailing drone’s hydrodynamic input parameters were imported into MATLAB scripts. These included the sailing drone-hull’s geometry and technical data. The true wind direction and speed were then determined. The forces acting on the sail and hull sailing drones were calculated as aerodynamic forces (driving force, heeling force, and heeling moment) and hydrodynamic forces (hydrodynamic resistance, side force, and righting moment). An iterative calculation was performed to ensure that the equilibrium conditions were maintained. The sailing drone speed was estimated by an iterative procedure, which estimated the sailing speed, apparent wind speed, and direction based on the input parameters. The assumed sailing drone speed was updated through each iteration. The apparent wind angle and speed were calculated as functions of the boat speed versus the true wind speed and angle. Convergence was achieved when the absolute value of the difference between the estimated and calculated sailing drone speeds was acceptable.
2.3. Velocity prediction model
By utilizing the three degrees of freedom model, various force equations were considered. Aerodynamic and hydrodynamic models have been implemented; they are being widely applied in many VPPs. The steady-state performance of the sailing drone was predicted because the models only reflect on surge, sway, and roll motions.
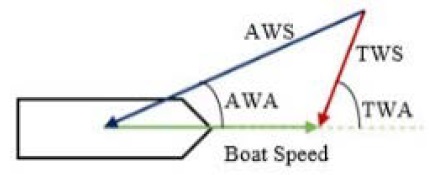
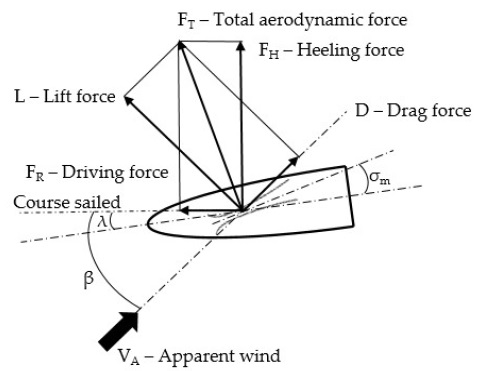
Initially, it is essential to understand that the true wind is the actual wind generated by natural forces. It is forecasted by weather channels and felt by someone who falls when standing at the beach. The velocity of this wind and the angle that its direction makes with the movement of a sailing drone is the so-called true wind speed (TWS) and true wind angle (TWA), respectively. When a body moves against the true wind, there is a relative velocity between them, which is called the apparent wind. The wind speed that the yacht “sees” or someone onboard feels, is the apparent wind speed (AWS), and the angle this wind direction has with the yacht movement is the apparent wind angle (AWA). The following figure represents these concepts.
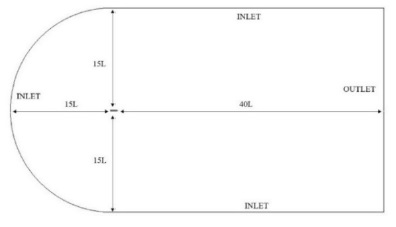
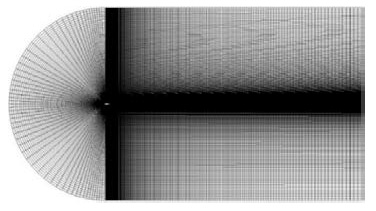
The principal characteristics of the aerodynamic forces generated by the wing sail and curvy twin sail were their lift and drag coefficient calculations. Other researchers have used XFOIL, a commercial software that can investigate the performance of airfoils to resolve these coefficients. In this study, a two-dimensional CFD model using numerical commercial codes was performed to calculate the lift and drag coefficients. Figure 5 illustrates the calculation domain for computational simulation. A semi-circle was used with the upstream boundary. The upstream and downstream boundary sizes were 15 L and 40 L long, respectively. These domain dimensions were sufficiently large enough to satisfy domain-independent results [15]. The angle of attack (AOA) was regulated by rotating the airflow direction. The boundary conditions are presented in Table 3. The boundary conditions on the domain sides were the inlet, while the downstream boundary was the outlet. The velocity at the inlet was set to a uniform flow velocity.
The accuracy of the numerical results was significantly affected by the mesh quality. Various numerical mesh parameters were inspected, and mesh independence calculations were performed by investigating the computed lift coefficient at a fixed AOA of 5°. The acceptable structured mesh form was determined, as shown in Figure 6. 10 – 40 inflation layers were created in the region near the airfoil wall [16][17]. The mesh distribution corresponding to the inflation layer was also improved to obtain accurate results.
The mesh independence test for the lift coefficient of the NACA 0018 at an AOA = 5 °, illustrated in Table 4, included various mesh sizes and a number of inflation layer comparisons. The calculated lift coefficient for the coarsest mesh, 1, was 0.457; this was different from 0.482, the lift coefficient of the most refined mesh, 4. The difference between the lift coefficients acquired by meshes 1 and 4 was approximately 5%, while it was only 0.18% between meshes 3 and 4. Hence, mesh 3 was found acceptable for the present study.
A suitable CFD flow boundary condition and solver had to be determined. In CFD, the governing equations relating to the fluid flow can be used to calculate the flow patterns in a computational environment. The different solutions for a given geometry and physical model significantly determine the characteristics of the obtained solutions. Therefore, it is necessary to set boundary conditions that accurately reflect the actual situation to achieve good results. The direct flow solutions and solutions for the Reynolds Average Navier-Stokes, Euler, and potential governing equations were provided by CFD commercial software that applied a finite volume for spatial discretization. The convergence and robustness of CFD solutions can be improved by using numerical techniques of smoother and structured mesh methods. The solver for the two-dimensional SST governing equations, which expressed the mass conservation, momentum, and energy of a viscous fluid, was used in the numerical analysis [18][19]. It was important to choose the viscous effect for a more accurate flow solution. Table 5 presents the setup of the computational model [20][21][22].
The lift coefficient of the two-dimensional NACA 0018 model was calculated and compared with the experimental results to verify the numerical method. The predicted lift coefficient of NACA 0018 with an AOA ranging from 0 °to 25 °is shown in Figure 7. A comparison with the experimental results [23][24][25], also included in Figure 7, showed that the model was in close agreement with the experimental results. Hence, the SST turbulence model was selected for the simulations.
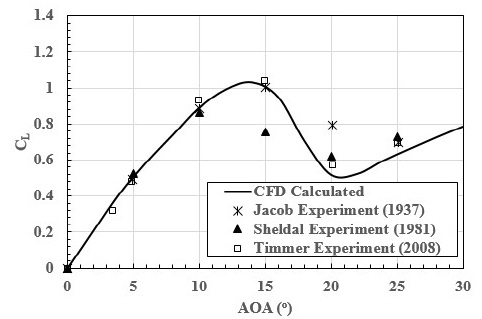
Computed variation of lift coefficient with angle of attack for NACA 0018, compared with experimental measurements
The total aerodynamic force can be divided into two methods. Lift (L) and drag (D) components have been commonly investigated to analyze aerodynamic behaviors. When considering the forces acting on the sails, the driving (FR) and heeling (FH) forces were studied. The relationship between the aerodynamic forces is shown in Figure 8 [4].
| (2) |
| (3) |
The primary purpose is to maximize the driving force and simultaneously minimize the heeling force. When moving under upwind conditions, the contribution of drag is harmful because it increases the heeling force and reduces the driving forces. Under these conditions, maximizing the lift and minimizing the drag are simultaneously required at the same time. As the apparent wind angle increases under upwind conditions, the drag dramatically improves the driving force, while the contribution of the lift gradually decreases.
The essential parameters that must be considered in the aerodynamic forces generated by the sail include the wind gradient, roll velocity, and heel effects. In the VPP developed by Rynne and von Ellenrieder, the wind velocity variation — that depends on the height above the still water line — is mentioned. Their study estimated that the wind velocity for heights between 0 and 10 m varied with height.
According to Larsson and Eliasson’s explanation, the angle of attack and wind velocity, which are affected by heel motions, vary according to the length of the sail. Therefore, they integrated the lift and drag along the wing sail’s length, which accounted for the heel effect. The effect of roll velocity on the apparent wind needed to be assessed. In Rynne and von Ellenrieder’s description [5], the wind speed gradient in the open-ocean condition was estimated using Equation 4, where z is the height in meters above the still water line and U10 is the single hour averaged wind speed at 10 m:
| (4) |
It should be emphasized that U10 estimated the instantaneous wind speed at 10 m. It specifies the immediate wind gradient when balancing the differences between the simulation and measurement data. Moreover, the wind speed measured in a shorter test time using a hand-held sensor or a sensor on a boat will improve the acceptable accuracy.
The effect of roll velocity on the apparent wind was calculated using Equations 5 and 6, where the direction and speed of the apparent wind (βAWφ’ and VAWφ’) are determined. According to De Ridder, Vermeulen, and Keunning [26], the apparent wind affected by the boat’s speed along the x-and y-axes was mapped onto those axes. The impact of the roll was mapped onto the y-axis, and the new apparent wind was calculated.
| (5) |
| (6) |
where Zce is the vertical position of the center of effort, VAW is the apparent wind speed, βAW is the apparent wind angle, and φ’ is the roll velocity.
Larsson and Eliasson succeeded in calculating the heel of the boat, which directly affects the apparent wind angle and effective velocity as seen by the sail. They determined these values by calculating parameters in a plane that heeled with the boat, as shown in Equations 7, 8, 9, and 10:
where V1 is the apparent wind velocity along the direction of motion, V2 is the apparent wind velocity at right angles to the sail and direction of motion, VAWe is the effective apparent wind velocity, βAWe is the effective apparent wind angle, VS is the boat speed, VTW is the true wind velocity, βTW is the true wind angle, and φ is the heel angle.
| (7) |
| (8) |
| (9) |
| (10) |
After achieving the aerodynamic forces generated by the sail, the hydrodynamic forces acting on the hull of the sailing drone must be determined when it reaches a steady state. The hydrodynamic resistances that impact the sailing drone hull can be decomposed into frictional and residual resistances. Larsson and Eliasson performed towing tank tests at the Delft University of Technology [13].
The viscous resistance of a bare hull (Rfh) can be determined using Equation 11, while the friction coefficient (Cf) is defined in Equation 12, as presented by Keuning and Sonnenberg [27]. The forward velocity of a yacht is considered along the x-axis, according to De Ridder, Vermeulen, and Keunning’s explanation.
| (11) |
| (12) |
where ρ is the fluid density, u is the forward velocity, and Sc is the wetted area of the hull at zero speed.
As described by the DSYHS, the viscous resistance of appendages (Rva) includes frictional resistance and “other” viscous effects. The “other” effect can be calculated by using Equation 13 with the form factor (1 + ka):
| (13) |
The frictional resistance of the appendage (Rfa) can be obtained using Equation 14, which describes the hull frictional resistance, while the frictional coefficient can be formulated using Equation 12. Nevertheless, these equations are calculated with the Reynolds number computed using the average chord length of the appendage as an alternative to 70% of the hull waterline. The adapted Reynolds number is given by Equation 15. Eventually, the form factor shown in Equation 13 was determined using Equation 16.
| (14) |
| (15) |
| (16) |
where Sa is the wetted area of the appendage, ca is the appendage average chord length, ν is the kinematic viscosity, and ta is the appendage mean thickness.
Equation 17 describes the residuary-resistance formula. The coefficients a1 to a7 depend on the Froude number and are based on the town tank test of the DSYHS experiments.
| (17) |
where Rrh is the residuary resistance hull, ∇c is the volume of displacement of the canoe body, LCBfpp is the longitudinal position of the center of buoyancy to the forward perpendicular, LCFfpp is the longitudinal position of the center of flotation to the forward perpendicular, Lwl is the length of the waterline, Bwl is the beam of the waterline, Aw is the water area, and Tc is the draft of the canoe body.
3. Results and Discussions
3.1. Lift and drag coefficients
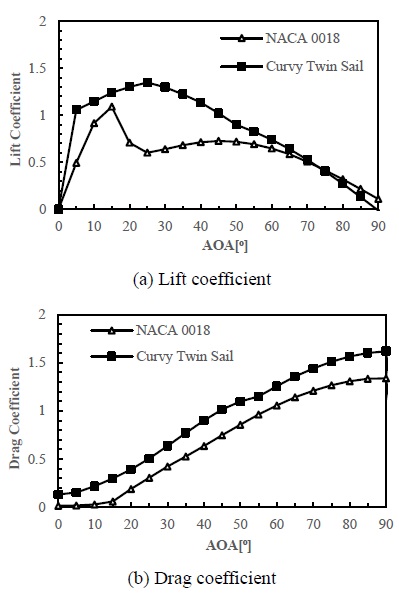
In terms of aerodynamic performance, the lift and drag coefficients must be considered. The calculated lift and drag coefficients of NACA 0018 and the curvy-twin sail are presented in Figure 9. The lift and drag coefficients of the curvy twin sail were superior to those of NACA 0018. The lift coefficient of the curvy twin sails was higher than that of NACA 0018 in the range of an AOA from 0 °to 75 °. The maximum lift coefficient of NACA 0018 founded at an AOA of 15 ° was 1.08, while that of the curvy twin sails was approximately 1.4 at an AOA of approximately 25 °. Although the drag coefficient in a curvy-twin-sail design is higher than that in NACA 0018, the drag contributes significantly to the propulsion force of the sailing drone when operating in downwind conditions.
3.2. Hydrodynamic calculation and validation
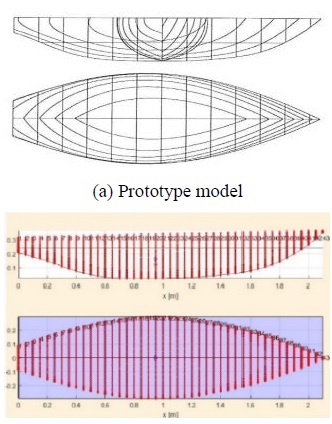
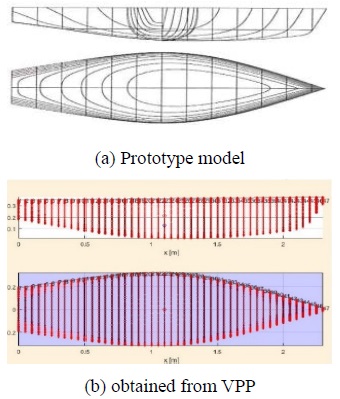
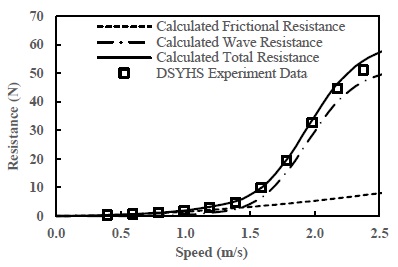
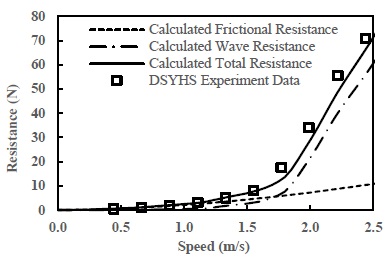
To validate the DSYHS hydrodynamic calculation method, resistance prediction was compared to the actual towing tank data for a known vessel from the DSYHS database. To improve the quality of the validation, suitable hulls were selected among the DSYHS series 1 and 2 parents, as illustrated in Table 6. The DSYHS series 1 and series 2 prototypes obtained from the VPP models are presented in Figures 10 and 11, respectively.
The resistance model proposed by the DSYHS was validated for Series 1 and Series 2 under upright conditions to identify the accuracy and restrictions of the method. All experimental data were retrieved from the DSYHS database.
As a sailboat moves through calm water, many factors combine to form the total resistance force acting on the hull. The principal factors affecting sailboat resistance are divided into frictional resistance, wave resistance, and canoe body residuary resistance due to heel, air resistance, and keel or fin resistance. However, in the upright test for the sailboat hull, the air resistance and keel or fin resistance should be neglected.
The total hull resistances are presented in Figures 12 and 13. The calculation results were close to the experimental values, and the estimation error was less than 10%. Although the results of the calculated predictions were different from the experimental results, it can be agreed that the DSYHS hydrodynamic method can be used for the qualitative reflection of hull characteristics. Obviously, at low speeds, frictional resistance dominates, and at higher speeds over and around 1.5 m/s, the total resistance curve turns upward dramatically as wave resistance begins to dominate. Despite the small disparities, the total resistance curves revealed a good correlation between the experimental data and calculation results.
It must be noted that the DSYHS method cannot provide reliable results if used outside the parameter range of the DSYHS. For the DSYHS to be applicable, the hull of the sailing drone must fit within the range of the parameters covered.
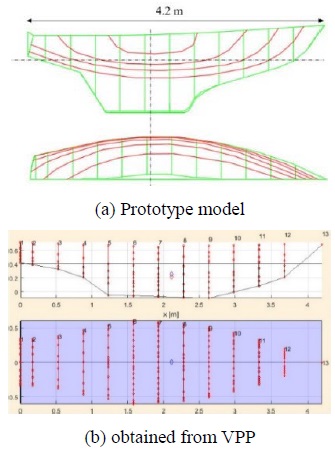
The sailing drone design met all the requirements stated by the DSYHS, and the method can be used in a preliminary estimate of the resistance and side force. A Dragon 2.4 mR mono hull was used for the sailing drone in this study because of its robustness, good quality, and suitable size. Moreover, this hull type has been broadly used, and its product cost is relatively low. To use the DSYHS, the Dragon 2.4 mR parameters need to fit in the DSYHS ranges, as shown in Table 7. The sailing drone hull prototype, obtained from the VPP models, is presented in Figure 14.
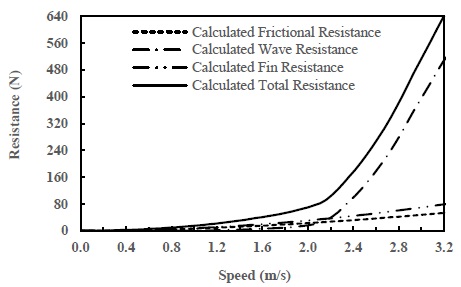
The total hull resistance of the sailing drone is shown in Fig. 15; it increases as the speed increases. The total resistance is a combination of frictional resistance, wave resistance, and fin resistance. Note that the total resistance curve is not linear but grows more sharply in the high-speed range of 2.2 m/s to 3.2 m/s. The wave resistance was more extensive than the frictional resistance at a speed above 2.2 m/s. As the sailing drone speed increased, the height of the waves generated by the sailing drone motion in water increased, and therefore, the energy required to produce waves also increased. More energy was required because of wave creation. The fin or keel structures could improve the balance ability of the sailing drone, but the fin generated additional resistance, which affected the hull performance. The sailing drone speed should be limited to less than 2.2 m/s.
3.3. Sailing drone’s predicted calculation and validation
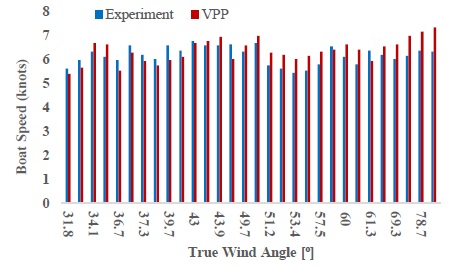
To evaluate the inherent uncertainties of the VPP’s realization and quantify its accuracy, experimental full-size data and velocity prediction were compared. The performance of the Stewart 34 Pride [28], on which this project is focused, has been recorded for upwind sailing in true wind speeds ranging from 9.2 to 13.8 knots to investigate rig tension. As a result, actual sailing data were available. The boat speed, apparent wind angle, and apparent wind speed recorded during the experiment were used to ascertain the true wind speed and true wind angle. The hydrostatics of the Stewart sailboat for particular displacements are listed in Table 8.
A comparison of the boat speeds is presented in Figure 16 in increasing order of the true wind angle. An overall degree of agreement can be observed; the data can be divided into two main categories related to the true wind angle. On the one hand, the VPP slightly underestimates the speed up to 43° of the true wind angle. As the speed in the VPP was theoretical, it would have been expected to be higher than the actual value. However, this could be explained by the windward presence of the crew, providing an additional righting moment and thus, a higher boat speed. Since no crew weight was modeled in the VPP, it is a plausible interpretation. A much larger overestimation of the VPP was exhibited at higher true wind angles. A possible explanation is that the data gathered during the experiment did not aim to capture the highest possible speed. As a result, the full performance of the boat may not have been exploited, resulting in these differences.
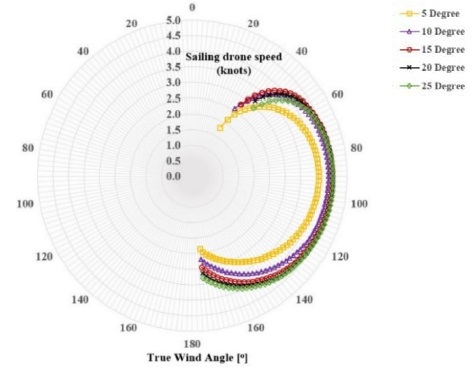
With VPP, speed inspection and analysis were performed with the designed curvy twin sail. The angle of attack was considered as a parameter for evaluating the curvy-twin-sail performance. Figure 17 shows a polar plot of the velocities calculated by the VPP for a true wind speed = 10 knots with an AOA between 5 °and 25 °.
Speeds generally increased with wind angle and wind speed, as expected. Peak speeds were reached at a true wind angle of approximately 100°; the AOA increased, and the curvy twin sail's ability to work under upwind conditions decreased. However, sail efficiency improved under downwind conditions. On the other hand, the autonomous sailing drone's no-go zone with an AOA from 5° to 15° ranged between 0° to 20 °. However, an AOA of 15 °gave the best sailing drone speeds under upwind conditions with true wind angles from 30 °to 60 °. The no-go zone angle increased when the angle of attack increased. As the no-go zone became more extensive, it significantly reduced the efficiency of the sailing drone under upwind conditions. This phenomenon can be attributed to the dramatic increase in the drag coefficient, which mainly contributed to the driving force under downwind conditions.
Therefore, to ensure the working performance of an autonomous sailing drone under upwind conditions and improve its efficiency when working under downwind conditions, an AOA of 15 ° was recommended.
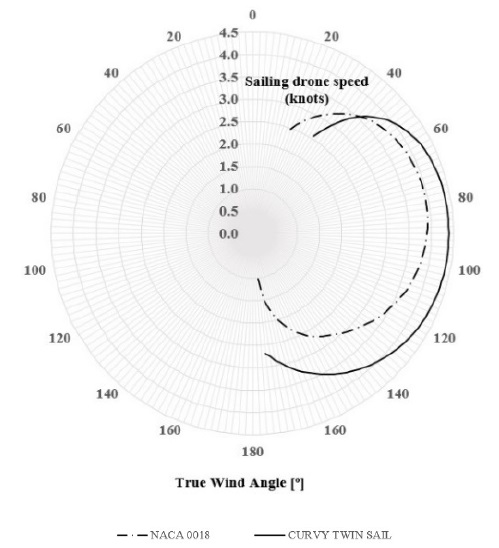
In Figure 18, the performance diagram of the wing sail is compared to that of the curvy twin sail.
The performance characteristics of NACA 0018 and the curvy twin sail were attractive because both of them were always trimmed at a constant AOA of 15 ° to the apparent wind. The velocity generated with the curvy twin sail primarily increased compared to the wing sail at a true wind angle above 40 °. This phenomenon can be attributed to the higher lift and drag coefficients of the curvy-twin sail. However, the wing sail was more useful when the autonomous sailing drone operated under upwind conditions with a true wind angle from 20 ° to 40 °.
4. Conclusions
This study developed an autonomous sailing drone VPP, which was used to aid a designer when making decisions regarding a sail and hull yacht’s configuration. An autonomous sailing drone’s performance was optimized by identifying the optimum value of a set of parameters defining the curvy twin sail with a constant AOA. A dynamic model can be used for controller design and generation of test data. The VPP program can predict the total resistance of an autonomous sailing drone, which helps in considering and developing a hull design.
Hydrodynamic analysis was conducted for the DSYHS sailing yachts model series and the sailing drone design under upright wind conditions. The DSYHS model series experiment and calculated data were investigated to prove that the hydrodynamic model used was reliable. The sailing drone’s hydrodynamic calculation results showed that the total resistance curve was not linear but grew steeply at high speeds ranging from 2.2 m/s to 3.2 m/s. The wave resistance was more considerable than the frictional resistance at speeds above 2.2 m/s. The higher wave resistance required more propulsion energy; so, the sailing drone speed should be limited under 2.2 m/s (4.3 knots).
We performed speed calculations for the Stewart 34 Pride sailing yacht and our sailing drone. The Stewart 34 sailing yacht experimental speed, which corresponded to the true wind speed and angle, was compared with the VPP’s calculation results. There were differences between the observed and calculated values. This can be attributed to the fact that no crew weight was modeled in the VPP, and the experiment did not aim at getting results at the highest possible speed. However, the degree of agreement was acceptable.
Although the maximum lift coefficient of the curvy twin sail was at an AOA of 25 °, the optimized AOA for the curvy twin sail was found to be 15 °. The sailing drone speed generated by utilizing the curvy twin sail was primarily higher compared to the wing sail at true wind angles above 40 °.
Acknowledgments
This research was funded by Ministry of Trade, Industry and Energy (project titled “A Development of Suitable Sail Drone for Korea Coast,” Project No. KOITA – CLUSTER – 2020 – 08.
Author Contributions
Conceptualization, C. Yang; Methodology, B. G. Kim and C. Yang; Software, P. M. Ngoc; Formal Analysis, P. M. Ngoc; Investigation, P. M. Ngoc and C. Yang; Resources, P. M. Ngoc; Data Curation P. M. Ngo and B. G. Kim; Writing-Original Draft Preparation, P. M. Ngoc and B. G. Kim; Writing-Review & Editing, C. Yang; Visualization, P. M. Ngoc; Supervision, C. Yang; Project Administration, C. Yang; Funding Acquisition, C. Yang.
References
- WinDesign, Wolfson Unit Software, http://www.wumtia.soton.ac.uk/brochures/Windesign-Brochure.pdf, Accessed June 10, 2021.
- AHVPP, AeroHydro, Inc, http://aerohydro.com/products/marine/ahvpp.htm, , Accessed June 10, 2021.
- Formation Design System Pty Ltd, Learning Maxsurf Manual, 1984 – 2009.
- L. Larsson, R. Eliasson, and M. Orych, Principles of Yacht Design, 4th ed., McGraw Hill, 2014.
-
P. F. Rynne and K. D. von Ellenrieder, “A wind and solar-powered autonomous surface vehicle for sea surface measurements,” Oceans 2008, pp. 1-6, 2008.
[https://doi.org/10.1109/OCEANS.2008.5152116]

-
Y. Briere, “IBOAT: An autonomous robot for long-term offshore operation,” MELECON 2008 - The 14th IEEE Mediterranean Electrotechnical Conference, pp. 323-329, 2008.
[https://doi.org/10.1109/MELCON.2008.4618455]

- L. Giger, S. Wismer, S. Boehl, G. A. Büsser, H. Erckens, J. Weber, P. Moser, P. Schwizer, C. Pradalier, and R. Siegwart, “Design and construction of the autonomous sailing vessel avalon,” Proceedings of the 2nd International Robotic Sailing Conference, pp. 17-22, 2009.
- P. Miller, O. Brooks, and M. Hamlet, “Development of the USNA SailBots (ASV),” International Robotic Sailing Conference, Porto, Portugal, pp. 1–8, 2009.
- P. Miller, B. Beal, C. Capron, R. Gawboy, P. Mallory, C. Ness, R. Petrosik, C. Pryne, T. Murphy, H. Spears, and M. Hamlet, “Increasing Performance and Added Capabilities of USNA Sail-Powered Autonomous Surface Vessels (ASV),” International Robotic Sailing Conference, Kingston, Ontario, Canada, June 7-10, 2010, pp. 1–6, 2009.
- P. H. Miller, M. Hamlet, and J. Rossman, “Development of a Sail-Powered Autonomous Surface Vessel (ASV) for Trans-Atlantic Voyaging,” 4th International Robotics Sailing Conference, Lubeck, Germany, August 16-17, 2011.
-
G. H. Elkaim, “The atlantis project : A GPS-guided wing-sailed autonomous catamaran,” Journal of the Institute of Navigation, vol. 53, no. 4, pp. 237-247, 2006.
[https://doi.org/10.1002/j.2161-4296.2006.tb00386.x]

-
M. -N. Pham, B. -G. Kim, and C. J. Yang, “Shape and spacing effects on curvy twin sail for autonomous sailing drone,” vol. 26, no. 7, pp. 931-941, 2020.
[https://doi.org/10.7837/kosomes.2020.26.7.931]

-
R. Onnink, J. Gerritsma, and J. A. Keuning, "The Delft Systematic Yacht Hull (Series II) Experiments," 10th Chesapeake Sailing Yacht Symposium, Annapolis, Maryland, USA, February 1991.
[https://doi.org/10.5957/CSYS-1991-003]

- Offshore Racing Congress, “ORC VPP Documentation 2020”. Available: https://www.orc.org/rules/ORC%20VPP%20documentation%202020.pdf
- G. E. Hassan, A. Hassan, and M. E. Youssef, “Numerical investigation of medium range Reynold number aerodynamics characteristics for NACA0018 airfoil,” CFD letter, pp. 175-187, 2014.
- N. Hutchins, “The Use of Ansys CFX in America’s Cup Yacht Design,” in the proceedings of the 3rd High Performance Yacht Design Conference, Auckland, New Zealand, December 2nd-4thpp. 185-192, 2008.
- J. H. Milgram, “The aerodynamics of sails,” In the proceedings of the 7th Symposium of Naval Hydrodynamic, pp. 1397-1434, 1968.
- A. E. Gentry, “The application of computational fluid dynamics to sails,” in proceedings of the Symposium on Hydrodynamic Performance Enhancement for Marine Applications, 1988.
-
J. B. Fallow, “America’s cup sail design,” Journal of Wind Engineering and Industrial Aerodynamics, vol. 63, no. 1-3, pp. 183-192, 1996.
[https://doi.org/10.1016/S0167-6105(96)00075-X]

- A. R. Claughton and I. M. C. Campbell, “Wind tunnel testing of sailing rigs,” in the proceedings of the International HISWA Symposium on Yacht Design and Yacht Construction, pp. 89-106, 1994.
-
K. L. Hedges, P. J. Richards, and G. D. Mallinson, “Computer modelling of downwind sails,” Journal of Wind Engineering and Industrial Aerodynamics, vol. 63, no. 1-3, p. 16, 1993.
[https://doi.org/10.1016/S0167-6105(96)00071-2]

-
K. L. Hedges, P. J. Richards, and G. D. Mallison, “Computer modeling of downwind sails,” Journal of Wind Engineering and Industrial Aerodynamics, vol. 63, no. 1-3, pp. 95-110, 1996.
[https://doi.org/10.1016/S0167-6105(96)00071-2]

- E. N. Jacob and A. Sherman, “Airfoil section characteristics as affected by variations of the Reynolds number,” NACA Technical Report 586, pp. 227-267, 1937.
-
R. E. Shedahl and P. C. Klimas, “Aerodynamic Characteristics of Seven Symmetrical Airfoil Sections through 180-Degree Angle of Attack for Use in Aerodynamic Analysis of VerticalAxis Wind Turbines,” Technical Report No. SAND-80-2114, Sandia National Laboratories, Albuquerque, New Mexico, 1981.
[https://doi.org/10.2172/6548367]

-
W. A. Timmer, “Two-dimensional low-Reynolds number wind tunnel results for airfoil NACA0018,” Wind Engineering, vol. 32, no. 6, pp. 525-537, 2008.
[https://doi.org/10.1260/030952408787548848]

- E. J. de Ridder, K. J. Vermeulen, and J. A. Keuning, “A mathematical model for the tacking maneuver of a sailing yacht,” The International HISWA Symposium on Yacht Design and Yacht Construction, pp. 1-34, 2004.
-
J. A. Kenning, “Approximation of the hydrodynamic forces on a sailing yacht based on the ‘Delft Systematic Yacht Hull Series,’” Proceedings of the 15th International HISWA Symposium on Yacht Design and Yacht Construction, 1998.
[https://doi.org/10.5957/CSYS-1999-014]

- F. Bergsma, Effect of Rig Tension on Sailing Yacht Performance,” Internship Report (Master), The University of Auckland, New Zealand, 2012.

