Drone movement classification based on deep learning using micro-Doppler signature images
Copyright © The Korean Society of Marine Engineering
This is an Open Access article distributed under the terms of the Creative Commons Attribution Non-Commercial License (http://creativecommons.org/licenses/by-nc/3.0), which permits unrestricted non-commercial use, distribution, and reproduction in any medium, provided the original work is properly cited.
Abstract
As drones become more popular, interest in drone detection as well as the use of drones is increasing. Small drones typically have a small radar cross section, which is difficult to detect with conventional radar sensors. To solve this problem, technology for detecting drones using micro-Doppler signatures has been introduced. In this study, a micro-Doppler signature was used to classify drone movement and detect drones. The radar signal returned from a drone was quickly calculated using the far-field approximation and reverse-rotating of the incident field with the method of moment. The dataset was created by generating spectrogram images for various incident angles and movements. Through transfer learning, we can classify the drone's four movements with an accuracy of at least 98%.
Keywords:
AlexNet, Convolutional neural network, Drone, Micro-Doppler signature, Movement, Radar, Spectrogram1. Introduction
With the development of drone-related technology, drones have become smaller, and their prices have decreased. Consequently, drones have been widely used in various fields, such as entertainment, broadcasting, logistics, agriculture, environmental monitoring, and disaster countermeasures. In addition, there are growing concerns about drone misuse, and the need for drone detection technology is increasing. Drones are usually as small as birds; therefore, conventional security systems rarely detect them. For vision sensors, only small pixels are filled depending on the size of the drone and the distance between the drone and sensor. For radar sensors, the magnitude of the scattered field generated by drones is small, owing to the small size of the drone. Even if the radar sensor receives the scattered signal from the drone, it is not easy to distinguish between a bird and drone because they have similar radar cross section (RCS) levels. Therefore, it is difficult to detect drones using conventional radar sensors that recognize a target based on the RCS.
To use the radar sensor to detect drones, methods using radar signatures of a target, rather than the conventional RCS-based method, have been employed. In general, radar signatures of a complex large target, include high-resolution range profiles, inverse synthetic aperture radar images, and micro-Doppler signatures. Among these signatures, micro-Doppler signatures have been commonly used for drone detection, because drones have at least two rotating blades that cause Doppler frequency shift. Micro-Doppler signatures, reflecting a target's unique vibration and rotational movement, are used to distinguish it from other flying objects and birds. Early studies have mostly been conducted on hovering drones [1]-[7]. However, the most common scenarios are those in which the drones are moving; even hovering drones make subtle movements. Therefore, it is necessary to classify the micro-Doppler signatures associated with various movements.
In [1]-[2], micro-Doppler signatures extracted from multistatic radar data were used to classify hovering drones carrying different payloads. B. K. Kim proposed a drone classification method using a convolutional neural network (CNN), which was trained via micro-Doppler signatures using different numbers of operating motors [3]. Moreover, they demonstrated that the polarimetric information of the micro-Doppler signature could improve the drone detection performance [4]. In [5]-[6], the authors reported that the blasé length and rotation rate of drones can be obtained from their micro-Doppler signature. In [7], the cadence frequency spectrum was used to train the K-means classifier, to detect multiple drones. In these studies, the radar signals returned from hovering drones were measured, and micro-Doppler signatures extracted from the measured radar signal were used for drone classification or detection. However, the drone can move in various directions, such as going forward and backward, ascending, descending, and moving right and left. Moreover, a radar can be located at various aspect angles from a drone. Therefore, it is difficult to measure the dynamic RCS of a drone located at various aspect angles with detailed and accurate movements. Consequently, measurements are usually performed when the drone is hovering at a fixed position [1]-[2], and the signatures measured at the fixed position are different from those for a drone in flight. We added noise to match the actual measurements, and performed numerous simulations under various conditions. In addition, many signatures are required to train the classifier, but there is a limit to how much measurement data can be obtained. EM simulation of drones in various situations is the most effective solution to these problems.
In this study, we created an RCS dataset of a drone for various movement scenarios, and extracted a spectrogram as micro-Doppler signatures from the RCS data. Micro-Doppler signatures were then transmitted to a CNN, which then classified the drone's four representative movements (rising, descending, hovering, and going forward).
2. Drone Model and Methods for Movement Estimation
2.1 Drone Model
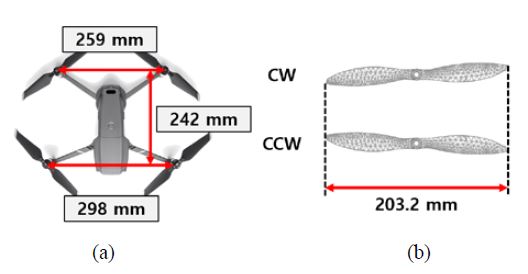
To simulate drone movements, we referred to one of the most popular drones, DJI’s Mavic 2 Pro, as shown in Figure 1. The drone has two types of propellers, clockwise (CW) and counterclockwise (CCW), that are mirror-symmetric to each other. The centers of the propellers were located in a bilateral symmetric structure. In addition, the RCS patterns of a propeller made of carbon fiber and one made of a perfect electric conductor (PEC) are similar [8]. Because the micro-Doppler effects caused by the relative movement of the radar and drone mainly occur in the propeller, only the PEC propeller was modeled to estimate the dynamic RCS. When a drone is hovering, the net thrust of all propellers pushing the drone up must be equal to the gravitational force pulling it down. In other words, all the propellers have identical rotation rates. Ascending (or descending) drones have a higher (or lower) rotation rate than hovering drones. To fly forward, the rear propellers must rotate faster than the front propellers.
By referring to the Robin Radar System ELVIRA, the operating frequency was determined as 9.65 GHz. The RCS and radar return signals were simulated at 9.65 GHz. Furthermore, the propeller’s mesh was divided based on an operating frequency of 9.65 GHz. The propeller length was 20.32 cm, or approximately 6.54λ at 9.65 GHz.
2.2 Dynamic RCS Data Generation
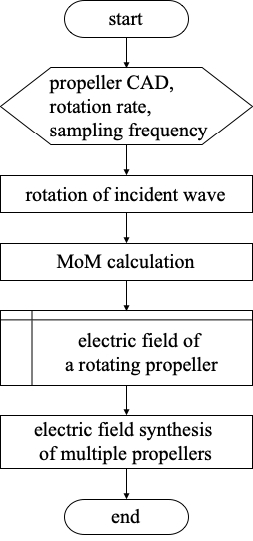
To obtain the dynamic RCS of a moving drone, first, the electric field scattered from the drone with respect to the time step must be simulated. The method of moments (MoM), a numerical analysis technique, is commonly used to accurately estimate the RCS [9]. We adopted the MoM introduced in [10] to simulate the dynamic scattered field because it has a fast computation time. In [11], the results were obtained for each frame using the MoM, which applied a core principle similar to ours, and practically valid results were obtained. As shown in Figure 1 (b), the propeller CAD model is segmented by triangular meshes based on the operating frequency, and the MoM using the Rao–Wilton–Glisson basis function is applied to the propeller meshes to calculate the electric field of a single rotating propeller. The electric field of a single propeller is synthesized into the electric field of multiple propellers using the far-field approximation, as shown in Figure 2. The RCS is defined as
| (1) |
where R is the distance between the radar and target, and Ei and Es are the incident and scattered fields, respectively. Substituting the dynamic electric field into Equation (1) yields the dynamic RCS.
2.3 Micro-Doppler Signature Image Data Generation
The spectrogram was obtained as a micro-Doppler signature from the dynamic electric field. As shown in Figure 3, first, a window function is applied to the dynamic electric field data, and the fast Fourier transform (FFT) is used to obtain a magnitude spectrum over time. Then, the squared spectrum becomes the spectrogram, which allows for the determination of the rotation rate and approximate magnitude of the micro-Doppler frequency over time.
Finally, for a more realistic dataset, additive white Gaussian noise (AWGN) is added to the dynamic electric field according to various signal-to-noise ratios (SNRs). This results in micro-Doppler signature images with various SNR values.
2.4 Dataset and CNN Transfer Learning
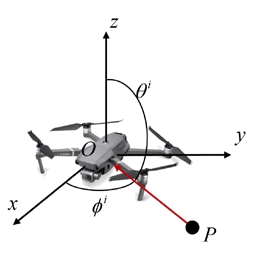
For the dataset, the elevation angle (θi) was changed from 0° to 90° in 1° step intervals, and the azimuth angle (ϕi) was changed from 0° to 180° in 5° step intervals. A total of 6,552 images were generated for each movement. To account for the noise effect, the AWGN was added to the radar return signal, so that the SNR varied from 0 dB to -15 dB with a -5 dB interval.
CNN transfer learning was used to classify the drone movement using the micro-Doppler signatures of the spectrogram in a supervised manner. The signature images used in this study have corresponding labels to identify the movement to which they are associated. The pre-trained CNN was AlexNet. In the training, stochastic gradient descent with momentum was used as the optimization technique. By considering the number of datasets, training was performed with a MiniBatch size of 64 and an epoch of 10. The initial learning rate was set to 0.01.
3. Results and Discussion
3.1 Micro-Doppler Signature Images
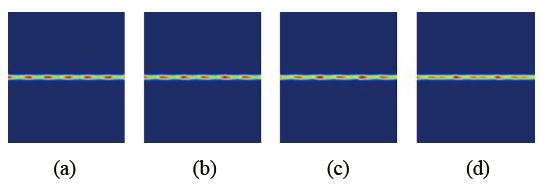
Figure 5 shows the spectrogram of the drone when θi = 90°, ϕi = 180°, and SNR = 0 dB. The x- and y-axes are the micro-Doppler frequency and time, respectively. The upper and lower points in the spectrogram are the points at which the Doppler frequency shift is maximized. The maximum Doppler frequency can be calculated as follows:
| (2) |
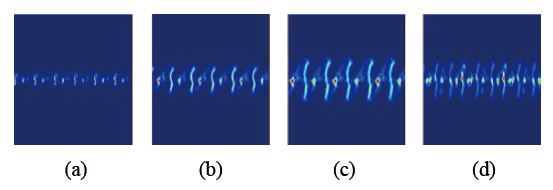
Spectrogram when the drone is (a) descending, (b) hovering, (c) ascending, and (d) going forward for an SNR of 0 dB
where r is the radius of the propellers, ω is the rotation angular velocity, and λ is the wavelength of the operating frequency. Accordingly, as the rotation rate increases, the length of the propeller and the operating frequency increase. Furthermore, the micro-Doppler frequency increases. The movement of the drone changes according to the rotation rate of the propellers, and various micro-Doppler signatures appear according to the movement. In the case of vertical movement, as the rotation rates of all propellers used in one drone are all the same, components with identical micro-Doppler frequencies superpose and appear strongly in the spectrogram. The descending case had the lowest rotation rate, and showed the smallest micro-Doppler frequency. However, as the rotation rate increased from the descending to hovering movement and from the hovering to ascending movement, the micro-Doppler frequency increased. In addition, when moving forward, as the front and rear propellers have different rotation rates, components with large and small micro-Doppler frequencies appear together. Figures 5 (a), 5 (b), and 5 (c) show that the maximum micro-Doppler frequency increases as the rotation rate increase. Because the propellers of the drone that is moving forward have two different rotation rates, the maximum micro-Doppler frequency is similar to the case of ascending via faster rotating propellers; however, the micro-Doppler signature of the horizontal axis appears more complicated owing to intermodulation by two rotation rates.
As the noise component increases, the spectrograms in Figure 5 change, as shown in Figure 6. Because the dynamic RCS level of the propellers is low, it is difficult to determine the micro-Doppler patterns even with noise of -15 dB SNR.
3.2 Movement Classification
The drone movement was categorized into four types according to the rotation rate of the propellers: ascending, hovering, descending, and moving forward. A total of 65,520 images were randomly divided into three groups: training images, validation images, and images used to test for transfer learning. The classification performance is summarized in Table 1. When the elevation angle was small (0–1°), the accuracy was less than 60%. As the elevation angle increased, the accuracy increased significantly. The average accuracy for all elevation angles was 98.94%.
If the radar is located directly above or below the drone (θi = 0º), the distance between the radar and propellers is always maintained as constant in the radar direction. Consequently, a micro-Doppler signal is barely generated. These results can be seen in Figure 7.
4. Conclusion
The spectrogram, one of the micro-Doppler signatures, was used to classify drone movement, rather than the type of drone. The radar return signal was calculated by considering the speed of the propeller according to the movement of the drone, and converted into a spectrogram. We created a dataset for transfer learning by generating signatures according to various noises and angles of incidence. Because we applied the test data to AlexNet trained via transfer learning, it was possible to distinguish movements with more than 98% accuracy even in images captured after a short observation time. In the future, we expect to be able to classify the movements of various drones by generating data on more diverse types of drones and movements.
Acknowledgments
This research was supported by Basic Science Research Program through the National Research Foundation of Korea (NRF) funded by the Ministry of Education (2021R1I1A3044405).
Author Contributions
Conceptualization, D. -W. Seo; Methodology, D. -Y. Lee; Software, J. -I. Lee; Validation, D. -Y. Lee; Formal Analysis, D. -Y. Lee; Investigation, D. -Y. Lee and D. -W. Seo; Resources, D. -Y. Lee; Data Curation, D. -Y. Lee; Writing—Original Draft Preparation, D. -W. Seo; Writing—Review & Editing, D. -W. Seo; Visualization, D. -W. Seo; Supervision, D. -W. Seo; Project Administration, D. -W. Seo; Funding Acquisition, D. -W. Seo.
References
-
F. Fioranelli, M. Ritchie, H. Griffiths, and H. Borrion, “Classification of loaded/unloaded micro-drones using multistatic radar,” Electronics Letters, vol. 51, no. 22, pp. 1813-1815, 2015.
[https://doi.org/10.1049/el.2015.3038]

-
M. Ritchie, F. Fioranelli, H. Borrion, and H. Griffiths, “Multistatic micro-Doppler radar feature extraction for classification of unloaded/loaded micro-drones,” IET Radar, Sonar & Navigation, vol. 11, no. 1, pp. 116-124, 2017.
[https://doi.org/10.1049/iet-rsn.2016.0063]

-
B. K. Kim, H. -S. Kang, and S.-O. Park, “Drone classification using convolutional neural networks with merged Doppler images,” IEEE Geoscience and Remote Sensing Letters, vol. 14, no. 1, 2017.
[https://doi.org/10.1109/LGRS.2016.2624820]

-
B. K. Kim, H. -S. Kang, and S. -O. Park, “Experimental analysis of small drone polarimetry based on micro-Doppler signature,” IEEE Geoscience and Remote Sensing Letters, vol. 14, no. 10, 2017.
[https://doi.org/10.1109/LGRS.2017.2727824]

-
A. K. Singh and Y. -H. Kim, “Automatic measurement of blade length and rotation rate of drone using W-band micro-Doppler radar,” IEEE Sensors Journal, vol. 18, no. 5, 2018.
[https://doi.org/10.1109/JSEN.2017.2785335]

-
A. K. Singh and Y. H. Kim, “Accurate measurement of drone’s blade length and rotation rate using pattern analysis with W-band radar,” Electronics Letters, vol. 54, no. 8, pp. 523-525, 2018.
[https://doi.org/10.1049/el.2017.4494]

-
W. Zhang and G. Li, “Detection of multiple micro-drones via cadence velocity diagram analysis,” Electronics Letters, vol. 54, no. 7, pp. 441-443, 2018.
[https://doi.org/10.1049/el.2017.4317]

-
M. Rithie, F. Fioranelli, H. Griffiths, and B. Torvik, “Micro-drone RCS analysis,” Proceedings of the 2015 IEEE Radar Conference, pp. 452-456, 2015.
[https://doi.org/10.1109/RadarConf.2015.7411926]

-
T. Li and et al., “Numerical simulation and experimental analysis of small drone rotor blade polarimetry based on RCS and micro-Doppler signature,” IEEE Antennas Wireless Propagation Letters, vol. 18, no. 1, pp. 187-191, 2019.
[https://doi.org/10.1109/LAWP.2018.2885373]

- D. -Y. Lee, J. -I. Lee, and D. -W. Seo, “Dynamic RCS estimation according to drone movement using MoM and farfield approximation,” Journal of Electromagnetic Engineering and Science, to be published.
- W. Y. Yang, D. J. Yun, and D. -W. Seo, “Novel automatic algorithm for estimating the jet engine blade number of insufficient JEM signals,” Journal of Electromagnetic Engineering and Science, to be published.

