The effect of the guide vane number and inclined angle on the performance improvement of a low head propeller turbine
Copyright © The Korean Society of Marine Engineering
This is an Open Access article distributed under the terms of the Creative Commons Attribution Non-Commercial License (http://creativecommons.org/licenses/by-nc/3.0), which permits unrestricted non-commercial use, distribution, and reproduction in any medium, provided the original work is properly cited.
Abstract
Providing guide vanes together with turbine runners is a beneficial method for improving the performance of a hydro turbine. In this study, an evaluation focusing on the effects of guide vanes on the operation of a hydro propeller turbine is conducted. A turbine with a low-head type and medium-specific speed, with four constant-thickness blades was numerically investigated in simulations. The two factors of the guide vane analyzed in this study are the number of guide vanes and their inclined angle (with respect to the turbine axial). First, the general performance of the bare turbine is determined, then the turbine runner working with several guide vane configurations is numerically tested under various working conditions. The turbine efficiency and power output are considered as two core factors that indicate the influence of the guide vane on the turbine behavior. In this study, the best guide vane configuration is a combination of eight vanes and a 30° angle, resulting in an efficiency improvement of 6.3%, and an output advancement of 4.2%.
Keywords:
Guide vane, Inclined angle, Propeller turbine, Performance evaluation, CFD1. Introduction
With the increased rate of economic growth, energy demand is becoming increasingly urgent. Renewable energies such as wind, solar, ocean-related, hydropowers, are feasible solutions to this thorny problem. Among several types of renewable energy, hydro energy is the most commonly utilized source, with a vast amount of power scales and applications. It was reported that an electricity amount of 4185 TWh was generated from hydropower worldwide in 2017, helping the Earth avoid approximately 4 billion tons of greenhouse gases and harmful pollutants. Recently, there have been more concerns regarding small-scale hydropower plants with outputs below 5 kW, which are classified as pico-hydropower plants. Pico turbines possess several advantages, such as simple structure, low manufacturing cost, and flexible installation. An energy converter for low heads, with 4-blade and 5-blade models was designed and tested numerically and experimentally, exhibiting great potential for application in off-grid water treatment plans, where the water head is under 20 m [1]. Research conducted by Samora determined the characteristics of a 5-blade propeller turbine generating power from water supply and distribution networks [2]. Axial-flow turbines for low-head micro-hydro systems (between 4 and 9 m) were introduced by Alexander et al. [3]. A hydraulic efficiency of over 68% was achieved in all the test models, which were built with planar blades. The experimental analysis proved that these turbines reached an efficiency of approximately 60%, with a flow rate of 15 to 20 m3/h. Singh et al. conducted experimental optimization by altering the inlet and exit tip angles of a propeller runner blade to achieve an efficiency improvement of 19% [4]. The effects of the guide vane angle on the Well turbine at different flow rates were analyzed by Halder et al. to determine that a higher guide vane angle produced a higher efficiency of the turbine, while the highest efficiency was achieved at an angle of 11.8o [5]. Setoguchi claimed that providing guide vanes on either side of the rotor is an effective way to improve system performance, and a well turbine equipped with 3D guide vanes was superior to those with 2D guide vanes [6].
In this study, an evaluation of the performance of a low-head pico-hydro propeller turbine equipped with guide vanes is presented. The guide vane plays a vital role in directing the water flow, changing the incoming angle to the runner blade; therefore, improving the turbine’s behavior. The turbine was numerically investigated under different working conditions with various numbers of guide vanes and different inclined angles, to determine the most appropriate configuration of the guide vane - runner combination. The surface streamlines on the runner blade, and the flow field vectors were visualized using CFD commercial code. In addition, the extracted power, effective head, and turbine efficiency are predicted, and considered as key factors for appraising the impacts of the guide vane on the turbine operation.
2. Specifications of Turbine and Guide Vane
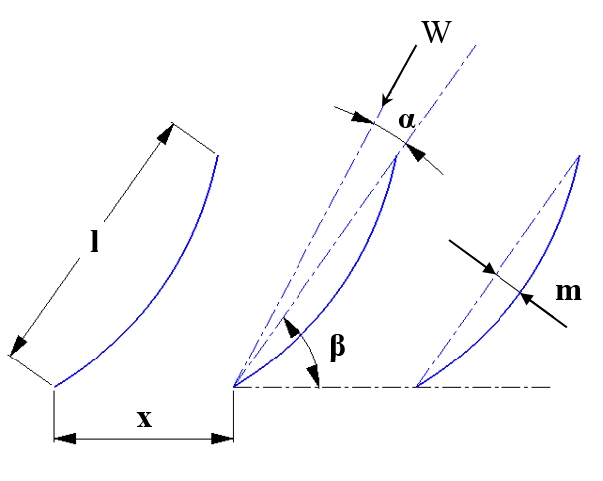
The low-head hydro turbine surveyed in this study was designed based on the free-vortex theory, which is commonly employed to develop several turbine models [4][7]. This well-known theory can be applied not only to incompressible flow for conventional hydraulic turbines, but also to compressible flow for axial compressors and gas turbines. The turbine design process was presented in detail in our previous study, where logical calculations were implemented to determine the turbine’s dimensions, chord, and the angle of each blade section [8]. The turbine runner possessed four constant-thickness blades with a tip diameter of 0.25 m, a hub-to-tip ratio of 0.4. To build the blade geometry, each blade was divided into six sections from the hub to the tip (Figure 1). Further, the calculations for the section’s angle and chord length were performed based on the turbine rated parameters, such as the designed output, expected efficiency, rated flow, and rotational speed.
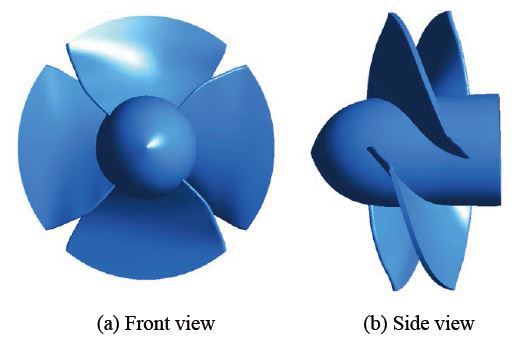
The detailed dimensions of the three sections of the runner blade are listed in Table 1. The runner was designed to rotate at a rated speed of 500 rpm, and a flow of 0.16 m3/s. It can operate at low head sites, with a water head under 2.5 m to generate the designed output power of 3000 W. The blade thickness was constant at 10 mm to simplify the manufacture. After determining the blade parameters, the 3D geometry of the runner was created using the Solidworks design software. The design parameters of the turbine are summarized in Table 2, and the front and side views of the turbine runner in the 3D geometry are illustrated in Figure 2.
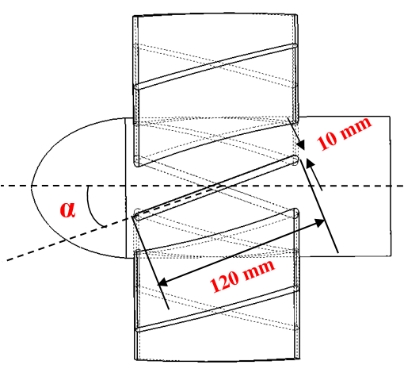
In this study, the guide vanes were installed together with the runner to direct the flow in a particular direction, enhancing the turbine’s performance. To facilitate the manufacturing work, the guide vane was built in a simple square shape, with constant thickness, and its tip and hub diameters were similar to those of the runner blade. The inclined angle of the guide vanes (α) was altered in four cases, which include 10°, 20°, 30°, and 40°, while the vane numbers were 6, 8, 10, and 12 vanes, respectively. The geometry of the guide vane is presented in Figure 3.
3. Numerical Method
3.1 Governing equations
The derivation of the principal equations of fluid dynamics is based on the fact that the dynamical behavior of a fluid is determined by the following conservation laws: the conservation of mass, momentum, and energy. The continuity, momentum, and energy equations in conservation form can be expressed in Equations (1)-(3), as follows:
| (1) |
| (2-1) |
| (2-2) |
| (2-3) |
| (3) |
where is the flow velocity (m/s), ρ is the fluid density (kg/m3), u is the relative velocity (m/s), p is the pressure (Pa), fx is the body force per unit mass acting on the fluid element in the x-direction (m/s2), τ is the shear force (N), e is the internal energy per unit mass (J/kg), μ is the viscosity (Pa · s), μt is the turbulent viscosity (Pa · s) and k is the thermal conductivity (W/mK).
3.2 Meshing strategy
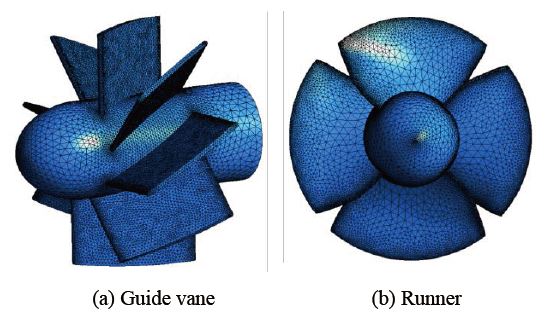
Creating a high-quality mesh is one of the most critical factors that must be considered to ensure simulation accuracy, because the grid quality affects the rate of convergence, calculation precision, and time consumption. The simulation model was divided into four domains: suction, guide vane, runner, and draft tube domains. The grids of the fluid domains were generated with the meshing module, based on the hybrid mesh. The grids for the suction and draft tube were built with hexahedral elements, which are highly space-efficient, while the guide vane and runner meshes were tetrahedral. The refined mesh was implemented at the blade hub and shroud to obtain a higher mesh density, and a 10-layer inflation was applied to all the wall surfaces to increase the calculation accuracy for the flow field in the near-wall regions. Figure 4 illustrates the mesh formation of the guide vane and runner blade, and Table 3 contains the Y-plus value and mesh information for each domain.
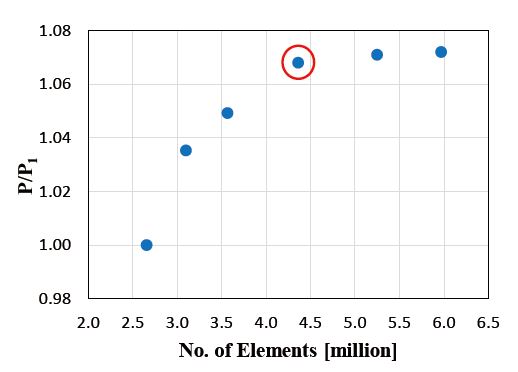
The grid-independent analysis is illustrated in Figure 5, where P is the output power of the turbine (in the case of 0° GV inclined angle, 6 vanes), and P1 is the output of the turbine with the smallest grid size. Based on the analysis result, Mesh 4 with 4.36 million elements was selected for simulations. When varying the GV number and inclined angle, a similar mesh generation setup was applied to the model.
3.3 Turbulence model and boundary condition
Numerical analyses using a commercial CFD code, CFX, were performed to predict the turbine performance under different working conditions and various configurations of the equipped guide vane. The turbulence model is an important factor in determining the accuracy of the simulations. As mentioned in several documents, the shear stress transport (SST) turbulence model takes advantage of the combination of k–ε in the far-field, and k–ω in the viscous sublayer at the near-wall regions. The validation of the SST turbulence model can be found in researches on hydraulic turbine performance [7][9][10]. It was determined that SST has a high ability to estimate the vortex appearance and flow separation on the surfaces of complex geometry blades. With the merits mentioned above, the SST turbulence model was employed in the numerical analysis of the current study.
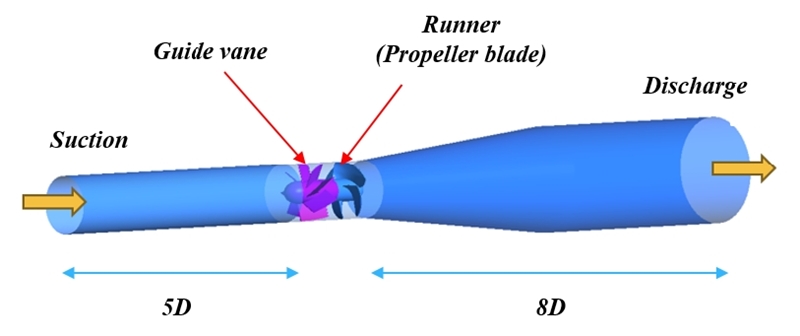
Table 4 lists the boundary conditions applied for the simulations in this study, and Figure 6 illustrates the dimensions and components of the simulation domains. A total pressure corresponding to a gross head of 2.5 m is set at the inlet of the suction domain. Meanwhile, the outlet applied various mass flow rate values to characterize the turbine performance under different working conditions. Water at 25 ℃ is chosen as the working fluid, and the simulation convergence criterion was set to 10-5.
4. Results and Discussion
4.1 Turbine general performance
First, the performance of the turbine without a guide vane was evaluated at a series of working flow rates, which were alternated gradually to demonstrate diversified operation conditions. The calculation accuracy in the current study was validated by the previous research on a pico-hydro turbine performed by Tran [8]. The propeller turbine was tested numerically and experimentally, and the CFD predicted and experimental results were compared, to validate the numerical method applied in this study. The hydraulic power, output power, hydraulic efficiency, and effective head are calculated using Equations (4)-(8) as follows:
| (4) |
| (5) |
| (6) |
| (7) |
| (8) |
where Pexp is the expected hydraulic power (W), Ph is the actual hydraulic power (W), Pmec is the mechanical power (W), and ρ is the water density (kg/m3), ηh is the expected efficiency, η is the actual efficiency, Q is the flow rate (m3/s), H is the gross head (m), T is the torque on the runner blade (N.m), ω is the rotational speed (rad/s), Heff is the effective head (m), and Pinlet and Poutlet are the pressures at the inlet and outlet (Pa).
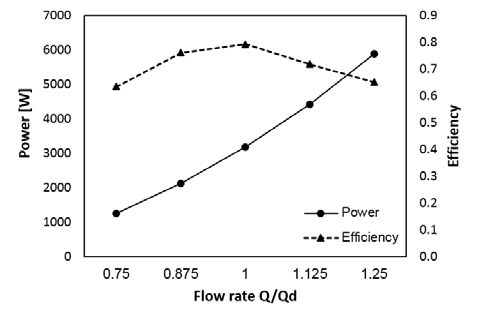
Figure 7 illustrates the performance curves of the hydraulic efficiency and generating power according to the change in flow rate, plotted by numerical simulations. Two characteristic curves were investigated over a wide range of discharge, from 0.75Qd to 1.25Qd (Qd is the rated flow). With an increase in the flow rate, the turbine extracted power increased progressively, reaching 3050 W at Qd. A higher flow rate generated a higher torque acting on the runner blade, resulting in a higher generated power. Meanwhile, the hydraulic efficiency peaked at 0.79 for the best efficiency point, and dropped at partial or excess flow rates.
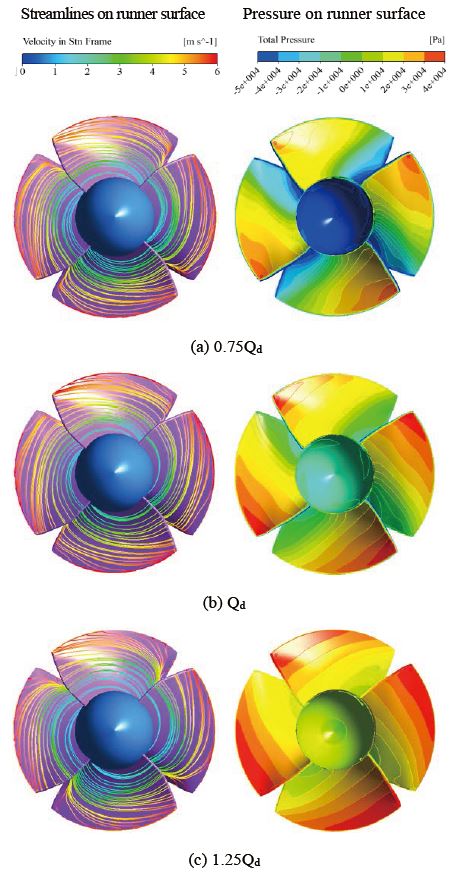
Figure 8 illustrates the distribution of the surface streamlines and pressure on the runner blade under three flow rates: 0.75Qd, Qd, and 1.25Qd. The fluid patterns on the blade were the smoothest, and were evenly distributed in the design flow. The runner working with partial and excess flows witnessed slight flow separation at the leading edge near the blade tip, causing power loss because the radial flow does not contribute to power generation. This phenomenon explains the reason for the highest hydraulic efficiency of the turbine under the design conditions. To turn to the pressure contour displayed on the right-hand side, owing to the energy transfer process, a pressure reduction from the blade leading edge to the trailing edge was observed. There was also a significant increase in the pressure field on the runner when the discharge rate increased.
4.2 The effects of guide vanes number on the turbine performance
The primary function of the guide vane (GV) in a hydro turbine is to direct the fluid flow to the turbine runner. By transporting the water at a proper attack angle, the inlet GV can adjust the blade torque, thereby altering the turbine power and efficiency. Therefore, the installation of GVs play an essential role in improving the turbine performance. To determine an appropriate GV number according to the turbine design working conditions, a series of GV configurations with different vane numbers and vane angles were built and tested along with the turbine runner.
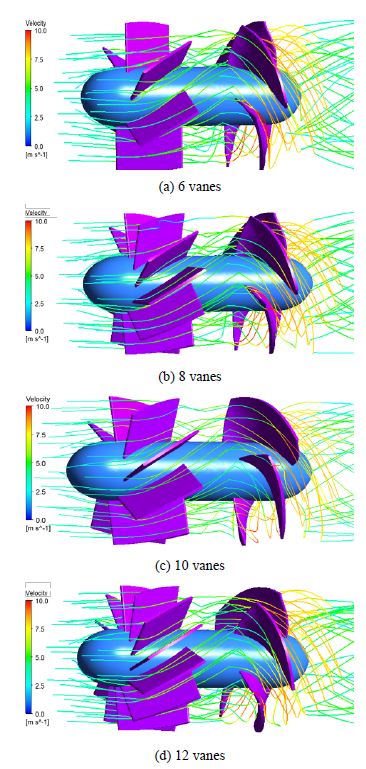
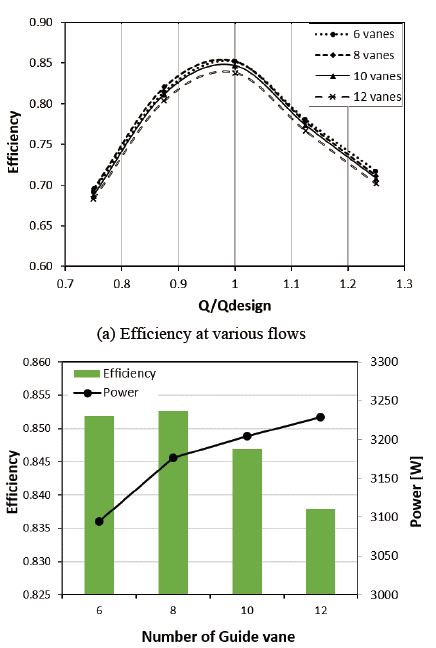
Figure 9 illustrates 3D streamlines of the water pattern throughout the GV and runner, in four cases of GV number (with 30° inclined angle): 6, 8t, 10, and 12 vanes. With an increase in the GV number, its solidity increased, resulting in a change in the flow resistance and flow guidance effectiveness. The impact of the GV number on the turbine performance is summarized in Figure 10.
Figure 10(a) illustrates the turbine performance under a series of flow conditions. The turbine equipped with 8 GV achieved the highest efficiency, followed by the turbine with 6 GV and 10 GV, while the 12 GV-turbine exhibited the lowest efficiency. In Figure 10(b), the efficiency and generated power at the design point were investigated under the designed operating conditions. With more GV, the turbine output increased gradually, accounting for 3230 W in the case of 12 GV. Nevertheless, the turbine efficiency followed a different trend, peaking at 8 GV with a value of 0.853, compared with 0.851 for 6 GV and 0.846 for 10 GV. Although 12 GV gained the highest output power, it exhibited the lowest efficiency of 0.837, owing to the high flow resistance caused by the increased solidity. More equipped vanes induced a better-directed flow, but it also caused a stronger resistance force for the current in the pipe. Overall, the turbine runner operated most effectively, with 8 GV, because it obtained high efficiency and saved the manufacturing material, resulting in low-cost investment.
4.3 The effects of guide vanes inclined angle on the turbine performance
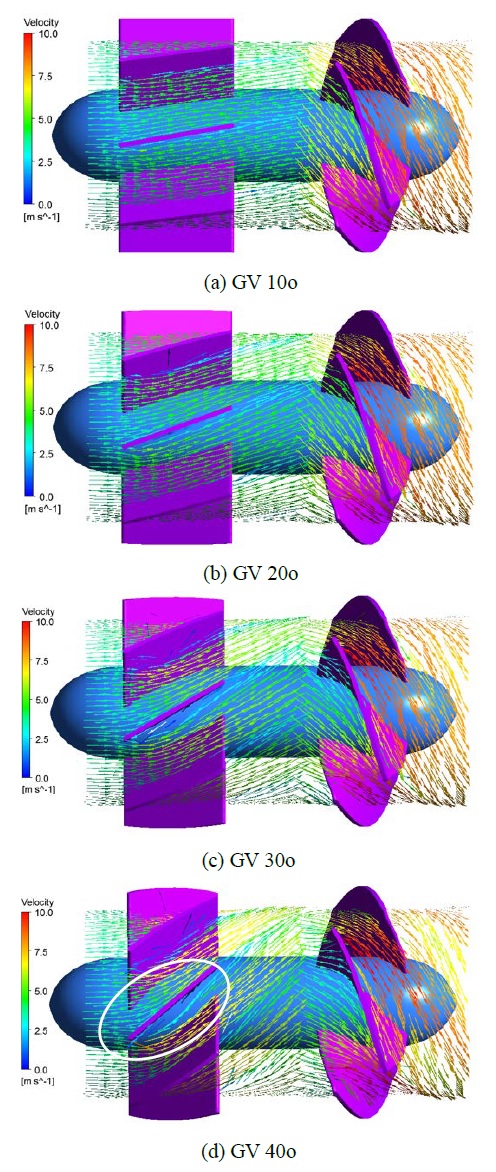
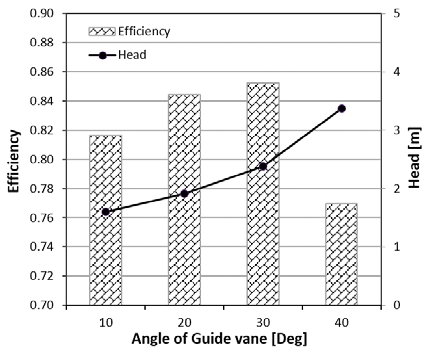
The GVs inclined angle is also an important factor affecting the turbine operation. The existence of a GV makes the flow no longer parallel to the turbine axis. Instead, its direction is altered, and the water current contacts the runner blade at a corresponding angle. Figure 11 illustrates the velocity vectors within the guide vane and runner domains, while Figure 12 illustrates the turbine efficiency and effective head in four cases of oblique GV from 10°–40°.The investigated range of angle was chosen as the above values, because if the GV angle is smaller than 10°or greater than 40°, the GV will no longer be helpful. As illustrated in Figure 12, a greater GV angle leads to a higher effective head, which means the turbine requires a higher head to operate at the designed rotational speed and generate the rated output power, which can be explained by the fact that the greater inclined angle resulted in a large GV cross-area perpendicular to the flow direction; therefore, the GV became an obstacle to the flow.
Moreover, a greater inclined angle also caused a reversed flow behind the GV leading edge (marked by the white circle in Figure 11(d)), which negatively affected the main current. Owing to the separated flow, the head loss caused the turbine with 40°GV to obtain the lowest efficiency, solely comprising 0.768. The turbine with 30°GV performed the best, with an efficiency of 0.85, and an effective head of 2.45 m, satisfying the initial designed conditions. This was followed by the 20° GV and 10° GV with turbine efficiencies of 0.843 and 0.818, respectively. Concisely, the 30° GV exhibited better characteristics compared to the other cases, significantly improving the turbine efficiency and extracted power.
5. Conclusion
This study compared different GV configurations to determine the effects of the GV number and GV inclined angles on a hydro propeller turbine operation. The simulations were conducted under various circumstances to withdraw the following key points:
At the design point, the propeller turbine without the GV can generate an output power of 3050 W, and the best efficiency when rotating at 500 rpm, under a 2.5 m head, and a flow rate of 0.16 m3/s was 79%. The surface streamlines and pressure distribution on the runner blade were visualized to indicate the effective operation of the runner under design and off-design conditions.
The installation of the GV positively ameliorated the turbine performance in both core factors. In terms of the GV number, the turbine with 8 GVs performed the best, with an improvement of 6.3% for efficiency. The turbine cooperating with a higher GV number was less effective because of the upstream flow obstruction caused by the GV.
The 30° GV assists the turbine in obtaining the best efficiency among the four cases of inclined angle. At this angle, the flow was directed to contact the runner blade at an appropriate attack angle, resulting in a low head loss and avoiding serious flow separation.
Finally, the combination of eight vanes and a 30° slanting angle, was the most effective guide vane configuration to support hydro turbine operation over a wide range of working conditions. Compared to the no-GV scenario, the turbine co-operating with the best GV arrangement can achieve an upgrade of 6.3% in efficiency, and 130 W, corresponding to 4.2% in power generation.
Author Contributions
Conceptualization, B. N. Tran and J. H. Kim; Methodology, B. N. Tran and J. H. Kim; Software, B. N. Tran; Formal Analysis, B.G. Kim; Investigation, B. N. Tran; Resources, J. H. Kim; Data Curation, B. N. Tran and B. G. Kim; Writing-Original Draft Preparation, B. N. Tran; Writing-Review & Editing, J. H. Kim and B. G. Kim; Visualization, B. N. Tran and J. H. Kim; Supervision, J. H. Kim.
References
- H. M. Ramos, M. Simao, and A. Borga, “CFD and experimental study in the optimization of an energy converter for low heads,” Energy Science and Technology, vol. 4, no. 2, pp. 69-84, 2012.
-
I. Samora, V. Hasmatuchi, C. M. Alligne, and et al., “Experimental characterization of a five-blade tubular propeller turbine for pipe inline installation,” Renewable Energy, vol. 95, pp. 356-366, 2016.
[https://doi.org/10.1016/j.renene.2016.04.023]

-
K. V. Alexander, E. P. Giddens, and A. M. Fuller, “Axial-flow turbines for low head microhydro systems,” Renewable Energy. vol. 34, no. 1, pp. 35-47, 2009.
[https://doi.org/10.1016/j.renene.2008.03.017]

-
P. Singh and F. Nestmann, “Experimental optimization of a free vortex propeller runner for micro hydro application,” Experimental Thermal and Fluid Science, vol. 33, no. 6, pp. 991-1002, 2009.
[https://doi.org/10.1016/j.expthermflusci.2009.04.007]

-
P. Halder and A. Samad, “Effect of guide vane angle on wells turbine performance,” Proceedings of the ASME Gas Turbine India Conference, pp. 1-7, 2015.
[https://doi.org/10.1115/GTINDIA2014-8183]

-
T. Setoguchi, S. Santhakumar, M. Takao, T. H. Kim, and K. Kaneko, “Effect of guide vane shape on the performance of a Wells turbine,” Renewable Energy, vol. 23, no. 1, pp. 1-15, 2001.
[https://doi.org/10.1016/S0960-1481(00)00163-4]

-
A.Muis and P. Sutikno, “Design and simulation of very low head axial hydraulic turbine with variation of swirl velocity criterion,” International Journal of Fluid Machinery and System, vol. 7, no. 2, pp. 68-79, 2014.
[https://doi.org/10.5293/IJFMS.2014.7.2.068]

-
B. N. Tran and J. H. Kim, “Design and analysis of a pico propeller hydro turbine applied in fish farms using CFD and experimental method,” Journal of Korean Society of Marine Environment & Safety, vol. 25, no. 3, pp. 373-380, 2019.
[https://doi.org/10.7837/kosomes.2019.25.3.373]

-
S. -S. Byeon and Y. -J. Kim, “Influence of blade number on the flow characteristics in the vertical axis propeller turbine,” International Journal of Fluid Machinery and Systems, vol. 6, no. 3, pp. 144-151, 2013.
[https://doi.org/10.5293/IJFMS.2013.6.3.144]

-
Z. Chen, J. -C. Kim, M. -H. Im, and Y. -D. Choi, “Analysis on the performance and internal flow of a tubular type hydro turbine for vessel cooling system,” Journal of the Korean Society of Marine Engineering, vol. 38, no. 10, pp. 1244-1250, 2014.
[https://doi.org/10.5916/jkosme.2014.38.10.1244]


