Numerical analysis for methane explosion in closed spaces
Copyright © The Korean Society of Marine Engineering
This is an Open Access article distributed under the terms of the Creative Commons Attribution Non-Commercial License (http://creativecommons.org/licenses/by-nc/3.0), which permits unrestricted non-commercial use, distribution, and reproduction in any medium, provided the original work is properly cited.
Abstract
Owing to regulations on environmental pollutants emitted by ships, the use of methane fuel is growing as the number of liquefied-natural-gas fueled ships has increased. However, methane has a high risk of explosion; therefore, there is a need to study the explosion characteristics and prepare countermeasures. In this study, we theoretically calculated the adiabatic flame temperature and maximum explosion pressure, and performed a numerical analysis of explosions based on previous experiments. The theoretically calculated adiabatic flame temperature and maximum explosion pressure were, respectively, 2,823 K and 9.28 bar, and the analysis results were 2,347 K and 7.5 bar, showing a difference of 476 K and 1.78 bar. However, the maximum explosion pressure according to the test results was 7.3 bar, which differed by 2.6% from the analysis results, and showed a margin of error within 5% in most of the compared concentrations. As a result of substituting the adiabatic flame temperature derived from the analysis results into the theoretical equation, the maximum explosion pressure became 8.1 bar, which differed by 7.5% with respect to the maximum pressure from the analysis results. Although the numerical values from explosion analysis were lower than those from the theoretical calculations, the analysis results were reliable because the maximum explosion pressure and the adiabatic flame temperature were similar to the test results at most of the concentrations. Therefore, the analysis results may be useful for finding an analytical approach to explosions inside dual-fuel engines in the future and help determine the size of relief valves required for dual-fuel engines.
Keywords:
Methane explosion, Numerical analysis, Closed space, Duel fuel engine, Relief valve1. Introduction
The International Maritime Organization has adopted measures to reduce greenhouse gas emissions and reduce environmental pollutants emitted by ships. Regulations on sulfur oxide emissions have been applied to vessels anchored in Korea since September 2020, and these regulations will be extended to vessels under sail. Such regulations have led to the development and commercialization of engines using liquefied natural gas (LNG) as fuel. Approximately 130 LNG-fueled ships have been built since 2015, which will reduce NOx (nitrogen oxides), SOx (sulfur oxides), and CO2 (carbon dioxide) emissions by 24%, 95%, and 23%, respectively, compared to the use of high-sulfur fuel oil [1].
Given that methane (CH4), which is the primary component of LNG, can cause explosions, engines using LNG are equipped with relief valves in the supply and exhaust systems to prepare for accidents. In the event of an explosion, the relief valve lowers the pressure inside the supply and exhaust systems below the reference pressure by discharging gas. The specifications of such relief valves are determined by explosion analysis [2].
Previous studies conducted explosion tests in closed chambers at initial temperatures in the range 20~240 ℃, initial pressures between 1 and 10 bar, and methane concentrations in the range 5~15 %vol (percent by volume). These studies used various chambers with different sizes (0.1 L and 25 ㎥) and shapes (sphere and cylinder) [3].
A study was also conducted on crankcase explosions for two-stroke marine diesel engines using fault tree analysis for system reliability and shipping sustainability [4].
Based on previous research, this study analyzed changes in pressure and temperature when LNG explodes, and compared the results in terms of methane concentrations to analyze explosions in the gas supply and exhaust systems of engines using LNG as fuel.
2. Theoretical Analysis
Using thermodynamics, the maximum pressure generated during an explosion in an adiabatic space can be estimated [5].
Methane accounts for approximately 91% of LNG and is a member of the paraffin series of hydrocarbons that burns at the highest pressure and temperature at a theoretical mixing ratio of 9.5%vol. Equation (1) shows the chemical reaction when methane completely burns at the theoretical mixing ratio.
| (1) |
The final temperature in the tank is determined from the energy balance relation Ein – Eout = ΔEsystem for reacting closed systems under adiabatic conditions (Q=0) with no work interactions (W=0).
| (2) |
Given that both the reactants and products behave as ideal gases, all the internal energy and enthalpies depend on temperature only, and the terms in this equation can be replaced by RuT. It yields
| (3) |
The reactants are assumed to be at the standard reference temperature of 25 ℃ (see Table 1).
Thus,
| (4) |
It yields
| (5) |
The temperature of the product gases is obtained from a trial and error solution.
At 2850 K,
| (6) |
At 2800 K,
| (7) |
By substituting Equations (6) and (7) for the enthalpy at 2,850 K and the enthalpy at 2,800 by trial and error, and finding the median value, the adiabatic flame temperature is approximately 2,823 K. This can be expressed as shown in Equation (8) using the ideal gas equation, and the pressure becomes 9.28 bar by substituting the initial atmospheric pressure, temperature, and adiabatic flame temperature after combustion. The results were compared based on the pressure obtained from the theoretical analysis to verify the explosion analysis.
| (8) |
3. Analysis Conditions
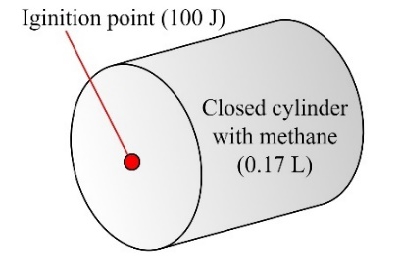
The explosion analysis modeling was configured to explode in an isolated system (diameter: 0.06 m, length: 0.06 m, volume: 0.17 L). The closed space was modeled as a 2D axisymmetric model to reduce the analysis time. Axisymmetric is a method mainly used when rotational symmetry exists around one axis. Results similar to 3D modeling can be obtained. Ansys Fluent 2020 R2, a commercial computational fluid dynamics program, was used to analyze the gas explosion [5][6].
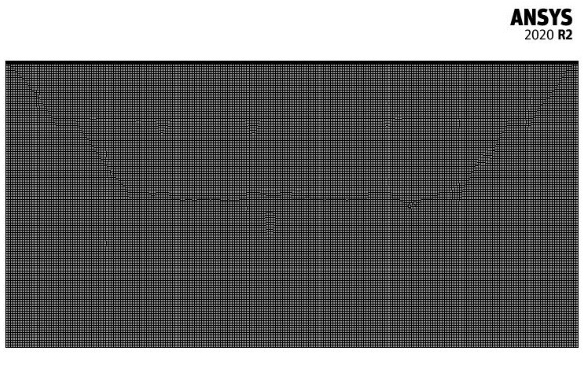
The flow area was made into a rectangular shape by simplifying the cylinder. Figure 1 shows the mesh modeling [7]. The mesh dependence was confirmed when the number of meshes was 1,567 or more. In this study, the number of meshes was set to 1,741, and the gas explosion was analyzed. The meshes were generated in squares, and an inflation layer was created on the wall to apply the wall function. Table 2 lists the initial conditions of the volumetric concentration and mass fraction of methane in the explosion analysis. The concentration of methane in the LNG engine was 6%. The results were compared by performing an explosion analysis in the range 6%~12%.
The analysis conditions were set to be abnormal to investigate the flame distribution characteristics over time using the standard K-epsilon turbulence model [6]. The time-step size was set to 0.00005 through the mesh size and Courant number. The analysis conditions are listed in Table 3.
The methane-air-2step combustion reaction mechanism was used for premixing [8][9], and ignition was achieved using a 100-J explosive charge, which is the maximum ignition energy specified in the test method of IACS UR M66:2008. Figure 2 shows the ignition point.
4. Results
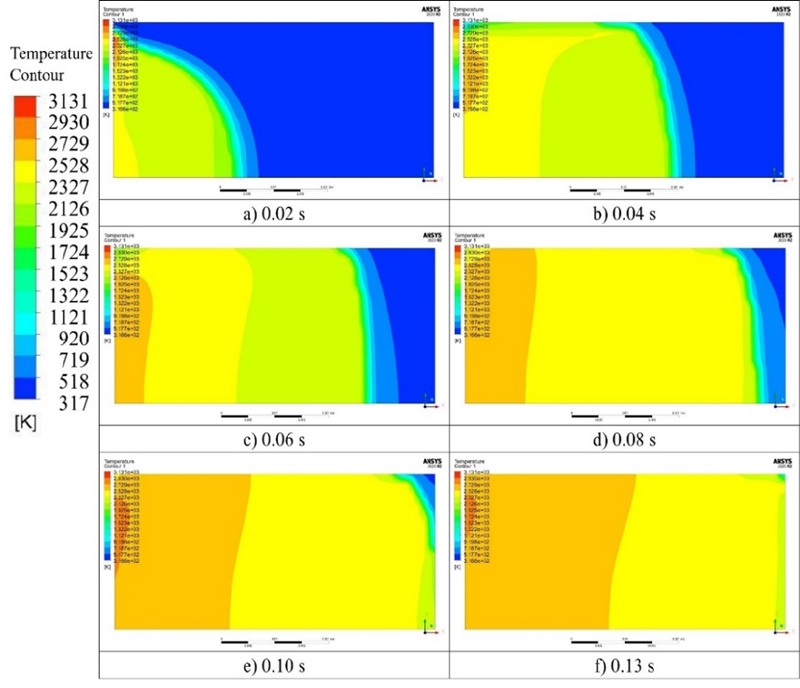
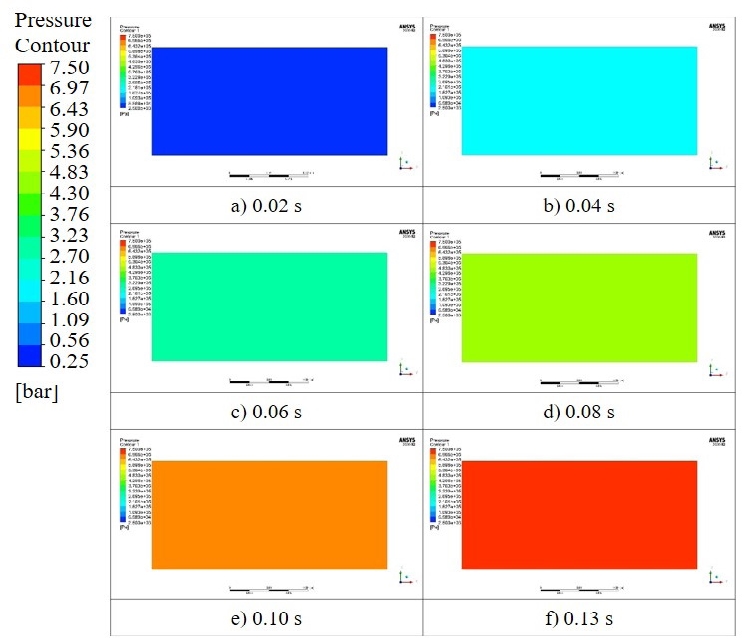
Figure 3 and 4 show the temperature and pressure distributions after combustion according to the explosion analysis. The flame propagation speed on the wall was slower than that of the internal combustion. However, the pressure distribution in the cylinder did not differ owing to the fast propagation speed of the pressure.
Comparing the above-mentioned theoretical results with the numerical analysis results at a methane concentration of 9.5%vol, the theoretical adiabatic flame temperature was 2,823 K, and the explosion pressure was 9.28 bar. However, according to the explosion analysis, the adiabatic flame temperature was 2,347 K, and the explosion pressure was 7.5 bar, i.e., 476 K and 1.78 bar lower than the theoretical results, respectively.
Various chemical species, such as CH3, CO2O, CH2, HCO, CO, H2O2, CO, OH, and H, are produced during the combustion of methane, resulting in complex reactions [10]. Therefore, when methane gas explodes, the high-temperature combustion gas does not completely burn because various chemical species are generated owing to thermal dissociation, Brownian motion, or molecular collisions [11]. This process can lead to differences in theoretical, analytical, and test results [12].
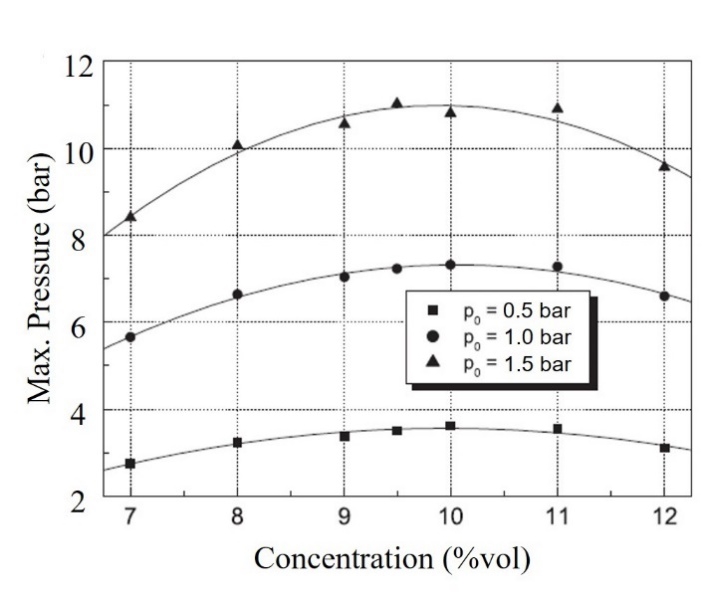
According to a previous study [3], the maximum explosion pressure is influenced by the initial pressure and the characteristics of the explosion vessel. Figure 5 shows the results obtained in a 0.17-L cylinder-type chamber. As the analysis in this study was performed under atmospheric pressure, the results should be compared to 1 bar.
Table 4 and Figure 6 show a comparison of the analysis and experimental results. An error below 5% occurred at most concentrations, and the largest error was 7.04% at 12%vol. In particular, the difference was approximately 2.67% at the theoretical air-fuel ratio (9.5%vol); therefore, the explosion analysis in this study is considered to be reliable.
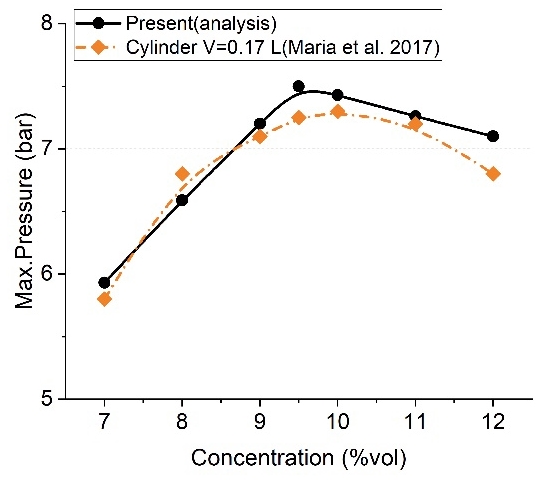
Comparison of maximum-pressure results of the analysis and test as a function of methane concentration
Aldaihani and Park studied the effect of the length-to-width ratio on methane gas explosions in a fixed roof storage tank, and found that the combustion was a normal premixed burning condition when the final averaged pressure appeared at 3.8 bar [7]. In this study, the pressure results of the numerical analysis for the closed space were compared with the theoretical calculation results to verify the accuracy.
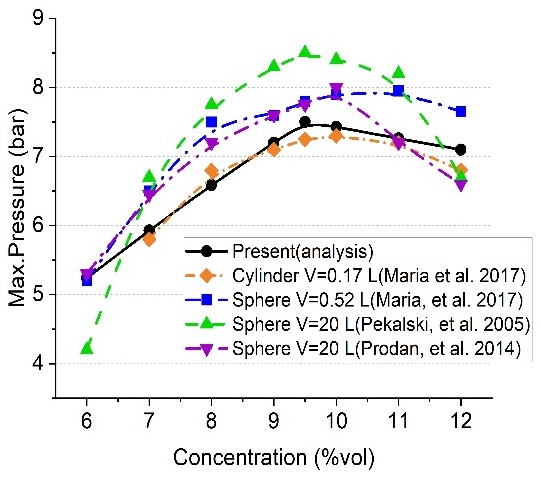
Figure 7 shows the results of studies on various explosions. In particular, it shows the data of explosion tests by methane concentration in chambers with different volumes. The analysis results show a significant difference with respect to the test results using a 20-L sphere-type chamber, but most of the errors remained within 15%. In particular, the error was less than 13% at a theoretical mixing ratio of 9.5%vol. The results of other tests [3] were generally lower than those of the above study, showing smaller differences in the analysis results.
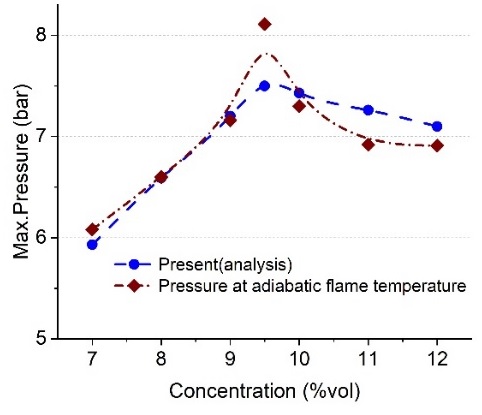
Figure 8 compares the pressure calculated using the ideal gas equation according to the flame temperature derived from the analysis results and the pressure obtained from the analysis. The flame temperature at 9.5%vol was approximately 2,347 K, and when calculated as pressure, it was 8.1 bar, but the maximum pressure in the analysis was 7.5 bar, with an error of approximately 7.5%. This shows that there was no significant difference in the calculations using the adiabatic flame temperature.
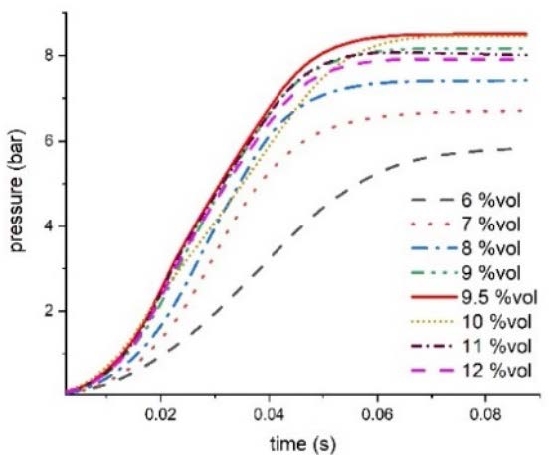
Figure 9 shows the pressure change over time for each concentration at the central point of the cylinder after ignition. At 9.5%vol, the pressure increased rapidly, and at 6%vol, the pressure increase was relatively gentle.
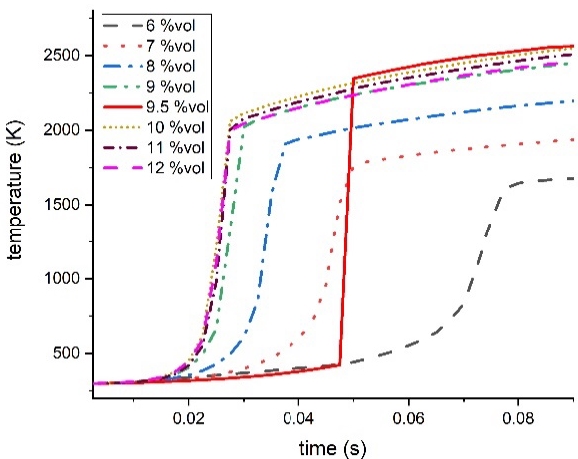
Figure 10 shows a graph of the temperature at the center of the cylinder after ignition. It can be seen that the methane concentration increased sharply to 9.5%vol, in the same way as pressure. However, the time elapsed until the combustion temperature was reached after ignition ranged from 0.02 to 0.07 seconds, presenting differences for each concentration. These differences in the time it takes to reach the combustion temperature is thought to be the result of analyzing the rapid combustion. We plan to analyze the results in terms of the explosion model used for the analysis through a follow-up study.
5. Conclusions
In this study, an explosion analysis in an isolated system was performed to determine the specifications of relief valves to prepare for explosions in engines using LNG as fuel. The main findings are as follows:
- 1. The theoretical adiabatic flame temperature and maximum explosion pressure were, respectively, 2,823 K and 9.28 bar, showing a difference of 476 K and 1.78 bar with respect to the analysis results (2,347 K and 7.5 bar).
- 2. The maximum explosion pressure was approximately 7.3 bar in the chamber with the same volume. This only differed by 2.6% from the analysis results, showing that the analysis results were reliable because the error was less than 5%.
- 3. The maximum explosion flame temperature by concentration was 2,347 K, and if this value is substituted into the ideal gas equation, the maximum explosion pressure at the theoretical mixing ratio becomes 8.1 bar, showing an error of approximately 7.5% with respect to the analysis results.
- 4. At 9.5%vol, the pressure and temperature increased most rapidly. However, the time for the temperature increase after ignition differed from 0.02 to 0.07 seconds. In the future, it additional research on the temperature increase time by analyzing explosions accompanied by high-pressure waves is deemed necessary.
Although the analysis results differed from the theoretical calculations, most of the results showed errors within 5% compared to the test results. Therefore, the analysis results are reliable. They may be used to find an analytical approach to explosions inside dual-fuel engines in the future and help determine the size of relief valves required for dual-fuel engines.
Acknowledgments
This study was funded by the R&D support project (01 August 2020~31 July 2021) of the Korea Industrial Technology Association.
Author Contributions
Conceptualization, K. J. Kong and J. H. Kim; Methodology, K. J. Kong and D. K. Koh; Software, J. H. Kim; Validation, H. U. Mun and J. H. Kim; Investigation, D. K. Koh; Resources, J. H. Kim; Data Curation, H. U. Mun; Writing—Original Draft Preparation, K. J. Kong; Writing—Review & Editing, J. H. Kim; Supervision, J. H. Kim; Project Administration, J. H. Kim; Funding Acquisition, J. H. Kim
References
-
I. P. Kang and K. C. Kim, “Development of a GVT (Gas Valve Train) control system for LNG fueled vessels,” Journal of Power System Engineering, vol. 21, no. 4, pp. 70-76, 2017 (in Korean).
[https://doi.org/10.9726/kspse.2017.21.4.070]

- O. S. Han, Study on damage prediction in explosion accidents of chemical material (Focus on Flammable gas), 2015-OSHRI-1093, Research report by Center for Center for Chemicals Safety and Health, Occupational Safety and Health Research Institute, Korea, 2015. Available: http://www.kosha.or.kr/oshri/publication/researchReportSearch.do?mode=download&articleNo=63464&attachNo=57309
-
W. Bartknecht and G. Zwahlen, Explosionsschutz. Grundlagen und Anwendung, German Edition, Berlin, Germany, Springer, 1993.
[https://doi.org/10.1007/978-3-642-77515-4]

-
B. Ünver, S. Gürgen, B. Sahin, and İ. Altin, “Crankcase explosion for two-stroke marine diesel engine by using fault tree analysis method in fuzzy environment,” Engineering Failure Analysis, vol. 97, pp. 288-299, 2019.
[https://doi.org/10.1016/j.engfailanal.2019.01.007]

- Y. A. Çengel and M. A. Boles, Thermodynamics: An Engineering Approach, Fifth Edition, New York, USA, McGraw-Hill, 2006.
- Ansys Inc., Ansys Customer Portal, https://support.ansys.com/AnsysCustomerPortal/en_us/Downloads/Current+Release, 28-May-2021.
-
N. Aldaihani and K. H. Park, “Effect of containment structure on methane gas explosion in fixed roof storage tank,” Journal of the Korean Society of Marine Engineering, vol. 42, no. 8, pp. 653-658, 2018.
[https://doi.org/10.5916/jkosme.2018.42.8.653]

-
M. Mitu, V. Giurcan, D. Razus, M. Prodan, and D. Oancea, “Propagation indices of methane-air explosions in closed vessels,” Journal of Loss Prevention in the Process Industries, vol. 47, pp. 110-119, 2017.
[https://doi.org/10.1016/j.jlp.2017.03.001]

-
K. L. Cashdollar, I. A. Zlochower, G. M. Green, R. A. Thomas, and M. Hertzberg, “Flammability of methane, propane, and hydrogen gases,” Journal of Loss Prevention in the Process Industries, vol. 13, no. 3-5, pp. 327-340, 2000.
[https://doi.org/10.1016/S0950-4230(99)00037-6]

-
S. E. Gant, M. R. Pursell, C. J. Lea, J. Fletcher, W. Rattigan, A. M. Thyer, and S. Connolly, “Flammability of hydrocarbon and carbon dioxide mixtures,” Process Safety and Environmental Protection, vol. 89, no. 7, pp. 472-481, 2011.
[https://doi.org/10.1016/j.psep.2011.06.017]

-
M. Gieras, R. Klemens, G. Rarata, and P. Wolański, “Determination of explosion parameters of methane-air mixtures in the chamber of 40 dm3 at normal and elevated temperature,” Journal of Loss Prevention in the Process Industries, vol. 19, no. 2-3, pp. 263-270, 2006.
[https://doi.org/10.1016/j.jlp.2005.05.004]

-
H. S. Yang, H. S. Park, J. H. Park, J. W. Eun, and Y. H. Lee, “Study of propane gas explosion experiment and numerical analysis of flame arrestor design for LPG ship exhaust system,” Journal of Advanced Marine Engineering and Technology, vol. 44, no. 1, pp. 34-41, 2020.
[https://doi.org/10.5916/jamet.2020.44.1.34]


