Optimal operation strategy of a large fuel-cell hybrid ship
Copyright © The Korean Society of Marine Engineering
This is an Open Access article distributed under the terms of the Creative Commons Attribution Non-Commercial License (http://creativecommons.org/licenses/by-nc/3.0), which permits unrestricted non-commercial use, distribution, and reproduction in any medium, provided the original work is properly cited.
Abstract
Various international organizations have been working diligently to counter global warming. In particular, the International Maritime Organization has limited the emissions from ships. Accordingly, the development of electric propulsion ships is emerging as a widely discussed topic in the shipbuilding industry, and electric power sources such as fuel cells and batteries are being used as power sources for hybrid ships. In this study, a simulation was performed wherein the optimal operation strategy was applied to a fuel cell–engine generator–battery hybrid power source that can be used in a 200-ton tanker. The optimal operation strategy was first studied using a hybrid vehicle. We aimed to locate the operating point of the engine near the optimal driving range and to maintain the state of charge (SOC) of the energy storage system. Similarly, in hybrid ships, the operating points of the engine and fuel cells are placed in their respective optimal operating areas, and the SOC of the battery is near the target value. An actual operation strategy for hybrid ships, which is to be developed in the future by simulating the optimal driving strategy for large ships, was devised.
Keywords:
Engine generator, Solid oxide fuel cell, Power distribution, Dynamic programming, Optimal strategy1. Introduction
Since January last year, the International Maritime Organization has been enforcing regulations that require ships entering and departing from all ports in member countries to submit reports to reduce greenhouse gas emission. This year, the standard for the sulfur content of heavy oil for ships has been reduced from 3.5 % to 0.5 % [1].
Additionally, all ships built after 2025 are expected to have their energy efficiency increased by 30% compared with those built in 2014. Accordingly, the International Maritime Organization has set a goal of reducing carbon dioxide emissions per unit volume by at least 40 % by 2030 and by 70 % by 2050 compared with 2008 emissions. Owing to such regulations by the International Maritime Organization [2], attention is being paid toward the development of eco-friendly ships to considerably reduce air pollution and carbon dioxide emissions.
One of the most active environmental movements is occurring in Europe, with an environmentally liberal government that operates many passenger ships. The “e-ferry” project has been launched by the European Union. It is a 100 % electric-powered passenger ship development project that is energy efficient and is meant to navigate islands, coastal areas, and inland waterways across Europe without causing greenhouse gas emissions. The project has been under development since 2015 [3].
In Germany, through the Fellow SHIP project, a 7,000-h operation technology demonstration of hydrogen fuel cell vessels was conducted; in Norway, hybrid ferries equipped with hydrogen fuel cells and batteries are scheduled to be operated in 2021 [4].
In Korea, a hydrogen ship promotion team was launched in Busan to bridge the technological gap with advanced countries, in 2018. In Ulsan, a hydrogen city vision proclamation ceremony was held, setting the goal of manufacturing ships equipped with ultra-large fuel cells with Hyundai Heavy Industries. The production of ships with hydrogen fuel cells is on a rise globally. Particularly, the use of solid oxide fuel cells (SOFCs) in ships has gained attention because they are highly efficient among the different types of fuel cells and can be used by reforming existing fossil fuels. Additionally, they can generate large-scale power [5].
Fuel cells are being used in large ships, particularly oil tankers, in which the use of batteries and fuel cells is being considered in addition to the previously used large engines. The engine, battery, and fuel cell handle the total power requirements of the ship. In this study, a power distribution strategy was employed as an optimization technique and applied to hybrid vessels. Of the many optimization techniques, dynamic programming, which aims for global optimization, is applied to power distribution [6].
The powertrain of a hybrid vehicle has presented major challenges owing to the combination of the mechanical energy of the engine and motor. The power distribution of the engine and motor is determined by a rule-based strategy and a theoretical optimal control strategy that can be applied to an actual vehicle. An electric hybrid powertrain, in which a fuel cell and battery are combined, has recently become a major research topic. It has been used in various mechanical industries such as vehicles, construction machinery, and agricultural machinery; however, no study has focused on the theoretical power distribution. Dynamic programming model simulations were performed for the large fuel-cell hybrid vessel considered in this study to maximize the efficiency of the fuel cells, minimize the fuel consumption of the engine, and maintain constant battery SOC. The simulation analysis method entailed obtaining an engine power with the optimum efficiency for each unit step of a required power profile. For the fuel cells, the power corresponding to the optimum efficiency was determined using the existing efficiency curve, and the engine and battery handled the remaining power requirement. When the engine power with optimum efficiency is determined, the battery takes charge of the remaining power, except for it. The behavior of each power source is determined according to the power distribution. The optimization technique used in vehicles was extended to hybrid ships in this study, and the findings can be referred to during actual development in the future.
2. Optimal Power Distribution
2.1 System Configuration
The target vessel considered for the simulation was a 200-ton tanker and comprised a large engine for navigation, fuel cells as auxiliary power sources, and batteries. In conventional oil tankers, the engine handles the total power requirements of the ship; however, in hybrid ships, the engine, fuel cell, and battery are used for satisfying the total power requirements. The following equation shows that the total required power is the sum of the engine, fuel cell, and battery powers:
| (1) |
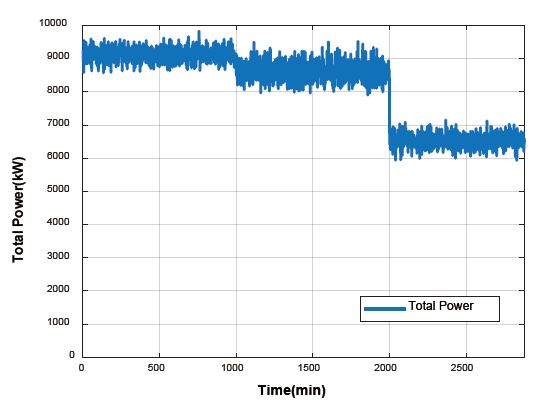
Therefore, the optimal power distribution strategy can be applied. Figure 1 shows the total required power of the existing oil tanker.
2.2 Dynamic Programming
The dynamic programming method used in this study has been widely applied as a power distribution strategy for engines and motors in existing hybrid vehicles. Therefore, the power required by the tanker is divided among the fuel cell, engine, and battery after modeling the powertrain of the hybrid ship. To solve a given problem using the dynamic programming approach, different parts of the problem are solved, following which the solutions of the subproblems are used to arrive at an overall solution. Typically, when using a more naïve method, many subproblems are generated and solved numerous times. The dynamic programming approach seeks to solve each subproblem only once, thus reducing the number of computations. Once the solution to a given sub-problem is computed, the solution is stored in the memory. When the same solution is required subsequently, it is simply retrieved. This approach is particularly useful when the number of repeated subproblems grows exponentially as a function of input size. The dynamic programming approach applied to the hybrid tanker in this study comprised N stages of time steps, the conditional parameter x in the k-stage of N, and the control parameter u. Equation (2) shows the defined optimization method used in this study [7].
| (2) |
Equation (2) indicates that the dynamic programming problem is solved in a forward manner. If the optimal route from the first stage to the N – 1 stage is known, the optimal route from the first stage to N stage can be calculated from the dynamic equation. The cost function J is the function of fuel economy and change in battery SOC, in terms of the power distribution problem for the hybrid tanker. The control parameter u denotes the battery power at each time step [8].
3. Hybrid Power Sources
3.1 Engine
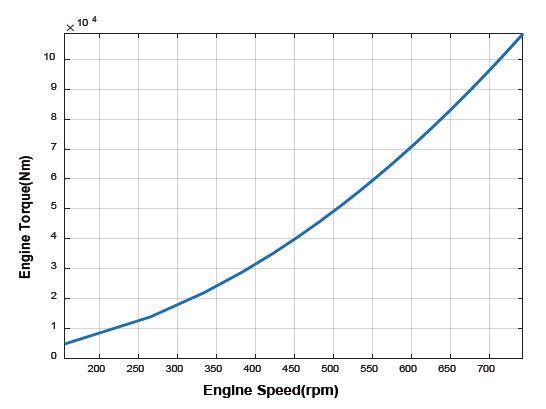
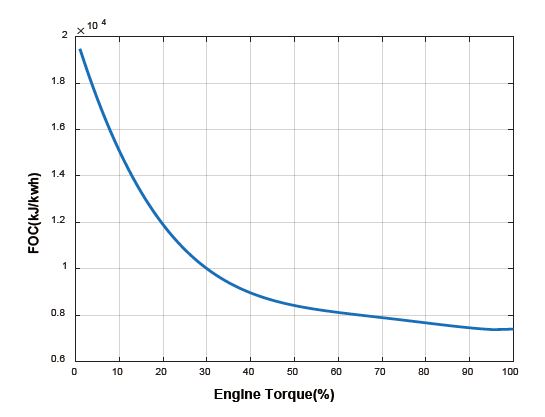
The engine generator refers to a single device with an engine and a generator as the main components. Generally, the generator providing power is omitted, and the term is only called an engine. Engine generators include fuel suppliers, governors, voltage regulators, and cooling, exhaust, and lubrication systems. Large-power equipment with an output of approximately 1 kW may be equipped with a storage battery and a starting motor; if the scale is higher, compressed air may be used to start the engine. The engine generator used in this simulation has a maximum output of 7 MW, a fixed driving range of approximately 700 rpm, and an optimal fuel efficiency range of 85 %–95 %. Figure 2 shows the engine speed–torque curve, and Figure 3 depicts the fuel consumption rate according to the percent torque [9].
3.2 Fuel Cell
Fuel cells have a structure that generates power by reacting fuel, such as reacting hydrogen and air, and it is an environmentally friendly and efficient power-generation device. Various types of fuel cells, which use different materials, are being developed, and SOFCs exhibit the highest energy conversion efficiency. Such fuel cells use solid oxides such as zirconium oxide (ZrO2) or ceria (CeO2) as electrolyte. Because oxide ions are conducted in the electrolyte, not only hydrogen but also hydrocarbons such as methane and butane can react with oxygen in the air to generate electricity.
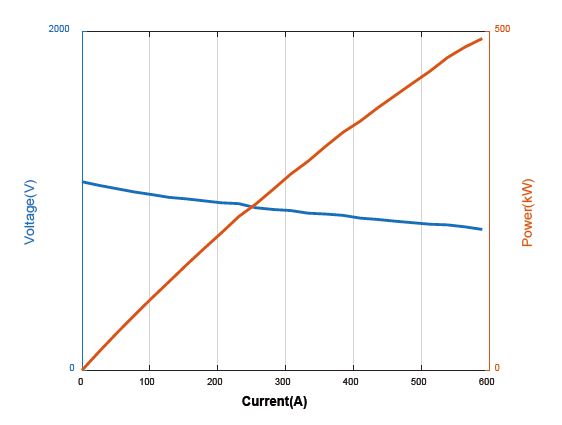
The operating temperature is high, in the range of 700–1000 °C, and its use is limited to large power generation facilities and home power generation. Figure 4 shows the current–voltage graph of a fuel cell stack [10].
Using these data, the amount of hydrogen used over time can be calculated. As indicated by Equation (3), the net power of a fuel cell is the difference between the stack power and auxiliary power. Equation (4) expresses the manner in which hydrogen is consumed when the current is the flow of ions.
Estack represents the power of the stack and Eaux the auxiliary power of the fuel cell, accounting for approximately 15 % of the maximum power of the stack. Moreover, Ncell denotes the number of cells, Mh2 the molar concentration of hydrogen, Istack the current in the stack, and F the Faraday constant.
| (3) |
| (4) |
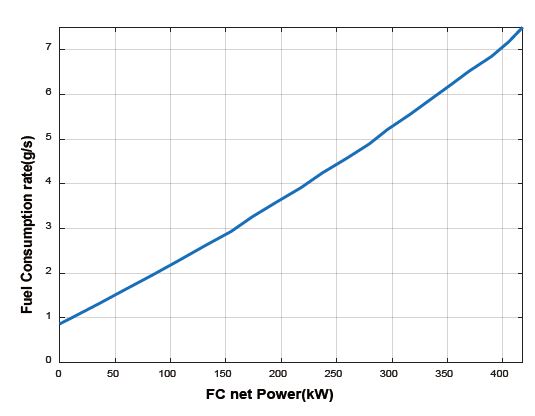
Equation (5) represents the efficiency of the entire fuel cell system. LHV denotes the lower heating value of hydrogen. Figure 5 depicts the relationship between the fuel cell net power and hydrogen consumption rate [11].
| (5) |
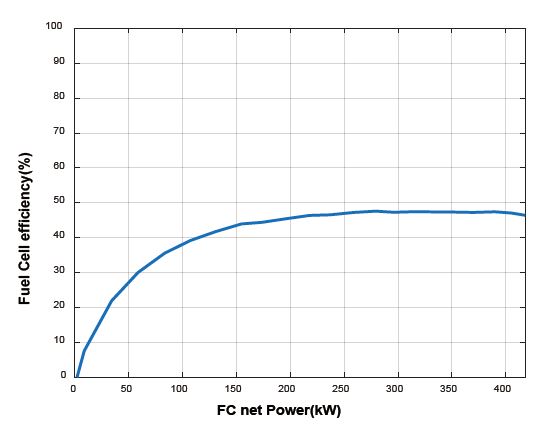
Figure 6 shows the system efficiency versus stack net power for an SOFC. The data shown here were used for power distribution in the simulation. The stack is a component that generates electrical energy in a fuel cell system, and the power generated from it is divided into the balance of plant (BOP) and propulsion. The stack power used for the BOP was approximately 15 %, and the maximum output was 420 kW. Considering the BOP power, the stack-rated net power is approximately 300 kW, and the efficiency is approximately 47 %.
3.3 Battery
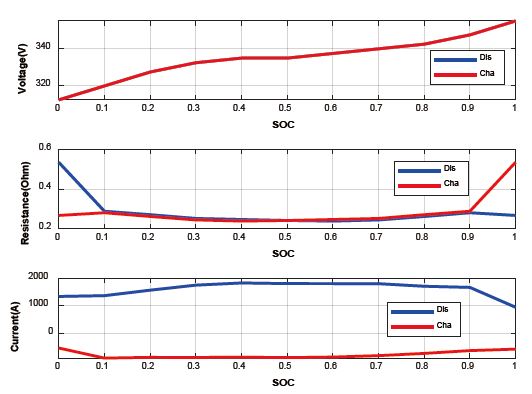
An energy storage system is a device that stabilizes the irregular power of renewable energy by storing power when the power demand is low and using the stored power during high-consumption times. It increases the efficiency of electric energy and enhances the safety of the power system, thereby minimizing the limitation of transmission capacity. It also increases the utilization of renewable energy. The energy storage system used in the simulation was a 100-kWh lithium-ion battery, in which lithium ions moved from the negative electrode to positive electrode during discharge. It can be divided into the following three parts: a positive electrode, a negative electrode, and an electrolyte, and various types of materials can be used. Graphite is the most widely used commercial anode material. For the anode, oxides such as layered lithium cobalt oxide, polyanions such as lithium iron phosphate (LiFePO4), lithium manganese oxide, and spinel are used. Figure 7 illustrates the specifications of the simulated battery.
| (6) |
| (7) |
Equation (6) is based on the primary internal equivalent circuit of the battery. V represents the battery voltage, R the battery resistance, I the battery current, soc the state of charge,Q the battery electric capacity, and E the battery power as a control parameter. Equation (7) shows that ESS SOC is calculated by calculating the SOC change amount using equivalent circuits and specifications, and then adding the SOC of the previous unit time. k denotes the unit time of the simulation [12].
4. Simulation Results
4.1 Results of the Power Distribution
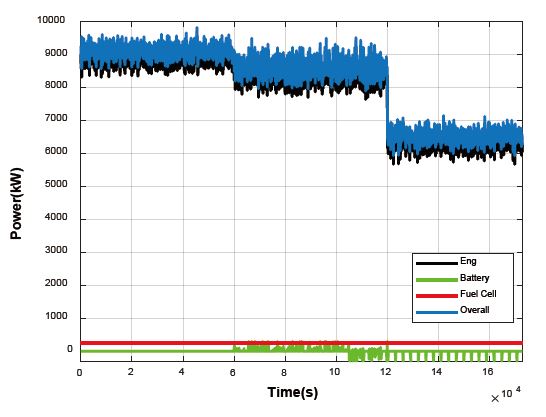
Figure 8 depicts the power distribution results for a hybrid tanker using dynamic programming. Because the engine capacity is considerably larger than that of a battery or fuel cell, the engine accounts for most of the total required power. The fuel cell operates at the rated power at the highest efficiency, and the battery repeats charging and discharging according to the SOC conditions.
4.2 Battery Simulation Results
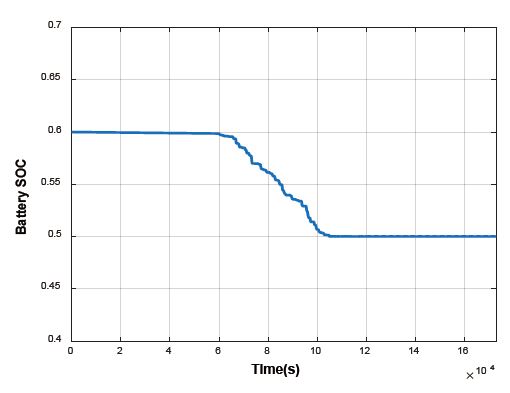
Figure 9 presents change in the battery SOC. Because the discharge is gradually continued from the initial value of 0.6, and because charging and discharging are repeated on the second day of the voyage, the SOC can retain the final maintenance target of 0.5. This is because the fuel consumption by the engine varies to maintain the battery SOC according to the dynamic programming method.
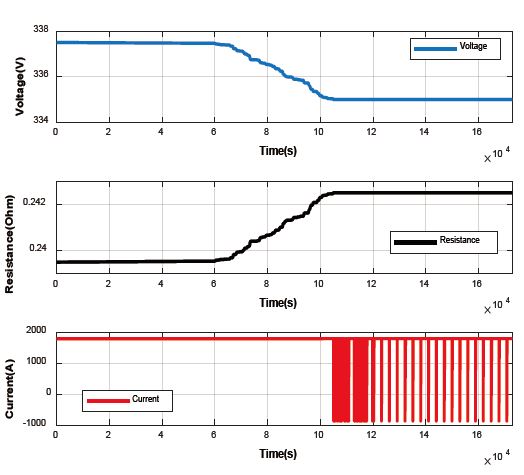
Figure 10 shows changes in the battery voltage, resistance, and current. Evidently, the battery current is positive when discharging and negative when charging. Although the voltage gradually decreases as the battery is used, the resistance increases, because the voltage and resistance values differ depending on the battery SOC.
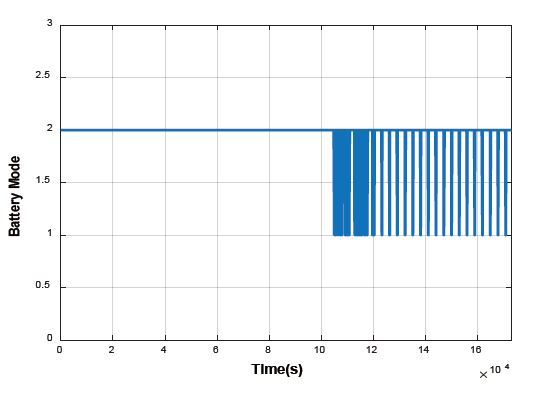
Figure 11 shows changes in the battery operation mode. Number 1 represents charging and 2 means discharging. Evidently, the repetition of charging and discharging maintains the battery SOC.
4.3 Engine Simulation Results
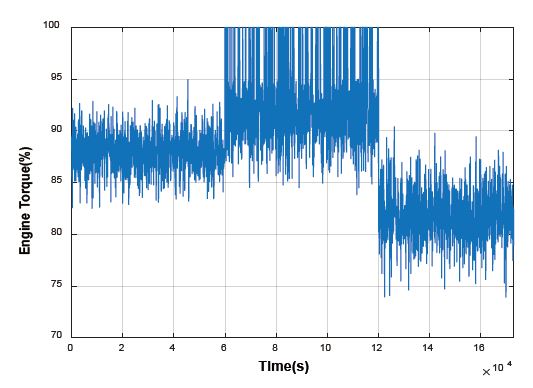
Figure 12 shows change in the engine torque over time. The change is expressed as the ratio of the calculated torque to the maximum torque and recorded as 75%-100%. Because the torque area of an engine that operates in an actual oil tanker exceeds 80%, the similarity between the simulated engine and a real engine was confirmed.
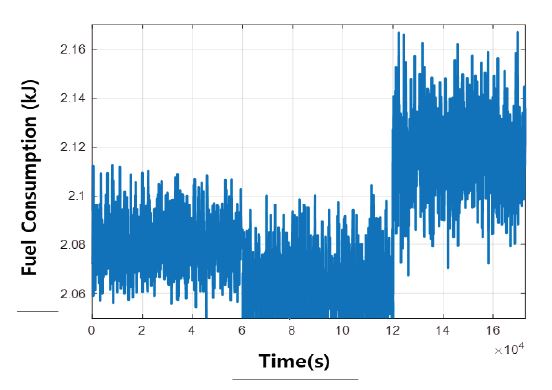
Figure 13 shows the fuel consumption (kJ) of the engine over time. After a day and half of sailing, the fuel consumption rate increased, indicating low fuel consumption efficiency. Here, the engine torque is between 75 % and 85 %, and it is between 85% and 95 % previously. According to the fuel consumption rate map, the 75 % – 85 % engine torque section has a higher fuel consumption over time (i.e., lower efficiency) than the 85 % – 95 % section. Therefore, the conclusions mentioned above can be drawn.
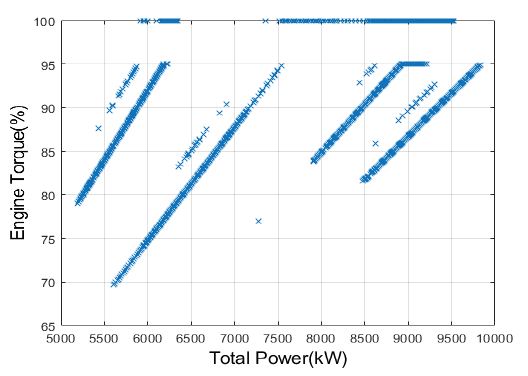
Figure 14 shows change in engine torque versus total power demand. Generally, engine torque increases linearly with total power demand. This might be because the engine handles most of the power, as it has considerably larger capacity than a battery or fuel cell. Additionally, the percentage of torque varies depending on the battery SOC, even for the same total power demand. This is because the power distribution method in agreement with the dynamic programming approach differs according to the case of charging and discharging the battery and the case to maintain the SOC.
5. Conclusion
Recently, emission regulations for ships have been tightened, and accordingly, the development of electric propulsion ships has become a major issue in the shipbuilding industry. Hybrid propulsion ships with engines or fuel cells are currently being developed, and this is a transitional concept for the development of 100% electric propulsion ships. As in vehicles, the power distribution strategy of hybrid power systems in ships is a major technical issue. This is because the operating point and operating efficiency of the power source can vary depending on the operating strategy. Accordingly, research is required on the operation optimization techniques of hybrid power sources. In this study, hybrid power distribution of a tanker was simulated using a dynamic programming method. There were three main power sources, namely a diesel engine, an SOFC, and a lithium-ion battery pack. Dynamic programming is a mathematical technique that minimizes the overall cost by dividing complex problems into detailed ones, and it is widely applied to the operating strategies of hybrid vehicles. In recent years, it has also been applied to hybrid systems that comprise fuel cells and batteries. In the case of large ships, in addition to their existing engines, dynamic programming provides an operating strategy capable of handling large power demands.
The power distribution optimization method introduced in this study was directed toward optimizing the required power profile for each unit-step objective function. Conversely, unlike the rule-based strategy applied to actual vehicle operations, if there is a driving speed or required power profile, the method is used to analyze the power distribution of the hybrid power source. Therefore, the method is not an analysis algorithm according to the optimization theory that can be applied to the controller of an actual hybrid vehicle but the power distribution result according to the optimization simulation. This result indicates the ratio of the engine power to total vehicle required power, and power split ratio, which can be applied to the controller of an actual hybrid vehicle.
The simulation results showed that the three power sources could handle the total required power while maintaining the battery SOC. The proposed optimization strategy may potentially be applied to large hybrid ships to be developed in the future.
Therefore, the power distribution optimization technique in hybrid vehicles can be applied to fuel cell hybrid ships to be developed in the future. Even in future hybrid ships, power distribution will emerge as an important technical issue.
Acknowledgments
This work was supported by the Sun Moon University Research Grant of 2020.
Author Contributions
Conceptualization, H. S. Yi; Methodology, H. S. Yi; Software, H. S. Yi; Simulation, H. S. Yi; Formal Analysis, H. S. Yi; Writing—Original Draft Preparation, H. S. Yi; Writing—Review & Editing, H. S. Yi.
References
-
T. H. Song, H. S. Yang, Y. S. Kim, and S. G. Lee, “A study on battery characteristics for electrical propulsion vessels according to charging current and harmonic discharging load,” Journal of the Korean Society of Marine Engineering, vol. 43, no. 2, pp. 114-119, 2019.
[https://doi.org/10.5916/jkosme.2019.43.2.114]

-
M. Shemeri and K. H. Park “Analytical study of effects of transportation and industrial growth on Kuwait air pollution,” Journal of the Korean Society of Marine Engineering, vol. 42, no. 8, pp. 647-652, 2018.
[https://doi.org/10.5916/jkosme.2018.42.8.647]

-
H. Y. Lee, J. R. Jeong, Y. I. Park, and S. W. Cha, “Energy management strategy of hybrid electric vehicle using battery state of charge trajectory information,” International Journal of Precision Engineering and Manufacturing-Green Technology, vol. 4, no. 1, pp. 79-86, 2017.
[https://doi.org/10.1007/s40684-017-0011-4]

-
H. S. Yi, J. B. Jeong, S. W. Cha, and C. H. Zheng, “Optimal component sizing of fuel cell-battery excavator based on workload,” International Journal of Precision Engineering and Manufacturing-Green Technology, vol. 5, no. 1, pp. 103-110, 2018.
[https://doi.org/10.1007/s40684-018-0011-z]

- H. S. Lee, J. S. Kim, Y. I. Park, and S. W. Cha, “Rule-based energy management strategies for hybrid vehicles,” International Journal of Precision Engineering and Manufacturing-Green Technology, vol. 3, pp. 231-237, 2016.
-
J. R. Jeong, D. H. Lee, C. W. Shin, D. B. Jeong, K. D. Min, S. W. Cha, and Y. I. Park, “Comparison of the fuel economy of series and parallel hybrid bus system using dynamic programming,” Transactions of the Korean Society of Automotive Engineers, vol. 21, no. 1, pp. 92-98, 2013 (in Korean).
[https://doi.org/10.7467/KSAE.2013.21.1.092]

-
H. S. Yi, “Study on a rule-based strategy of a fuel cell-engine generator-ESS marine hybrid system,” Journal of the Korean Society of Marine Engineering, vol. 43, no. 9, pp. 674-680, 2019 (in Korean).
[https://doi.org/10.5916/jkosme.2019.43.9.674]

-
C. H. Zheng, S. W. Cha, Y. I. Park, W. S. Lim, and G. Xu, “PMP-based power management strategy of fuel cell hybrid vehicles considering multi-objective optimization,” International Journal of Precision Engineering and Manufacturing, vol. 14, pp. 845-853, 2013.
[https://doi.org/10.1007/s12541-013-0111-1]

-
C. H. Zheng, “Fuel economy evaluation of fuel cell hybrid vehicles based on optimal control,” International Journal of Automotive Technology, vol. 13, pp. 517-522, 2012.
[https://doi.org/10.1007/s12239-012-0049-9]

-
J. S. Kim, H. M. Jeon, and D. K. Kim, “A study on characteristics of each operation mode for hybrid electric propulsion ship by operation circumstances,” Journal of the Korean Society of Marine Engineering, vol. 41, no. 3, pp. 245-250, 2017 (in Korean).
[https://doi.org/10.5916/jkosme.2017.41.3.245]

-
J. S. Oh, C. S. Jung, S. K. Park, M. H. Kim, “Availability of SOFC systems equipped with a recycled steam reforming fuel processor,” Journal of the Korean Society of Marine Engineering, vol. 40, no. 7, pp. 569-573, 2016 (in Korean).
[https://doi.org/10.5916/jkosme.2016.40.7.569]

-
J. S. Oh and Y. M. Kang, “Design of a hybrid power management system and cold start simulation in a fuel cell ship with PLECS,” Journal of the Korean Society of Marine Engineering, vol. 40, no. 5, pp. 429-436, 2016.
[https://doi.org/10.5916/jkosme.2016.40.5.429]


