Performance failure simulation and characteristic analysis of marine diesel engine turbocharging and gas-exchange system under different running conditions
Copyright © The Korean Society of Marine Engineering
This is an Open Access article distributed under the terms of the Creative Commons Attribution Non-Commercial License (http://creativecommons.org/licenses/by-nc/3.0), which permits unrestricted non-commercial use, distribution, and reproduction in any medium, provided the original work is properly cited.
Abstract
Taking a two-stroke marine diesel engine as an example, this study first builds up a thermodynamic simulation model of a turbocharging and gas-exchange system in MATLAB/Simulink, which is verified by the experimental results of a diesel engine under normal conditions. The boundary condition and corresponding model parameters are changed to simulate typical performance failures, including extremely high engine room temperature, intake filter blockage, intercooler fouling at the water side, overly high intercooler cooling water temperature, scavenging port fouling, clogged turbine nozzle, worn turbocharger bearing, and turbine exhaust passage fouling. The thermodynamic parameters of a diesel engine under different running conditions and performance failures are analyzed in terms of relative deviation, which demonstrates the relationship between the performance failures and thermodynamic parameters. This relationship could be mostly free of the engine running conditions. Finally, a normalization method is proposed to eliminate the influences of the engine room temperature and intercooler cooling water temperature. Thus, the performance failures could be detected according to the relative deviation of the proposed thermodynamic parameters under different running conditions throughout the entire engine working range. This method may provide a more practical foundation and possible breakthrough in the condition monitoring and failure diagnosis of marine diesel engines onboard ships.
Keywords:
Marine diesel engine, Turbocharging and gas‐exchange, Engine performance simulation, Failure diagnosis1. Introduction
With the rapid development of ship technology, ocean-going ships are tending to be large scaled and intelligent. When abnormal phenomena occur during ship operation, it becomes increasingly difficult for engineers in the engine room to quickly analyze the causes of failure and respond accurately in the face of complicated puzzling information. The development of marine engine condition monitoring and failure diagnosis technology can help engineers address failures in time, save over 30% overhaul costs, reduce maintenance labor by 37%, and avoid accidents [1]. Additionally, the utilization of equipment can be extended, resulting in considerable economic benefits. The thermodynamic parameters of marine diesel engines, with significant failure information, have the characteristics of little external interference, good information quality, a wide diagnosis range, and strong availability, and have been the main method for the condition monitoring of modern ships. However, the main marine diesel engine of a ship is a complex system that integrates mechanical, electrical, thermal, and hydraulic features. It is composed of a fuel injection system, a chamber combustion system, a turbocharging and gas-exchange system, and starting and reversing systems [2]. There are many potential failure excitations and abundant characteristic parameters. No simple corresponding relationship exists between them, which is also influenced by the ship navigation conditions and engine operation boundary conditions [3]. The acquisition of a definite and invariable relationship between performance failures and thermodynamic parameters under different running conditions is the main bottleneck in the application of failure diagnosis to large marine diesel engines [4].
The failure simulation of a marine diesel engine by numerical calculation of the thermodynamic working process is a good way to reveal the intrinsic relationship between the thermodynamic parameters of the main engine and its performance failures under different ship navigation and engine running conditions, to solve the problem of parameter optimization, and provide training samples for automatic failure diagnosis by establishing a quantitative relationship between performance failures and characteristics under various engine operating conditions. In recent years, some scholars have carried out performance failure simulations and characteristic analyses of marine diesel engines. Jose Antonio Pagán Rubioa et al. introduced a four-stroke high-speed marine diesel engine simulator with a one-dimensional thermodynamic engine model developed in the AVLBoost. Numerous typical failures can be simulated, and a failure database for diagnosis can be built in this way [5]. Theotokatos et al. employed mean value engine models based on a zero-dimensional model. The simulation accuracy was validated against experimental data from ship trials, which can be used for engine performance prediction [6]. Matulić et al. simulated the failure of a two-stroke low-speed marine diesel engine based on an AVL multi-zone combustion model and other models. It was verified with onboard measurements under 40%, 60%, and 100% engine load with 2%–7% inaccuracy [7]. However, the thermodynamic parameters of diesel engines are not only related to performance failures, but also to their operating conditions, such as the engine room air temperature and cooling water inlet temperature [8]. To consider these factors, considerably more modeling should be carried out, which is nearly impossible for marine diesel engines. The acquisition of a definite and invariable relationship between thermodynamic parameters and performance failures under different running conditions is the main bottleneck in the application of failure diagnosis for large marine diesel engines, which has not been successfully solved by previous researchers.
This study considers a MAN B&W 6S35ME-B type two-stroke marine diesel engine as an example. The turbocharging and gas-exchange simulation system of the engine is built-up in MATLAB/Simulink with an average thermodynamic simulation model, which is verified by experimental results under normal conditions. The boundary condition and corresponding model parameters were changed to simulate typical performance failures. The thermodynamic parameters of a diesel engine under different working conditions and performance failures were analyzed in terms of the relative deviation, which demonstrated the relationship between the performance failures and thermodynamic parameters. This relationship could be mostly free of the engine running conditions. Finally, a normalization method is proposed to eliminate the influences of the engine room temperature and intercooler cooling water temperature. Future research will be carried out to verify this method, which lays a more practical foundation for the performance failure diagnosis of the diesel engine turbocharging ang gas-exchange system.
2. Numerical Calculation Under Normal Conditions
2.1 Simulation Models
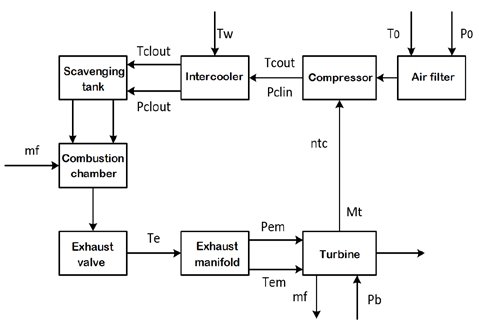
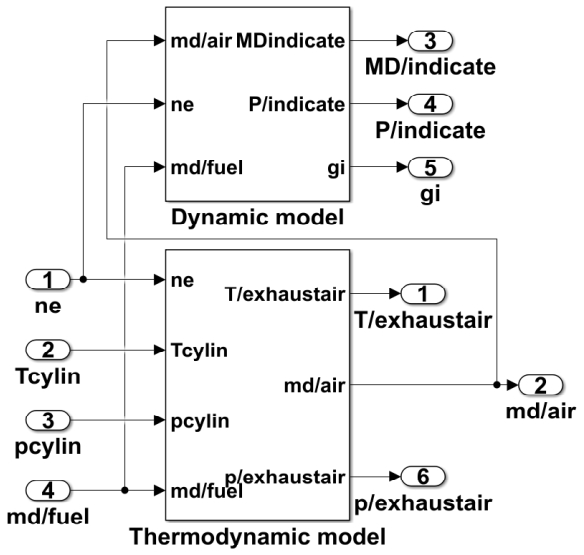
The simulated engine is a two-stroke marine diesel engine with a MAN TCR 22 turbocharger equipped with an emergency blower of 18.5 kW. The rated speed was 142 r/min, and the rated power was 3570 kW with a 350/1550 mm diameter/stroke. The outlet diameter of the compressor end was 290 mm, and the scavenging tank volume was 167 L. The exhaust main pipe diameter is 796 mm and the length is 604.6 mm. The maximum compression ratio of the turbo charger was 5.0. The entire diesel engine turbocharging and gas-exchange system is divided into seven subsystems: air filter, compressor, intercooler, scavenging tank, chamber combustion, exhaust valve, exhaust manifold, and turbine, as shown in Figure 1 [9]. The thermodynamic model of the diesel engine system is shown in Figure 2. The mathematical simulation models are described as follows.
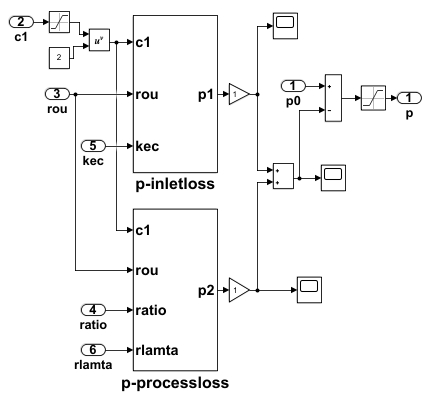
It is simplified as a one-dimensional steady flow unit with main losses of local pressure drop ΔP1 and drag loss along the way ΔP2[10].
| (1) |
| (2) |
| (3) |
Where ΔP1, ΔP2, ρ, l, d, P0 are local pressure loss at the inlet, resistance loss along the way, air density, pipe length, pipe diameter and compressor inlet pressure respectively. The loss coefficient ε is 0.5; The air viscous coefficient is taken as λ = 0.00001983 pa ∙ s. Air flow rate is v= mc/(ρAr), obtained from the compressor mass flow rate. Inlet equivalent area of compressor Ar is 0.039. The air filter simulation model in Matlab/Simulink is shown in Figure 3.
According to a one-dimensional adiabatic compression model with a compressor characteristic curve, the outlet temperature of the compressor [11]
| (4) |
The obtained torque of the compressor is
| (5) |
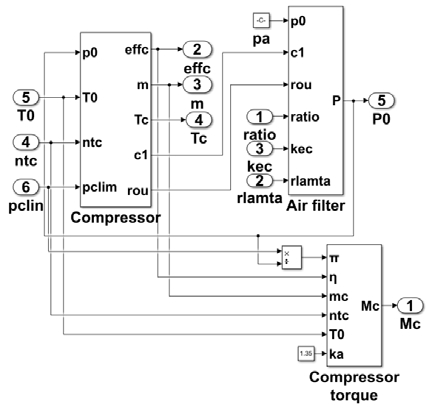
where Tcin and Tcout are the inlet and outlet temperatures of the compressor, respectively. ntc and πc are the supercharger speed and compressor pressure ratio respectively. Here, πc = Pclin/P0, and ηcs and are the adiabatic efficiency and air flow rate of the compressor, respectively. The polytropic compression index and gas constant k and R can be obtained with imported ntc and πc. The simulation model of the compressor in the MATLAB/Simulink is shown in Figure 4.
Owing to its high heat exchange efficiency, the thermal inertia of the intercooler can be generally ignored, and only the cooling effect and pressure loss are considered, which are treated as a throttle cooling and pressure dropping unit [12]. With the cooling coefficient ε, the outlet temperature of the intercooler is
| (6) |
The pressure drop of the intercooler is related to the air flow rate, and the outlet air pressure of the intercooler can be expressed as [12]
| (7) |
where, Tclin, Tclout, and Pclin, Pclout are the air temperature and pressure at the intercooler inlet and outlet, respectively. Tw is the cooling water inlet temperature of the intercooler, ε is its cooling coefficient, and is the rated air flow rate of the intercooler. The initial air pressure loss of the intercooler P0 is 400 Pa [13]. The simulation model of the intercooler in MATLAB/Simulink is shown in Figure 5.
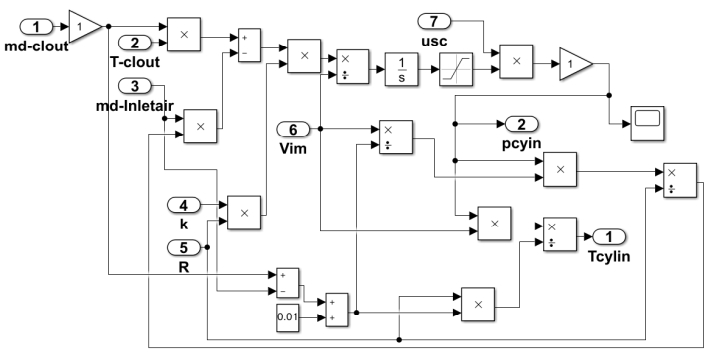
The scavenging tank is modeled using the volumetric method calculated by the energy, mass, and ideal gas law conservation equations. The air pressure in the scavenging tank is [14]
| (8) |
The outlet air temperature in the scavenging tank is obtained from the ideal gas law equation as
| (9) |
where, and Tim are the air pressure rate and temperature in the scavenging tank, respectively. Here, the scavenging tank volume Vim of the MAN B&W 6S35ME-B9 diesel engine was calculated to be 0.167 m3. md is the intake airflow of the engine. The scavenging tank simulation model in MATLAB/Simulink is shown in Figure 6.
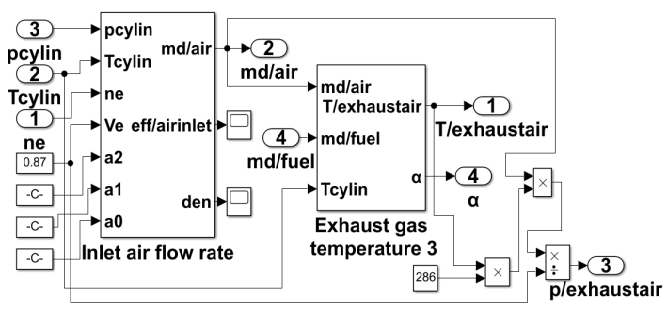
The intake air flow of a diesel engine is obtained from the theoretical airflow of the engine with a filled cylinder
| (10) |
where ηv is the charging efficiency of the engine, which is generally regarded as a single function of the running speed ne of the diesel engine. Here, ηv = a2 * ne2 + a1 * ne + a0,here a2 = −5.363 * 10−7, a1 = 2.04 * 10−3, a0 = 0.576107.
The exhaust gas temperature in the exhaust branch is expressed as
| (11) |
where, K and α are the increase factors of the exhaust gas temperature and excess air coefficient, respectively. The required air per fuel L0 is 14.3. The exhaust gas temperature rise factor K is a function of the air-fuel ratio [13], which is interpolated with the excess air coefficient. In MATLAB/Simulink, the simulation model of the exhaust branch temperature of the diesel engine is shown in Figure 7.
Output torque of diesel engine
| (12) |
Its fuel oil consumption
| (13) |
Where mf, Ti, Te, gi are the fuel injection quantity per cylinder, output torque, exhaust gas temperature and fuel oil consumption rate of the diesel engine respectively. The lower fuel heat value Hu is 42700 kJ/().The evacuation volume per cylinder Vd is 0.87 m3. ηi is the indicated working efficiency of engine. The combustion dynamics and thermodynamic simulation model of combustion in the cylinder in Matlab/Simulink is shown in Figure 8.
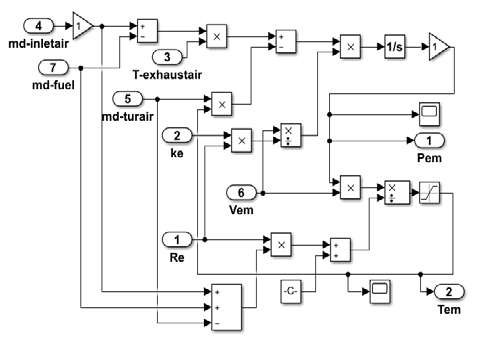
The exhaust gas in the manifold is also modeled with the "Volumetric method" and exhaust gas pressure
| (14) |
The gas temperature in the exhaust manifold is obtained from the ideal gas equation law
| (15) |
where and Tem are the gas pressure rate and temperature in the exhaust manifold, respectively. Here, the mixed gases in the exhaust manifold mout are md + mf, and the exhaust pipe volume Vem is 0.3 m3. The exhaust manifold simulation model in MATLAB/Simulink is shown in Figure 9.
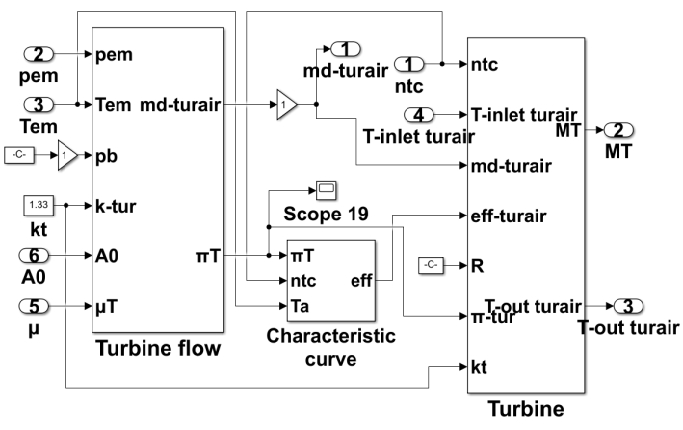
The turbine efficiency is fitted by the embedded RBF function in MATLAB by adopting the s-function from the turbine characteristic curve [14].
| (16) |
The turbine outlet temperature is
| (17) |
The turbine output torque is
| (18) |
The turbine is equivalent to a throttle nozzle for a simplified calculation. The gas flow, is obtained as a one-dimensional isentropic expansion process:
| (19) |
When :
| (20) |
When :
| (21) |
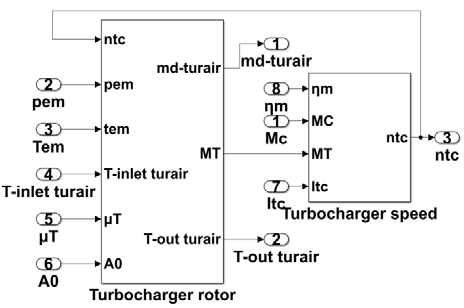
where, Ttout, Mt, mt, ηts, and Fres (A0 in the following figure) are the gas outlet temperature, turbine output torque, gas flow, turbine efficiency, and gas flow area, respectively. The turbine expansion ratio πt was Pem/Pb. ψ, μT are the flow function and flow coefficient, respectively, where Fres is 0.039 and μT is 0.7. The turbine simulation model in MATLAB/Simulink is shown in Figure 10.
The turbocharger rotating speed can be obtained from the D'Alembert's principle as
| (22) |
where, ηm and Itc are the turbocharger mechanical working efficiency and turbocharger rotating inertia, respectively, where ηm is 0.89 and Itc is 16. The turbine rotor simulation model in MATLAB/Simulink is shown in Figure 11.
2.2 Simulation Results
Thermodynamic parameters such as the running speed, power, and intake air temperature of the diesel engine were recorded in an engine laboratory at 25%, 50%, 75%, and 90% engine operation conditions. A comparison between the experimental and simulated results is presented in Table 1.
It is verified that the errors of most measured and calculated parameters are within 5%, except for a few parameters. These results indicate that the simulation models of the diesel engine turbocharging and gas-exchange system in MATLAB/Simulink are feasible, and the thermodynamic parameters from the diesel engine simulation calculation, such as the temperature, pressure, speed, and fuel consumption rate, can reflect the condition of the engine under different operating conditions.
3. Simulation and Analysis of Performance Failures
3.1 Performance Failure Simulation
Based on the diesel engine simulation model mentioned above, some performance failures of the super-charging and gas-exchange system were simulated by changing the model parameters to reveal the variation rules of each thermal parameter under different failure conditions. Additionally, the variation in the boundary conditions of a diesel engine also affect its operating performance and thermal parameters, such as the compressor intake air temperature and intercooler cooling water inlet temperature. For ease of representation, these are collectively referred to as performance failures; the performance failures for some failure states and the setting of the model parameters are listed in Table 2.
In addition to the conventional thermodynamic parameters, some combined parameters are proposed here to indicate the performance failure of diesel engine, including the compressor coefficient Nc1, turbine coefficient Nt1, compressor coefficient Nc2, turbine coefficient Nt2, intercooler cooling coefficient Nc, intercooler flow coefficient Ncf, and turbine flow coefficient Ntf.
| (23) |
| (24) |
| (25) |
| (26) |
| (27) |
| (28) |
| (29) |
These thermodynamic parameters are represented in terms of the relative deviation under different running conditions and performance failures [15].
| (30) |
where x and x0 are the thermodynamic parameters of the diesel engine model under failure and normal conditions, respectively.
3.2 Performance Failures Analysis
The simulated results of turbocharging and gas-exchanging systems under different running conditions and various
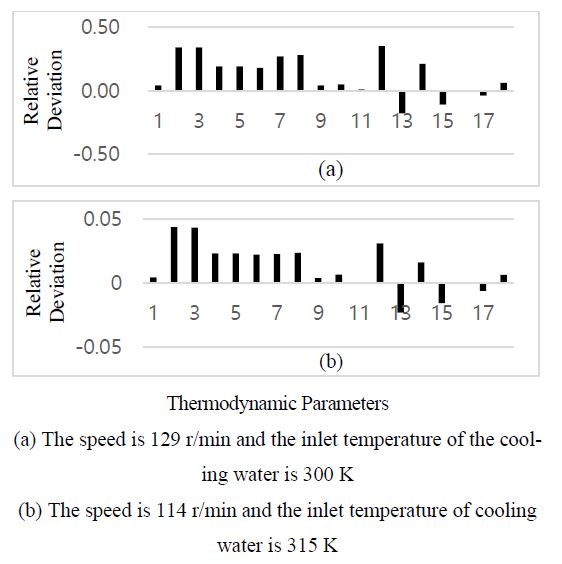
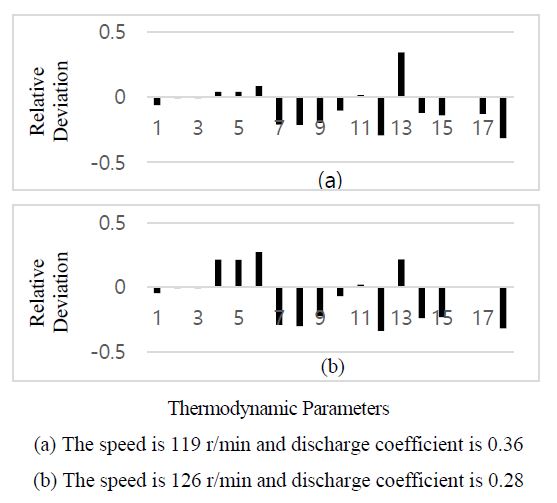
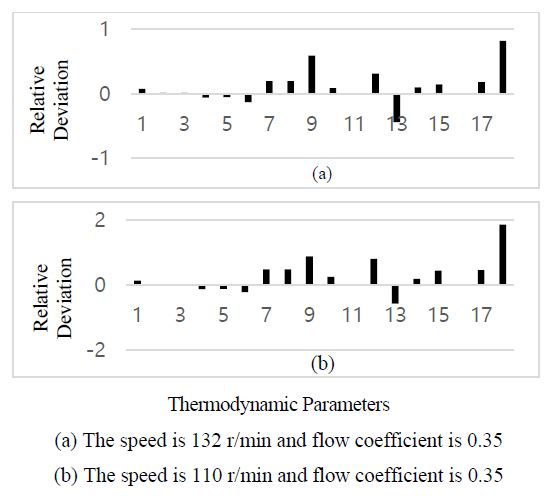
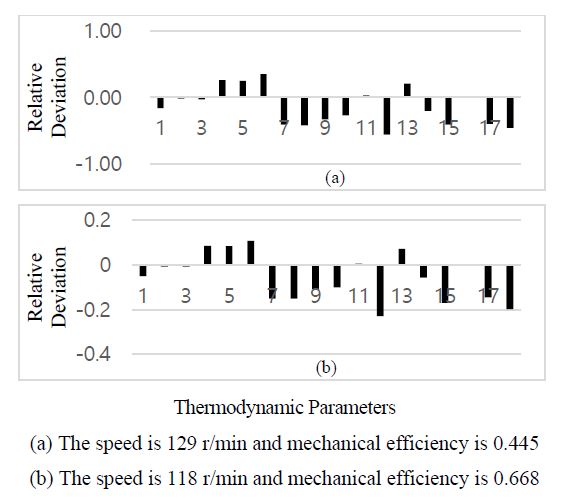
performance failures were analyzed using 18 thermodynamic parameters, as shown in the following figures. The 18 calculated thermodynamic parameters are represented by different numbers, as listed in Table 3.
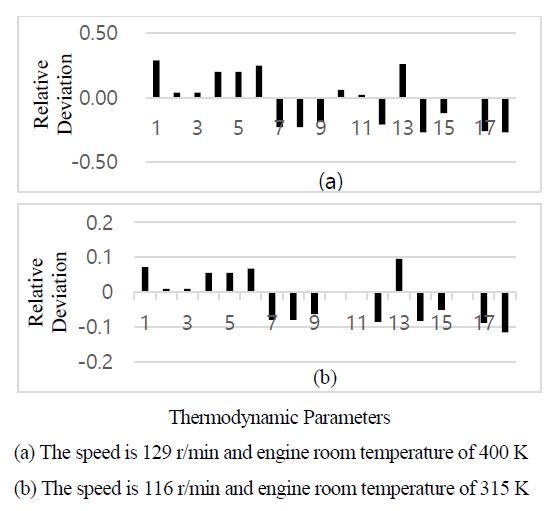
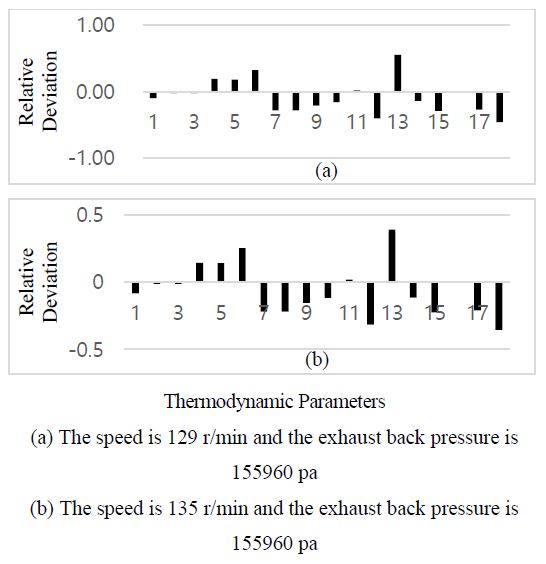
Owing to the different shipping routes, the influence of the engine room temperature cannot be ignored, and the engine inlet air temperature could be different. The relative deviations of the thermodynamic parameters under different running speeds and engine room temperatures are shown in Figure 12. It can be observed that when the engine room temperature rises, the decrease in inlet air density worsens the chamber combustion inside the cylinder. The exhaust air temperature Te, exhaust gas temperature in manifold Tem, and turbine outlet gas temperature Ttout of the diesel engine increase significantly, whereas the intercooler inlet air pressure Pclin, air pressure in the scavenging tank Pim, and exhaust air pressure in the manifold Pem decrease. The most obvious change was the rise in the compressor outlet air temperature Tcout. With respect to the combined parameters, the turbine coefficient Nt1 increases the most obviously, whereas the compressor coefficient Nc1, compressor coefficient Nc2, turbine coefficient Nt2, intercooler flow coefficient Ncf, and turbine flow coefficient Ntf all decrease to varying degrees.
Comparing Figure 12 (a) and Figure 12 (b), it can be observed that the variations in the various parameters under different running conditions are quite similar. This indicates that the performance failure behavior of characteristic parameters in terms of the relative deviation is quite clear and immovable, even under different running conditions of the diesel engine, which is greatly convenient for failure diagnosis.
The pressure drop due to resistance along the way of the filter mesh was simulated by changing the length diameter ratio of the filter (l/d) in Equation (2) to simulate the blockage of the air filter in the diesel engine.
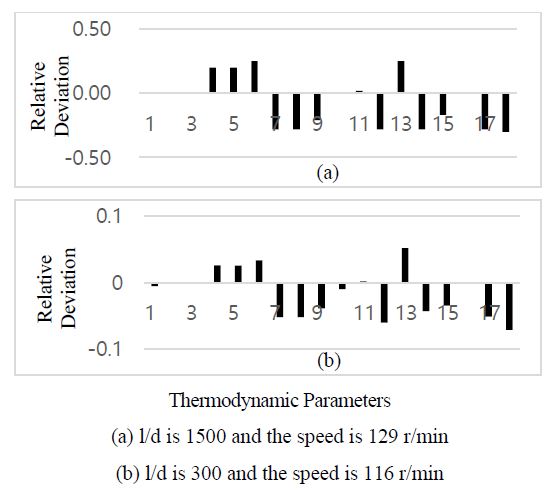
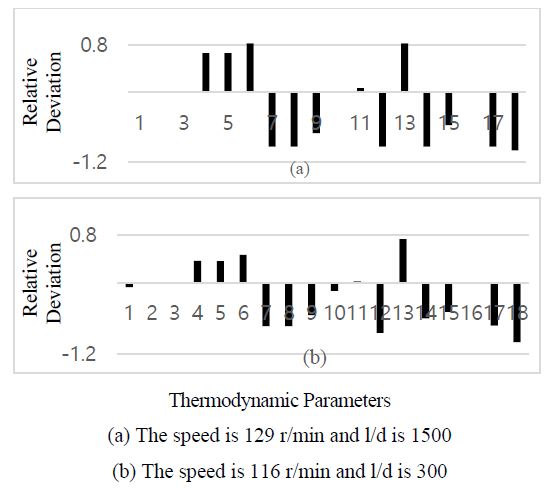
Figure 13 shows the relative deviation of the characteristic parameters of the diesel engine when l/d is 1500 and 300 at different running speeds. It can be observed that when the air filter is blocked, the inlet air pressure of the intercooler Pclin, outlet air pressure of the intercooler Pclout, and exhaust gas pressure in manifold Pem decrease, whereas the exhaust gas temperature Te, exhaust gas temperature in the manifold Tem, and turbine outlet gas temperature Ttout of the diesel engine increase, and the outlet air temperature of the compressor Tcout, intercooler outlet air temperature Tclout, and scavenger air temperature Tim do not change significantly. Additionally, the compressor coefficient Nc2, turbine coefficient Nt2, intercooler flow coefficient Ncf, and turbine flow coefficient Ntf decrease significantly. It was found that when the air filter is blocked, the most affected characteristic parameter is the inlet pressure of the compressor, resulting in insufficient air into the compressor and poor combustion inside the cylinder; thus, the exhaust gas temperature increases in the exhaust manifold.
The fouling in the intercooler water passage also has a direct impact on the intake air of diesel engines.
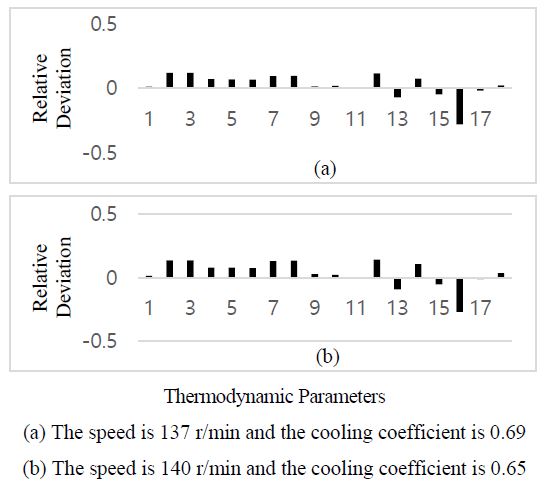
As shown in Figure 14, owing to the fouling on the water side of the intercooler, the cooling coefficient decreases, and it is difficult for air to exchange heat with the cooling water. The intercooler outlet air temperature Tclout, scavenging air temperature Tim, exhaust gas temperature Te, exhaust gas temperature in manifold Tem, turbine outlet gas temperature Ttout, intercooler inlet air pressure Pclin, and air pressure in scavenging tank Pim all increase significantly. The compressor coefficient Nc1 and compressor coefficient Nc2 increase significantly, whereas the turbine coefficients Nt1, Nt2, and Nc decrease. The turbocharger speed increases slightly, which is similar to that of the extremely high intercooler cooling water temperature described below. Here, the intercooler cooling coefficient Nc decreases significantly, whereas it remains unchanged under other failures. Therefore, the intercooler cooling coefficient Nt could be used as a unique characteristic parameter for the intercooler water fouling failure at both the air and water sides.
The intercooler has a direct impact on the intake air temperature of the diesel engine, especially on the intake air temperature of the cylinder. When the intercooler inlet cooling water temperature increases, the intake air flow slightly decreases, leading to an increase in the compressor outlet air temperature Tcout, intercooler outlet air temperature Tcout, scavenging air temperature Tim, exhaust gas temperature Te, exhaust gas temperature in manifold Tem, turbine outlet gas temperature Ttout, intercooler inlet air pressure Pclin, and scavenging air pressure Pim. The compressor coefficient Nc1 and compressor coefficient Nc2 increase significantly, whereas the turbine coefficient Nt1, turbine coefficient Nt2, and intercooler flow coefficient Ncf decrease, and the turbocharger rotating speed increases slightly, as shown in Figure 15.
With the blockage of the scavenging port, the intake air flow into the cylinder decreases significantly, which worsens the fuel combustion inside the cylinder. The exhaust gas temperature Te, exhaust gas temperature in the manifold Tem, and turbine outlet gas temperature Ttout increase significantly, whereas the intercooler inlet air pressure Pclin, scavenging air pressure Pim, and exhaust gas pressure in the manifold Pem decrease. The most obvious increase is the compressor outlet air temperature Tcout, as shown in Figure 16. The turbine coefficient Nt1 increases most obviously, whereas the compressor coefficients Nc1, Nc2, Nt2, Ncf, and Ntf all decrease to varying degrees. The characteristic behavior is similar to that of air filter fouling, turbocharger bearing wear, and high inlet air temperature.
Blocked turbine nozzles can block gas flow into the turbine, which significantly increases the exhaust gas pressure in the manifold Pem, whereas the exhaust temperature Te of the diesel engine, exhaust manifold temperature Tem, and turbine outlet temperature Ttout slightly decrease. When the turbine nozzle is blocked, its most direct influence is on the exhaust gas pressure in the manifold Pem and turbine flow coefficient Ntf, which could be used as two characteristic parameters for turbine nozzle blockage failure, as shown in Figure 17.
When the turbine rotor is mechanically worn out, its compressor air compression capacity and compressor air flow decrease, which cause an increase in the exhaust temperature Te, exhaust gas temperature in manifold Tem, and turbine outlet gas temperature Ttout, whereas the inlet air pressure Pclin, scavenging air pressure Pim, exhaust gas pressure in the manifold Pem, and turbocharger rotating speed ntc decrease significantly, similar to the case in the turbine outlet passage fouling failure, as shown in Figure 18 and 19.
The turbine outlet passage fouling was simulated by increasing the back pressure during simulation. As shown in Figure 19, a higher back pressure of the turbine causes an increase in the exhaust gas temperature Te, exhaust gas temperature in manifold Tem, and turbine outlet gas temperature Ttout. The most direct impact is the decrease in the turbine working capacity, which reduces the turbocharger speed ntc, intercooler inlet air pressure Pclin, intercooler outlet air pressure Pclout, scavenging air pressure Pim, and exhaust gas pressure in manifold Pem. With respect to the combined parameters, the increase in the turbine coefficient Nt1 is the most obvious, whereas the compressor coefficient Nc1, compressor coefficient Nc2, turbine coefficient Nt2, intercooler flow coefficient Ncf, and turbine flow coefficient Ntf all decrease to some extent.
In conclusion, the characteristic parameters of extremely high inlet air temperature, intake air filter blockage, scavenging port fouling, worn turbocharger bearing, and turbine outlet passage fouling exhibit similar behavior even under different operating conditions of the diesel engine. However, when the engine room temperature is extremely high, the compressor outlet temperature Tcout increases significantly but decreases to a certain extent in the other failures, which provides a distinguishing parameter from other failures. The engine room temperature can be measured directly, the blocked air filter can be monitored with the differential pressure of the intake air filter, and the turbine back pressure can also be measured directly at the turbine outlet. Additionally, the worn turbocharger bearing can be judged from its vibration and scavenging port fouling can be detected by the pressure difference between the intercooler outlet air and scavenging air; thus, these different failures can be identified. The characteristic parameter behavior of the extremely high intercooler cooling water temperature is considerably similar to that of intercooler fouling at the water side, but the fouled intercooler can be determined directly by the intercooler cooling coefficient Nc, and the cooling water temperature in the intercooler can be measured directly. These two failures were the most easily distinguished. The most obvious characteristic of the turbine nozzle blockage is the obvious increase in the exhaust gas pressure in manifold Pem and turbine flow coefficient Ntf, which is not found in the other failures. In other words, the performance failure diagnosis of diesel engine turbocharging and gas-exchanging systems can be eventually realized with some other parameters and information.
4. Normalization of Parameters
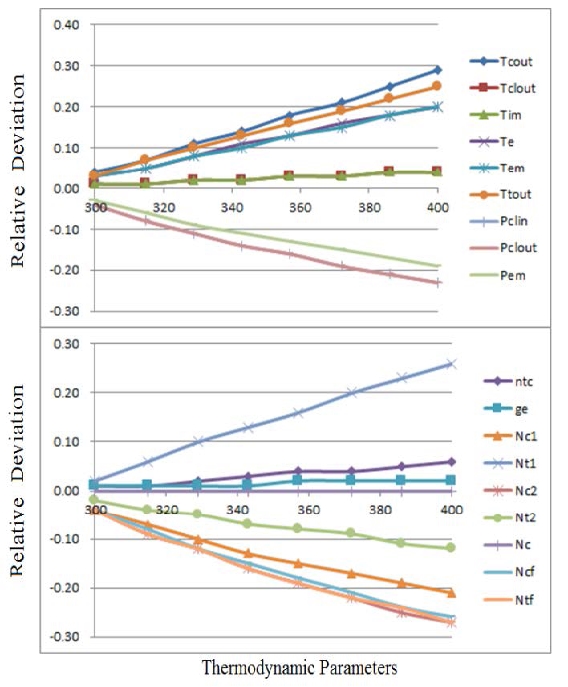
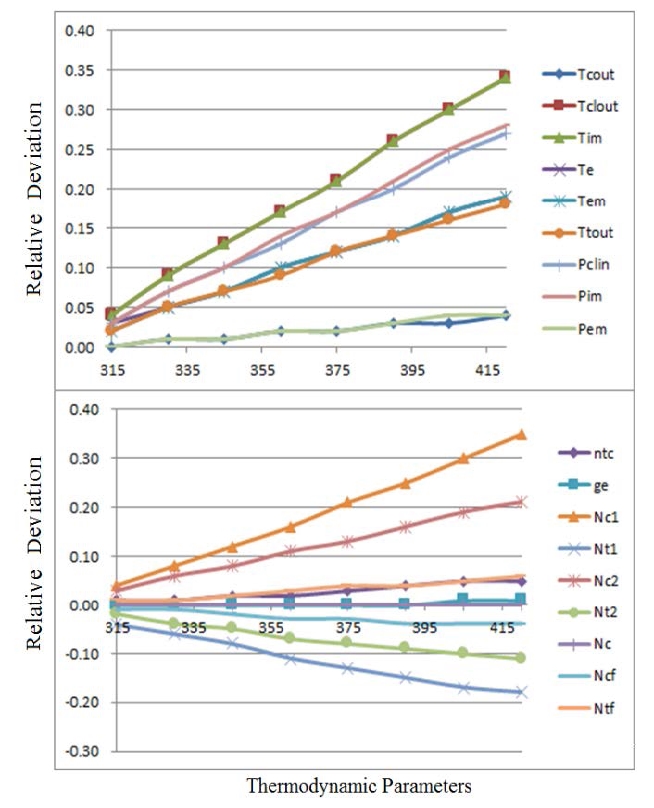
In fact, extremely high inlet air temperatures and intercooler cooling water temperatures are not engine performance failures, but are different working boundary conditions, which change the thermodynamic parameters of the engine. Therefore, before performance failure diagnosis, the normalization of the engine boundary conditions should first be carried out to eliminate the influence of the different conditions. Figures 20 and 21 show the changing trends of the 18 characteristic parameters when the engine room temperature increases from 286 K to 400 K and the intercooler cooling water temperature increases from 315 K to 420 K at engine speeds of 129 r/min and 75% load, respectively.
The same method can also be used to eliminate the influence of the intercooler cooling water temperature.
It can be observed that the relative deviations of these parameters change linearly with the change in the engine room temperature and intercooler cooling water temperature. If the 286 K engine room temperature and 300 K intercooler cooling water temperature are set as the reference boundary conditions, the thermodynamic parameters under different conditions are normalized to the reference condition according to the actual engine room temperature and intercooler cooling water temperature. The relative deviation analysis and failure diagnosis of the characteristic parameters can be carried out. The specific method uses the Newton interpolation formula to calculate the relative deviation value ε at the actual temperature of a certain engine compartment at z°K. According to Equation (32), the thermal parameter x is calculated after normalizing to the reference running condition x′.
Assuming the actual engine room temperature is z°K, the relative deviation ε of a thermodynamic parameter x could be normalized between 286 K and 400 K using the Newton interpolation method.
| (31) |
Normalized thermodynamic parameter
| (32) |
Subsequently, the normalized parameter x′ can be compared to the parameter under the engine normal condition x0 to obtain the relative deviation necessary for failure diagnosis.
Although the characteristic parameters have similar behaviors under different running conditions for these failures, the deviation amplitudes are quite different, as shown in Figures 12-19. Therefore, before the performance failure diagnosis, it is necessary to normalize the relative deviation to eliminate the influence of different running conditions before failure diagnosis. All the 18 relative deviations under different running conditions will be unified to a 1.0 maximum scale. Suppose the maximum relative deviation among the 18 relative deviation values is ε1, which is normalized to 1.0- or -1.0, and the other relative deviation ε0 is normalized as ε:
| (33) |
Taking the intake air filter blockage as an example, as shown in Figure13, the relative deviations under the two running conditions are quite different and cannot be used directly for failure diagnosis. After normalization, the two sets of parameters have nearly the same scale and are comparable. In this way, the performance failures could be identified under any engine running condition with different failure severities. The severity of the failure can be directly determined using the relative deviation scale before normalization.
5. Conclusion
The proposed average thermodynamic simulation model for diesel engine turbocharging and gas-changing systems is available in MATLAB/Simulink. By changing the boundary conditions and relevant model parameters, performance failures including extremely high engine room temperature, intake filter blockage, intercooler fouling at the water side, extremely high intercooler cooling water temperature, scavenging port fouling, clogged turbine nozzle, worn turbocharger bearing, and turbine exhaust passage fouling can be simulated. The relative deviations of the thermodynamic parameters under different boundary conditions and different failures are analyzed, demonstrating the inherent relationship between the thermodynamic parameters and performance failures and could be mostly free of engine running conditions. By normalizing the parameters, the influence of different boundary conditions and running conditions could be eliminated, and the performance failure diagnosis of the diesel engine under different running conditions could be realized in practice. Further research will be carried out to verify the feasibility of this method in the application of the failure detection of diesel engines on board ships.
Nomenclature
| ΔP1 : | local pressure loss at air filter inlet |
| ΔP2 : | resistance loss along air filter way |
| ρ : | inlet air density |
| l : | pipe length of the air filter |
| d : | pipe diameter of the air filter |
| P0 : | compressor inlet pressure |
| λ : | inlet air viscous coefficient |
| v : | inlet air flow rate |
| Ar : | equivalent inlet area of compressor |
| Tcin : | inlet air temperature of the compressor |
| Tcout : | outlet air temperature of the compressor |
| ntc : | turbocharger rotating speed |
| πc : | compressor pressure ratio |
| k : | polytropic compression index |
| R : | gas constant |
| Tclin : | air temperature at intercooler inlet |
| Tclout : | air temperature at intercooler outlet |
| Pclin : | air pressure at intercooler inlet |
| Pclout : | air pressure at intercooler outlet |
| Tw : | cooling water inlet temperature of intercooler |
| ε : | cooling coefficient of cooling water |
| mc0 : | rated air flow rate of intercooler |
| ΔP0 : | initial air pressure loss of intercooler |
| Pim : | air pressure in scavenging tank |
| Tim : | air temperature in scavenging tank |
| Vim : | scavenging tank volume |
| md : | intake air flow of engine |
| ηv : | charging efficiency of engine |
| ne : | running speed of engine |
| K : | increase factor of exhaust gas temperature |
| α : | excess air coefficient |
| mf : | injected fuel quantity per cylinder |
| Ti : | output torque of engine |
| Te : | exhaust gas temperature of engine |
| gi : | fuel oil consumption rate of engine |
| Hu : | fuel oil low heat value |
| Vd : | evacuation volume per cylinder |
| ηi : | indicated working efficient of engine |
| Pem : | gas pressure in exhaust manifold |
| Tem : | temperature in exhaust manifold |
| mout : | mixed gases flow in exhaust manifold |
| Vem : | exhaust manifold volume |
| : | similar rotating speed of turbine |
| Ttout : | turbine gas outlet temperature |
| Mt : | turbine output torque |
| mt : | gas flow of turbine |
| ηts : | turbine working efficient |
| Fres : | gas flow area of turbine |
| πt : | turbine expansion ratio |
| μt : | flow coefficient of turbine |
| ψ : | flow function coefficient of turbine |
| ηm : | turbocharger working efficiency |
| Itc : | turbocharger rotating inertia |
| l/d : | aspect ratio of compressor filter |
| μs : | intake air flow coefficient |
| μT : | turbine nozzle flow coefficient |
| Pb : | turbine back pressure |
| Nc1 : | compressor coefficient 1 |
| Nc2 : | compressor coefficient 2 |
| Nc : | intercooler cooling coefficient |
| Nt1 : | turbine coefficient 1 |
| Nt2 : | turbine coefficient 2 |
| Ncf : | intercooler flow coefficient |
| Ntf : | turbine flow coefficient |
Acknowledgments
This research work was supported by the Science & Technology Commission of Shanghai Municipality and Shanghai Engineering Research Center of Ship Intelligent Maintenance and Energy Efficiency under Grant 20DZ2252300.
Author Contributions
Conceptualization, Y. Hu; Methodology, C. Zeng and M. Wang; Software, J. Jiang; Formal Analysis, Y. Hu and C. Zeng; Investigation, M. Wang; Resources, C. Zeng; Data Curation, M. Wang; Writing-Original Draft Preparation, Y. Hu and C. Zeng; Writing-Review & Editing, Y. Hu; Visualization, M. Wang; Supervision, Y. Hu; Project Administration, Y. Hu; Funding Acquisition, Y. Hu.
References
- Hu Yihuai, Accident Analysis and Safety Assessment of Marine Machinery System, Beijing, China Communications Press, 2013:94-100 (in Chinese).
-
D. T. Hountalas and A. D. Kouremenos, “Development and application of a fully automatic troubleshooting method for large marine diesel engines,” Applied Thermal Engineering, vol. 19, no. 3, pp. 299-324, 1999.
[https://doi.org/10.1016/S1359-4311(98)00048-9]

-
D. T. Hountalas, “Prediction of marine diesel engine performance under fault conditions,” Applied Thermal Engineering, vol. 20, no. 18, pp. 1753-1783, 2000.
[https://doi.org/10.1016/S1359-4311(00)00006-5]

-
N. F. Sakellaridis, S. I. Raptotasios, A. K.Antonopoulos, and et al., “Development and validation of a new turbocharger simulation methodology for marine two stroke diesel engine modelling and diagnostic applications,” Energy, no. 91, pp. 952-966, 2015.
[https://doi.org/10.1016/j.energy.2015.08.049]

-
J. A. P. Rubio, F. Vera Garcia, and et al., “Marine diesel engine failure simulator based on thermodynamic model,” Applied Thermal Engineering, vol. 144, pp. 982-995, 2018.
[https://doi.org/10.1016/j.applthermaleng.2018.08.096]

-
G. Theotokatos, C. Guan, H. Chen, and I. Lazakis, “Development of an extended mean value engine model for predicting the marine two-stroke engine operation at varying settings,” Energy, vol. 143, pp. 533-545, 2018.
[https://doi.org/10.1016/j.energy.2017.10.138]

-
N. Matulić, G. Radica, and S. Nižetić, “Engine model for onboard marine engine failure simulation,” Journal of Thermal Analysis and Calorimetry, vol. 141, pp. 119-130, 2020.
[https://doi.org/10.1007/s10973-019-09118-3]

- L. Pinfang and C. Zhenxiong, “Impact of environmental conditions on operation of main engines on ships and management strategies,” Journal of Jimei University (Natural Science Edition), vol. 10, no. 1, pp. 49-52, 2005 (in Chinese).
- G. Hongzhong, Thermal Process Simulation Calculation of Turbocharged Diesel Engine, Shanghai, Shanghai Jiaotong University Press, 1985 (in Chinese).
- L. Lianxi and H. Zhiyong, and Liu Chi, “Simulation and optimization of flow resistance and noise characteristics of air cleaner,” Automotive Engineering, vol. 33, no. 12, pp. 1092-1097, 2011 (in Chinese).
- W. Haiyan, H. Weijian, and Z. Xusheng, “Turbocharger thermodynamic model and diesel engine dynamic simulation,” Internal Combustion Engine Engineering, vol. 38, no. 2, pp. 128-134, 2017 (in Chinese).
- G. Linfu, M. Chaocheng, and S. Xin, “Establishment, verification and simulation of steady state matching model between leaved ordinary turbocharger and engine,” Internal Combustion Engine Engineering, no. 3, pp. 66-68, 2003 (in Chinese).
- S. Yingmei and G. Shilun, “Average model and simulation of turbocharged diesel engine,” Diesel Engine Design and Manufacture, no. 2, pp. 19-23, 2004 (in Chinese).
- L. Ruishui, Research on Modeling and Model Checking Methods of Average Value of Turbocharged Diesel Engine, M. S. Thesis, Beijing University of Technology, China, 2014 (in Chinese).

