A hybrid method for the determination of the minimum number of transport vehicles in a shipyard
Copyright Ⓒ The Korean Society of Marine Engineering
This is an Open Access article distributed under the terms of the Creative Commons Attribution Non-Commercial License (http://creativecommons.org/licenses/by-nc/3.0), which permits unrestricted non-commercial use, distribution, and reproduction in any medium, provided the original work is properly cited.
Abstract
Shipbuilding companies use transport vehicles and often sign a rental contract with third-party vendors. To avoid including unnecessary vehicles in the contract, it is important to determine the proper number of transport vehicles when the contract is made. This paper presents a hybrid method for the determination of the minimum number of transport vehicles using a given tasks cenario in a shipyard. The method uses a genetic algorithm for making task-allocation decisions and uses an exact method for making the tasksequence decisions for individual vehicles. The exact method ensures optimality, and thus the hybrid method could have better performance than the genetic algorithm that alone determines both task-allocation and task-sequence decisions. This paper compares the performance of the hybrid method with that of the genetic algorithm using real industry data. The comparison shows that the hybrid method has improved performance, which tends to be more significant as the problem becomes more difficult to solve.
Keywords:
Hybrid genetic algorithm, Exact method, Shipbuilding, Vehicle scheduling, Optimization1. Introduction
Shipyards build massive products that comprises a large number of units of different sizes and weights. One important facility of the shipyards is the transport vehicles that move blocks or assembly units from one place to another. The number of such vehicles that a shipyard needs is dependent on the volume of material flows of the shipyard. This volume can vary due to the varying needs of newly built ships, which are highly dependent on the markets. Many shipyards tend to operate the transport vehicles and sign rental contracts with third-party vendors instead of having their own vehicles. To reduce material handling costs, it is therefore important to determine the proper number of transport vehicles when the contracts are made. If the shipyards reserve more vehicles than that they need, then the cost can increase for the extra (and unused) equipment. If they reserve fewer vehicles, then the transport needs are often delayed. The ideal number can be determined based on the optimal scheduling of the vehicles. The decision-makers can determine the number considering some safety margins on the minimum number.
There have been research papers associated with the optimal scheduling of transport vehicles in shipyards. Ju et al. [1] present an iterative approach that uses the lower bound of the minimum number of transporters in the determination of the optimal schedule. The scheduling optimization continues to increase until a feasible schedule is found. Lee et al. [2] use a heuristic algorithm to determine transporters’ optimal schedule that has the minimum weighted sum in the delays of picking blocks and the delay times of transporters. The algorithm is based on a network flow model and can work in a dynamic operating environment such as the change of block transportation requirements. Roh and Cha [3] propose a hybrid method for a block transportation problem in which the objective is to minimize the travel time without loading or interference of transporters on the road. The hybrid method comprises two stages: the first stage uses an ant colony optimization to make block allocation decisions for transporters. The second stage uses a GA that determines the transportation sequence of the blocks of each transporter. Heo et al. [4] further develop the method of Roh and Cha [3] considering a damaged path in the scheduling problem. Cha et al. [5] use the method [4] in an optimal planning system. Park and Seo [6] used a heuristic referred to as Greedy Randomized Adaptive Search Procedures (GRASPs) for the transporter scheduling and routing problem at a shipyard, in which the objective is to maximize the workload balance of transports making sure that all the transport tasks are completed in a predetermined period. Joo and Kim [7] present a self-evolution algorithm (SEA) in the optimal scheduling of transporters. The SEA is similar to a GA but involves self-reproduction operators that use only a single parent in creating a new chromosome. The authors use a dispatching rule in decoding a chromosome to a transporters’ schedule that prevents infeasible solutions from occurring.
Meta-heuristic algorithms have often been used for optimal scheduling of transport vehicles in shipyards because the computation time of exact methods increases exponentially as the problem size becomes larger. However, there are variations in performance due to the stochastic nature of the meta-heuristic algorithms. These variations can be more significant when the complexity of the problem increases. The previous methods often use only a meta-heuristic algorithm or an exact method. Although there are hybrid methods, the methods combine one meta-heuristic algorithm and another. To take advantages of both meta-heuristic algorithm and exact method, this paper presents a hybrid method that combines a meta-heuristic algorithm and an exact method for the determination of the minimum number of transport vehicles in a shipyard.
2. Mathematical Description of the Problem
This section describes the minimum number determination problem for transport vehicles in a mathematical manner. The basic assumptions are 1) the vehicles are homogeneous, 2) the vehicles can perform any transport task, and 3) all tasks are known and each task has a deterministic timespan (or working hour); and the transition time between tasks is known. On this basis, two mixed integer linear programming models are made using two different assumptions: 1) fixed start time and 2) flexible start time of the tasks.
2.1 Optimization model for a fixed start time problem
This model is made assuming that each task has a specific start and finish time. This allows the conflicts of operation time between tasks to be identified before solving the problem. The model does not have subtour elimination constraints, which exponentially increase the computational time. Equations (1)-(6) describe the model.
Sets:
VVehicles, indexed by i
TTasks, indexed by j or k
Parameters:
MBig number
STjStart time of task j
FNjFinish time of task j
TRijTransition time from task i to task j
Variables:
xij1 if vehicle i performs task j, 0 otherwise
yi1 if vehicle i is used, 0 otherwise
Model:
| (1) |
| (2) |
| (3) |
| (4) |
| (5) |
| (6) |
Equation (1) is the objective function that minimizes the number of vehicles that are used. Equation (2) associates variable xij with yi making sure that yi has 1 if vehicle i is used in more than one task. Equation (3) ensures that each task is performed by a vehicle only once. Equation (4) allows vehicle v to perform both task i and task j only if the operation time of the tasks does not conflict to each other, in which if STj + TRjk < FNk or STk + TRkj < FNj , task j and task k are compatible, otherwise, they are conflicted. Equations (5) and (6) define the decision variables.
2.2 Optimization model for a flexible start time problem
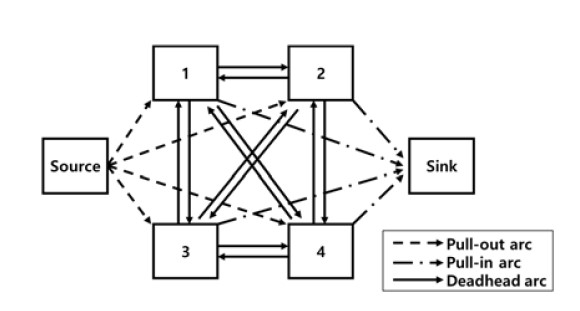
This model is made assuming that the start time of each task is flexible. In other words, there is no predetermined sequence between the tasks. Therefore, the model needs to include both task allocation and sequence decisions. The model is built based on a network model in which nodes indicate tasks and arcs indicate the transition from one task to another. There are two extra nodes referred to as source node and sink node. They represent the start and finish of the network, respectively. According to node combination, arcs belong to one of the subsets referred to as ‘pull-out arcs’, ‘pull-in arcs’, and ‘deadhead arcs.’ The arcs in the pull-out arcs have source-task node combination, the arcs in the deadhead arcs have task-task node combination, and the arcs in the pull-in arcs have task-sink node combination. Figure 1 describes the network model and the arc subsets.
Equations (7)-(16) define the flexible start time model using the network model. Equation (7) is the objective function that minimizes the number of vehicles that are used. Equation (8) ensures that all tasks are performed by one of the vehicles once. Equations (9)-(11) are the flow conservation constraints of the network model. Equation (12) makes sure that all the vehicles can perform the allocated tasks within the given time. Equation (13) is the sub-tour elimination constraints. Equation (14) and (15) define the decision variables.
Sets:
NNodes, indexed by n
TNodes associated with tasks, indexed by t
VVehicles, indexed by k
AArcs, indexed by (i,j)
ApoPull-out arcs, indexed by (i, j)
ApiPull-in arcs, indexed by (i, j)
AdhDeadhead arcs, indexed by (i, j)
Parameters:
MVijTransition time of arc (i, j)
WiWorking time of task i
TRijTransition time from node i to node j
FNFinish time of the timetable
MBig number
Variables:
xijk1 if arc (i, j, k) is selected, 0 otherwise
uii-th dummy variable that for eliminating subtours
Model:
| (7) |
| (8) |
| (9) |
| (10) |
| (11) |
| (12) |
| (13) |
| (14) |
| (15) |
| (16) |
3. A Hybrid Method for the Flexible Start Time Problem
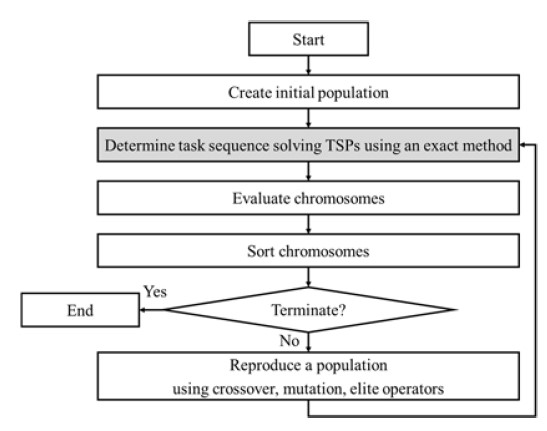
As Joo and Kim [7] present, using an exact method alone for the flexible start time problem causes an exponential increase in computation time as the problem size increases. To avoid that problem, this paper uses a hybrid method that combines a GA and an exact method in which the GA determines task allocation, and the exact method determines task sequence, respectively. Figure 2 describes the overall process.
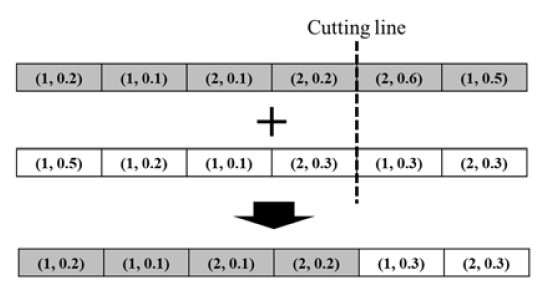
Figure 3 describes the chromosome representation of the GA. The number of tasks defines the length of the chromosome. Each task is associated with a gene that comprises the vehicle identification number (ID) allocated and the priority value of the task. The priority values determine the task sequence in which a lower value task receives a higher priority.
In ‘Create initial population,’ the GA creates initial chromosomes that have random priority values. In ‘Determine task sequence’, the exact method fixes the priority values solving the traveling salesman problem (TSP), which is a well-known optimization problem in which the objective is to minimize the travel distance visiting a list of nodes only once [8]. Dantzig et al. [9] present the branch-and-cut method for symmetric TSPs and Eastman [10] and Little et al. [11] present the branch and bound method for asymmetric TSPs. Such methods have been improved further and are available in commercial optimizers such as the solvers of CPLEX [12] and Gurobi [13].
The solution of a TSP has a cycle that indicates the start node and the finish node are same; thus, the longest arc of the TSP solution needs to be removed for the task-sequencing problem. Figure 4 describes the removal in the conversion of a TSP solution to the optimal task sequence of vehicle 1 in Figure 2.
In ‘Reproduce a population,’ crossover, mutation, and elite operators create new chromosomes. This paper uses a one-point cutting crossover represented in Figure 5. The exact method fixes the task sequences solving TSPs when all chromosomes are created.
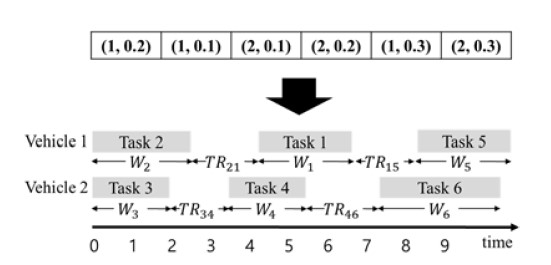
When the hybrid method determines both task allocation and sequence, the task schedule of individual vehicles can be created using the working time and transition time, which are defined as Wi and TRij in Section 2.2, respectively. Figure 6 illustrates the conversion of a chromosome to a timetable.
4. Case Study
This section describes a case study in which the hybrid method was applied to a real-world problem. In the case study, a shipyard was operating with multiple types of transport vehicles signing rental contracts with third-party vendors, but the prime focus is forklifts (see Figure 7). The shipyard was using 61 forklifts and wanted to determine the minimum number using previous transport tasks.
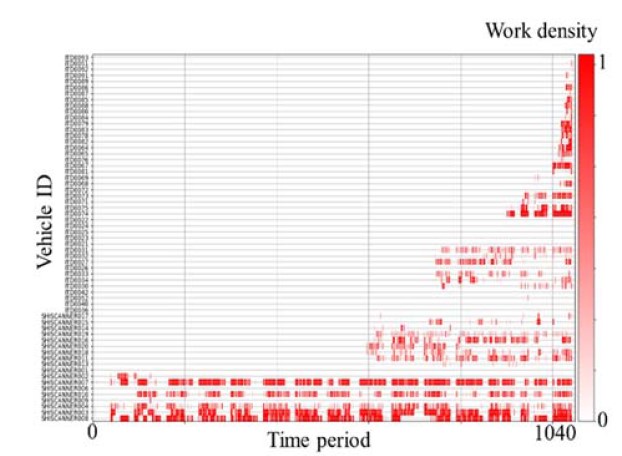
The determination used the data that were collected from the forklifts using real-time sensors. The data include 1) data acquisition time, 2) the position of forklifts, and 3) status of the forklifts in which the status indicates if the forklift is working or not. Figure 8 describes the working history of the forklifts made using the data. The horizontal axis indicates the IDs of the forklifts and the vertical axis indicates the time periods, assuming that a day comprises 10 hours between 8:00 to 18:00. The length of a time period is an hour. The white-to-red colour indicates the work density of the forklifts defined by working time per hour.
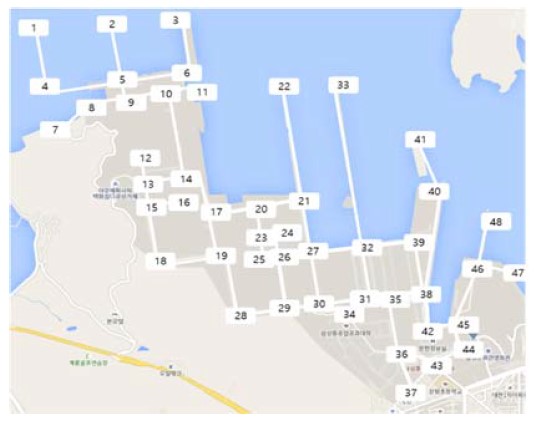
An interesting observation in Figure 8 is that the work density in the top-left area is 0. This appears because the shipyard had installed the sensors gradually from the forklifts at the bottom in Figure 8. Transport tasks were defined using the work density assuming that in the same day, the continuous time periods that have work density over 0.5 were defined as a collective task. Table 1 describes the tasks created using the definition. The task information comprises a start time, working hour, start position, and finish position. The value in the column ‘start time’ indicates ‘year.month.day.hour.minute.second.’ The unit of the column ‘working hour’ is an hour. The start position and finish position indicate the node IDs in Figure 9, in which the shipyard is represented using 48 nodes and 56 undirected edges. Table 2 describes the information of the edges.
The transition time between task i and task j was computed using the finish position of task i and the start position of task j assuming that the vehicles move at 10 km/h in a constant speed, and the vehicles always use the shortest paths determined by the Dijkstra algorithm using the graph in Figure 9. Tables 3-4 show examples of the task-to-task transition time TRijand shortest paths, respectively.
Calculating the minimum number of the forklifts is the flexible start time problem because the shipyard considers the start time to be flexible. In applying the hybrid method, the level of difficulty of the problem is proportional to the number of tasks, which determines the length of chromosomes, and the maximum number of vehicles. This in turn determines the value range of genes. To reduce the level of difficulty, the upper bound was used to determine the maximum number of forklifts instead of considering all given 61 forklifts. The minimum number of the fixed start time problem can be used for the upper bound because the optimal solution of the fixed start time problem is always greater than or equal to that of the flexible start time problem, i.e., the constraints of the flexible start time problem are a subset of the fixed start time problem. For instance, Figure 10 describes the optimal solution of a fixed start time problem in which the minimum number of forklifts is 19. This can be used to determine the maximum value of allocated forklift IDs in creating the genes of the hybrid method for the flexible start time problem.
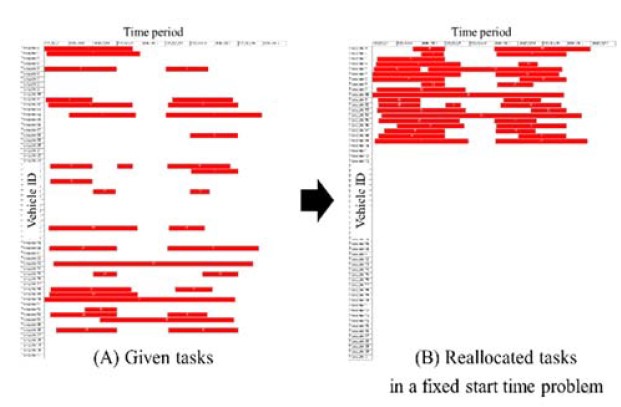
The minimum number of forklifts; the vertical axis indicates vehicle IDs and the horizontal axis indicates time periods
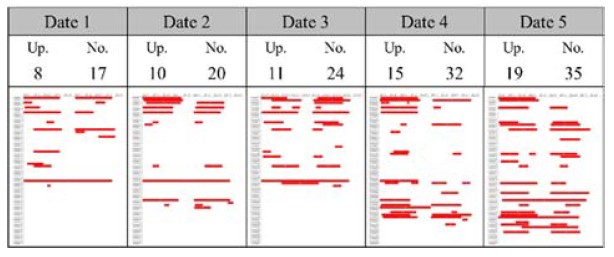
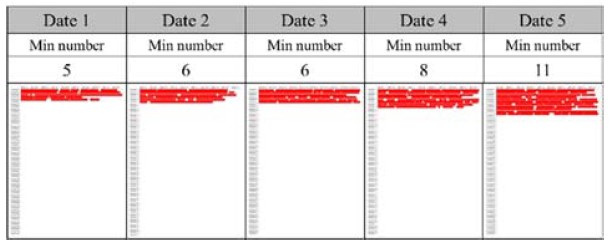
Although the data were collected from 28th September 2019 to 9th January 2020, it is difficult to use all data because many of the sensors were installed late. The determination thus used the last five days, in which most of the forklifts have sensors. Figure 11 describes the upper bound denoted by ‘Up.’ and the number of tasks of the selected dates denoted by ‘No.’, respectively. Figure 12 describes the optimal schedules that use the minimum number of forklifts for the dates. The vertical and horizontal axes of Figures 11-12 are same with that of Figure 10, in which the axes indicate vehicle IDs and time periods, respectively.
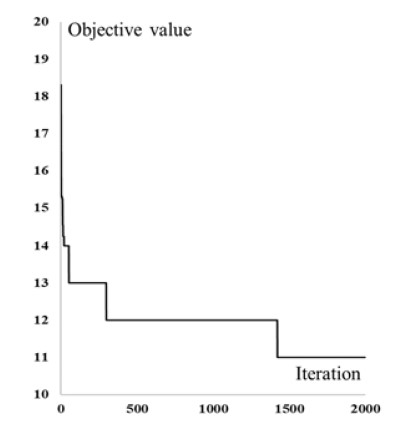
In addition, the performance of the hybrid method was compared with that of the GA using the dates. Both the hybrid method and the GA use 50 chromosomes, and the termination criterion reaches the 2000th iteration. The fraction of crossover, mutation, and elite is 80%, 12%, and 8%, respectively. These parameters were determined based on numerous trials. The TSPs were solved using CPLEX’s solver [12] to make task-sequence decisions. Figure 13 describes an example of the convergence of the objective value over the 2000 iterations.
There can be variation in performance because of the stochastic nature of the GA. The comparison thus uses 20 replicates for the hybrid method and the GA at each date. Table 5 presents comparison results in which indicates the mean of the relative percentage deviations, and each p was computed by . Herein, x* and x~ are the optimal solution and the worst solution respectively, and they indicate the minimum and the maximum numbers found in the 20 replicates; x is the minimum number found in each replicate. Both the hybrid method and the GA could determine the minimum number more than several times out of the 20 replicates in all the dates. Although the solution found in a replicate was not optimal, the absolute gap is only 1 (see all gaps between the best and worst solution for all dates). However, the Table 5 presents comparison results in which shows that the hybrid method has more stable performance than the GA with a higher success rate of determining the optimal solution.
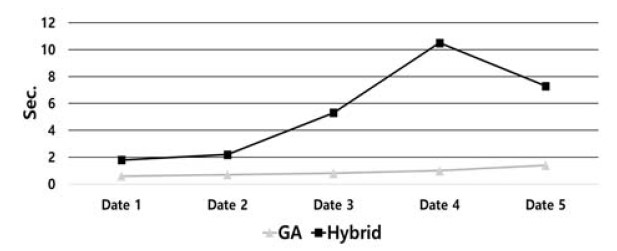
Solving the TSP of the hybrid method could increase the computation time because it is an additional process that GA does not have. Thus, one needs to compare computation time between the hybrid method and the GA. Figure 14 shows the average computation time in each date. As the upper bound and the number of tasks increase, the computation time of both the hybrid method and the GA tend to increase; the computation time of the GA is always less than the hybrid method. However, the average computation time in the worst case was about 10 seconds: this computation time is not significant when it come to the purpose of the problem, in which real-time scheduling is not the primary concern. Thus, the computation time of the hybrid method seems to be reasonable.
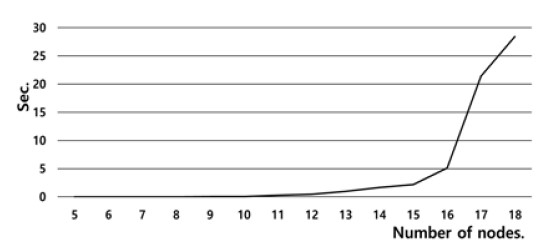
It is also worth investigating how the computation time of TSPs increases in different number of nodes. For this, some numerical experiments were carried out, in which the number of nodes increases from 4 to 18. Figure 15 describes the results of the experiments. When the number of nodes is less than 14, the computation time is less than one second. The computation time then increases exponentially. When considering that the average number of tasks assigned to a vehicle is around 6, the problem-solving time for TSPs is not significant in the minimum number determination problem.
5. Conclusion
In this paper, a hybrid method was presented for the determination of the minimum number of transport vehicles in a shipyard. The hybrid method uses a GA for making task allocation decisions and an exact method for making task-sequence decisions. The exact method determines the optimal task sequence by solving TSPs. The objective is to determine the shortest round-trip path that visits all given nodes only once. Because the exact method ensures the optimality of the task sequence, the hybrid method could have better performance than the GA that alone makes both task allocation and task sequence decisions. The hybrid method was presented in a case study in which previous tasks in a shipyard were analyzed using working data from forklifts collected using real-time sensors. Using the tasks, the performance of the hybrid method was compared with that of a GA. The comparison shows that the hybrid method has better performance than the GA; this superiority can be more significant as the problem becomes more difficult to determine the optimal solution.
The case study in this paper deals with a single type of vehicles. However, the shipyard operates multiple types of vehicles with different levels of capacities. Future studies should study heterogeneous vehicles considering the difference of each vehicle type, i.e., operating costs and compatibility between the tasks and the vehicles.
There are potential risks in solving the TSPs using commercial optimizers such as the solvers of CPLEX [12] and Gurobi [13]. Although there have been significant improvements in the performance of the commercial optimizers, the computation time of solving the TSPs can increase exponentially as the number of tasks increase. In this case study, the maximum number of tasks allocated to a vehicle was 12, which is not problematic in terms of computation time. However, there may need to be a strategy for cases in which the maximum number could be problematic with commercial solvers because of the increased computation time.
Acknowledgments
This work was supported by the Korea Maritime & Ocean University Research Fund.
Author Contributions
Conceptualization, M. J. Choi; Methodology, M. J. Choi; Software, M. J. Choi; Formal Analysis, M. J. Choi; Investigation, M. J. Choi; Data Curation, M. J. Choi; Writing-Original Draft Preparation, M. J. Choi; Writing-Review & Editing, M. J. Choi; Visualization, M. J. Choi; Supervision, M. J. Choi; Funding Acquisition, M. J. Choi.
References
- C. -M. Ju, U. -S. Lee, and G. -B. Lee, “Transporter scheduling for block transportation in the shipyard,” Proceedings of the Korean Operations and Management Science Society Conference, pp. 348-352, 2005 (in Korean).
-
W. -S. Lee, W. -I. Lim, and P. -H. Koo, “Transporter scheduling based on a network flow model under a dynamic block transportation environment,” Proceedings of International Conference on Computers & Industrial Engineering, pp. 311-316, 2009.
[https://doi.org/10.1109/ICCIE.2009.5223874]

-
M. -I. Roh and J. -H. Cha, “A block transportation scheduling system considering a minimisation of travel distance without loading of and interference between multiple transporters,” International Journal of Production Research, vol. 49, no. 11, pp. 3231-3250, 2011.
[https://doi.org/10.1080/00207543.2010.484427]

-
Y. -J. Heo, J. -H. Cha, D. -Y. Cho, and H. -C. Song, “Optimal block transportation path planning of transporters considering the damaged path,” Journal of the Society of Naval Architects of Korea, vol. 50, no. 5, pp. 298-306, 2013 (in Korean).
[https://doi.org/10.3744/SNAK.2013.50.5.298]

-
J. -H. Cha, D. -Y. Cho, W. -S. Ruy, and H. -J. Hwang, “Development of optimal planning system for operating transporters in shipyard,” Journal of Society for Computational Design and Engineering, vol. 21, no. 2, pp. 177-185, 2016 (in Korean).
[https://doi.org/10.7315/CADCAM.2016.177]

-
C. -K. Park and J. -Y. Seo, “A GRASP approach to transporter scheduling and routing at a shipyard,” Computers & Industrial Engineering, vol. 63, no. 2, pp. 390-399, 2012.
[https://doi.org/10.1016/j.cie.2012.04.010]

-
C. -M. Joo and B. -S. Kim, “Block transportation scheduling under delivery restriction in shipyard using meta-heuristic algorithms,” Expert Systems with Applications, vol. 41, no. 6, pp. 2851-2858, 2014.
[https://doi.org/10.1016/j.eswa.2013.10.020]

- G. Laporte, “A short history of the traveling salesman problem,” Canada Research Chair in Distribution Management, Centre for Research on Transportation (CRT) and GERAD HEC Montréal, Canada, 2006.
-
G. Dantzig, R. Fulkerson, and S. Johnson, “Solution of a large-scale traveling-salesman problem,” Journal of the Operations Research Society of America, vol. 2, no. 4, pp. 393-410, 1954.
[https://doi.org/10.1287/opre.2.4.393]

- W. L. Eastman, “Linear programming with pattern constraints,” Ph.D. Dissertation, Department of Economics, Harvard University, USA, 1958.
-
J. D. Little, K. G. Murty, D. W. Sweeney, and C. Karel, “An algorithm for the traveling salesman problem,” Operations research, vol. 11, no. 6, pp. 972-989, 1963.
[https://doi.org/10.1287/opre.11.6.972]

- I. I. Cplex. V12. 1: User’s Manual for CPLEX, NY, USA: International Business Machines Corporation, 2009.
- Gurobi optimizer reference manual, https://www.gurobi.com/wp-content/plugins/hd_documentations/ documentation/9.0/refman.pdf, , Accessed March 31, 2021.

