An experimental investigation of dynamic behavior of a spur gear pair for marine applications
Copyright Ⓒ The Korean Society of Marine Engineering
This is an Open Access article distributed under the terms of the Creative Commons Attribution Non-Commercial License (http://creativecommons.org/licenses/by-nc/3.0), which permits unrestricted non-commercial use, distribution, and reproduction in any medium, provided the original work is properly cited.
Abstract
In this study, an accelerometer-based measurement method is proposed to investigate the dynamic behavior of a spur gear pair. Using this method, dynamic transmission errors of a spur gear pair were measured under realistic speeds and torque ranges to capture its distinct nonlinear phenomenon. This measurement employed a set of uniaxial accelerometers tangentially mounted on the flanges of each shaft next to the gears at a certain radius. The tangential acceleration signals obtained from the uniaxial accelerometers were further processed to calculate the dynamic transmission error by using the proposed formulation. This accelerometer-based measurement system was implemented with an example of a spur gear pair with perfect involute profiles. As a result, the measured data show that dynamic transmission errors can be measured quite effectively by using the accelerometer-based measurement method proposed in this study. The measured data show that significant vibratory magnitudes were observed for spur gear pairs in the torsional direction. Also, strong nonlinear behaviors in their motions were captured in the form of the discontinuity phenomenon of the forced responses of the dynamic transmission error in the vicinity of the resonances. Based on this research, the proposed accelerometer-based measurement system is suitable for measuring the torsional vibrations of the gear pair in terms of the dynamic transmission error. More importantly, a spur gear pair exhibits significant vibration magnitudes with strong nonlinear behaviors under dynamic conditions.
Keywords:
Spur gear, Measurement, Gear dynamics, Accelerometer, Nonlinear behavior1. Introduction
Analysis of a geared system under dynamic conditions is an essential step in its design to satisfy the specific requirements given as noise, vibration, and durability performance (fatigue life) point of view. For powered transmissions or gear boxes, the dynamic gear mesh forces created by gear contacts fluctuate and are transmitted to the housing of the gear box through supporting structures such as shafts and bearings. This transmitted high mesh frequency (tooth-passing frequency) gear mesh force excites the gear box of the radiating surfaces, causing larger structure-borne vibrations and gear whine noise, and eventually reduces the fatigue life of the shafts, bearings, and gears. In this regard, the noise, vibration, and durability performances of the geared system are dictated by the characteristics of the dynamic gear mesh forces.
In this study, the dynamic behavior of a spur gear pair is focused on since spur gear systems are widely used in many areas, such as marine applications, heavy machinery, and agricultural machines, and so on. For example, in marine applications, spur gears are utilized in marine turning gear boxes in the form of spur planetary gear sets as the main auxiliary machine enabling the disassembly and maintenance of the engine [1], to reduction gear boxes connected to marine propulsion systems, etc. In particular, the dynamic characteristics of the reduction gear box become a more important issue since the gear box is excited by the torsional mode of the propeller shafts, causing vibrations to the overall system and reducing the fatigue life [2]. Therefore, investigating the dynamic behavior of spur gear pairs is essential to evaluate a system in terms of noise and vibration as well as to solve the potential dynamic problems of the system.
In many fields, helical gear systems are also broadly used since they exhibit relatively lower vibratory motions than spur gears [3]; however, helical gear systems require very complicated structures in their designs. The structure of a helical gear system has to be much stiffer since the bearings should be sufficiently larger to support the axial thrust at the helical gear mesh induced by the helix angle, and the shafts have to be larger to react to the tilting moment as well [4]. For these reasons, spur gears are easily utilized in many applications with relatively simple structures and cost benefits. However, spur gear pairs often exhibit a large amount of gear vibratory motion, accompanied by a strong nonlinear phenomenon. Therefore, in this study, the non-linear dynamic behavior of spur gears was investigated by implementing an accelerometer-based measurement method under realistic operating conditions to aid designers to guide them for more desirable dynamic behaviors at a certain stage of system development.
One of the main excitations causing torsional gear vibrations is the transmission error (TE) in the gear mesh, which is defined as “the difference between the actual position of the output gear and the position it would occupy if the gear drive were perfectly conjugate” [5].
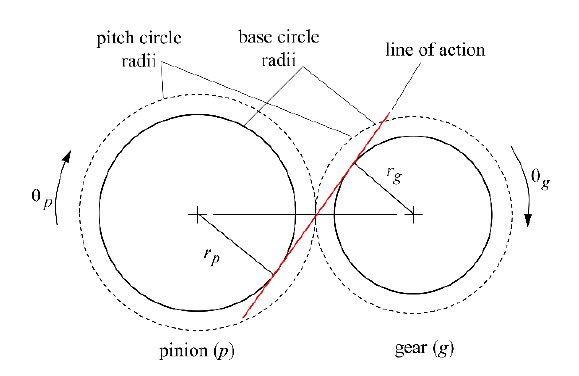
With this definition of TE, it is defined as along the line of action, where subscripts p and g denote the pinion and gear, respectively, and r and θ represent the base radius and angular displacement, respectively, as shown in Figure 1. TE is a periodic function with the gear mesh frequency (equal to the fundamental frequency). Under dynamic conditions, this excitation TE is significantly amplified at and near the resonances of the dynamic system, resulting in a large number of transmission errors. This is called the dynamic transmission error (DTE) [6], which causes large dynamic stresses and loads, which potentially reduce the fatigue life of the gears and bearings.
Over the years, experimental and theoretical investigations regarding TE have been conducted with significant attention in gear design fields. Munro [7] measured static TE under unloaded and loaded conditions using an optical grating with a single-flank test machine at lower speeds. In references [8] and [9], TE was measured by using optical encoders attached at the end of the shafts of the gears under quasi-static operating conditions (very lower gear speeds). The above studies reveal speed limitations (typically less than 50 rpm) in measuring TE, indicating that the previously used measurement methods cannot capture the dynamic characteristics of a gear pair under higher speed conditions. Hayashi [10] used the reaction torque between the gear mass and a large inertial mass to compute the dynamic load from which the DTE could be deduced. This method was able to measure the DTE under any rotational speed, but the accuracy was lower than that of the accelerometer measurement method. Tordion and Gerardin [11] measured DTE using linear accelerometers mounted on the pinion and gear at a certain radius. It should be noted that most of the data analysis for implementing this method was done using analog circuitry.
The main objective of this study is to propose and employ an accelerometer-based measurement method in conjunction with digital signal processing (DSP) to account for the dynamic behavior of a spur gear pair under sufficiently high-speed conditions.
2.Measurement Methodology
2.1 Measurement Concept of DTE
In this study, the DTE was measured by implementing an accelerometer-based measurement methodology.
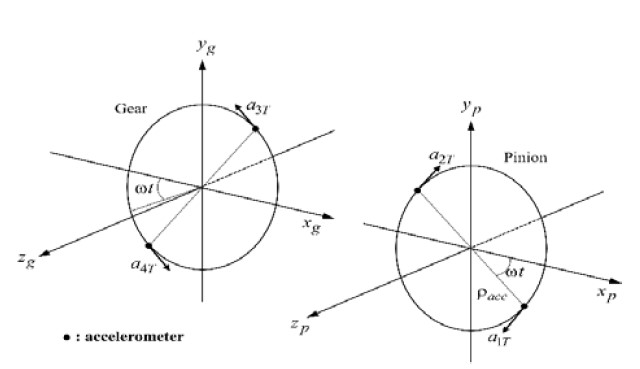
Two equally spaced accelerometers, as shown in Figure 2, were mounted on each shaft of the pinion and gear next to the gear blank (body). It is noted that two accelerometers of each shaft were tangentially mounted in opposite directions, 180 degrees out of phase, to eliminate the gravity effects by adding two acceleration signals. Each accelerometer was mounted at a radius of pacc from the center of the gear shaft, as shown in Figure 2. The signal of each accelerometer of the pinion can be approximately defined by:
| (1) |
| (2) |
where g is the gravitational constant and ω is the rotationalvelocity about gear rotational axis z. By adding two signals (here, Equations (1) and (2)), the pure angular acceleration of the pinion can be obtained, and also, the gravitational terms cancel each other out. Therefore, is given as
| (3) |
In the same manner, the angular acceleration of the gear can be obtained by adding the two signals and
| (4) |
As mentioned earlier and shown in Figure 1, DTE is defined along the line of action as follows:
| (5) |
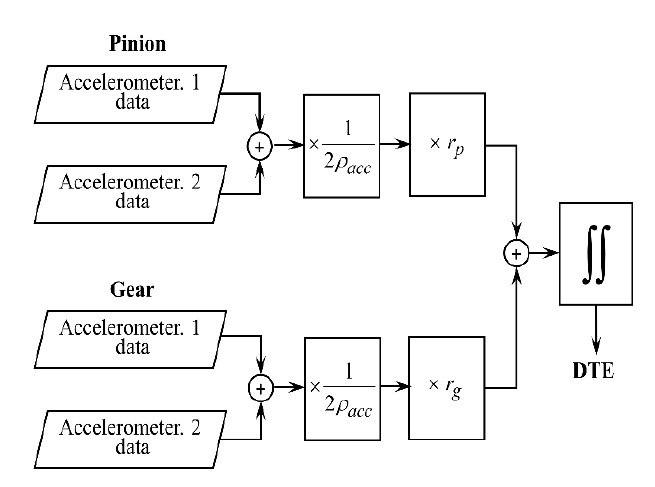
where is the base radius of the pinion and is that of the gear. Therefore, DTE can be calculated by adding Equations (3) and (4) and integrating twice with respect to time:
| (6) |
The measurement scheme explained above is illustrated in Figure 3.
2.2 Experimental Setup
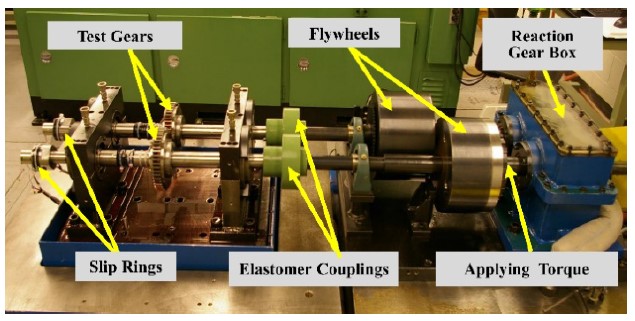
In this study, the test machine, as shown in Figure 4, had a four-square-type power circulation layout, mainly consisting of the test gear and reaction gear boxes. The machine was developed to precisely measure vibrations for a test gear pair under realistic input torques and speeds. In order to enhance the accuracy of the measurement, the machine was devised with several unique features to isolate the test gear box from the dynamic effects (mostly torsional vibrations) of the reaction gear box under dynamic conditions.
The large flywheels and elastomer couplings shown in Figure 4 enabled the test gear pair to be isolated from the reaction gear’s vibrations. The elastomer coupling consisted of an inner flange and an outer flange. The inner flange was connected to the reaction gear through the shaft, while the outer flange was connected to the test gear shaft. By connecting the inner and outer flange with a couple of elastomers, the test gear pair was decoupled significantly from the reaction gear pair. The flywheels were designed to have a diameter as large as possible so that they had a considerable amount of inertia. The sizable flywheel acted as a mechanical filter so that it provided additional isolation between the two gear boxes. In addition, the reaction gears were designed with a large face width (tooth width). By doing this, the contact ratio became larger, and as a result, the TE became significantly smaller. Therefore, the excitation TE of the reaction gearbox was minimized as much as possible. Finally, the number of teeth of the reaction gear pair differed from that of the test gear pair, making sure that the fundamental frequency (gear mesh frequency) of the two gear pairs did not overlap. The machine had a power circulation system that ensured consistent torque operation. The torque could be adjusted by loosening a split hub and then applying a torque between 45 and 500 Nm using a loading arm. After that, the split hub was tightened and the loading arm was removed. This allowed a constant torque operation of the test machine at any speed condition. The tested spur gears had perfect involute profiles (unmodified profiles) with an involute contact ratio of 1.75. The spur gear had a unity gear ratio, a module of 3.0 mm, a pressure angle of 20°, and a pitch diameter of 150 mm. The rest of the basic design parameters of the test spur gear are listed in Table 1.
2.3 Instrumentation
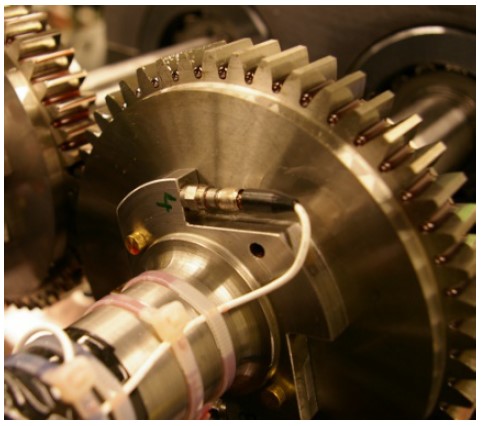
In order to implement an accelerometer-based measurement system, the shafts were designed to have accelerometers mounted on the flange of the shaft next to the gear, as shown in Figure 5.
In this study, the two uniaxial accelerometers were tangentially mounted on the pinion and gear, respectively. As mentioned in the previous section, referring to Figure 1, the two accelerometers on each shaft were mounted in opposite directions, 180° out of phase, to cancel out the gravitational terms by adding these two acceleration signals. The uniaxial accelerometers used in this experiment were PCB Piezotronics accelerometers. The sensitivity of the accelerometer was approximately 10 mV/g, and it was capable of measuring from 0 to 10 kHz. Four channels of the gear and pinion’s acceleration signals , , and ) were in hand; therefore, DTE could bemeasured precisely by applying the proposed formulations in Equation (6).
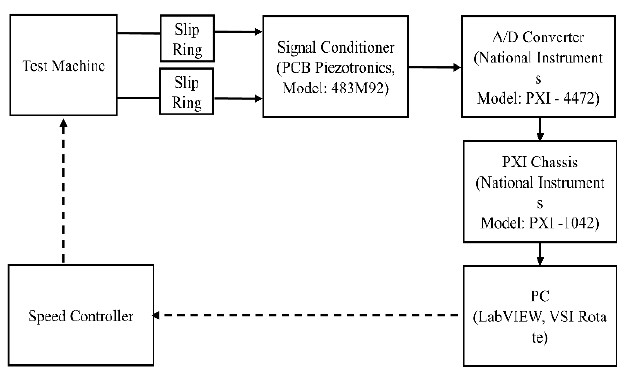
The block diagram schematically shown in Figure 6 illustrates the flowchart of the instrumentation used in this experiment. The data from the accelerometers were transmitted to slip rings, which consisted of a conductive circle on a shaft and insulated from it. The signal from the slip ring was transferred to the signal conditioner, which allowed the data to be amplified. Then, the signal was transmitted to the National Instrument PXI/4472 A/D converter, which sampled the signal with a sampling frequency assigned by the Labview application and trasnformed the analog signal into a digitized signal. As the Nyquist frequency must be at least twice the maximum frequency of the accelerometer, the sampling frequency was determined as 20 kHz. From the PXI/1042, the signal was sent to the PC for analyzing and processing data through the LabVIEW and MATLAB applications. The LabVIEW software was used only for data acquisition. On account of this, post-processing was performed using MATLAB software.
This study focused on the steady-state responses of the test gear. Hence, the constant speed of the data was collected as a given gear speed range from 500 rpm to 4200 rpm at 50 rpm intervals. Once the data were collected, the data were further processed to calculate the DTE based on the formulations shown previously. The acceleration signal of the DTE (Equation (6)) for each speed was integrated twice using a pseudo integration method, focusing first to third gear mesh harmonics. Fast Fourier transforms (FFT) were applied to the collected data to see the data in a frequency manner, and the root mean square (RMS) value of the DTE is defined as
| (7) |
where An is the magnitude at the n-th mesh harmonic. For calculation of the gear mesh RMS value of the DTE, only the gear mesh harmonic amplitudes at frequencies fm, 2fm, 3fm are included in Equation (7). Finally, the gear mesh RMS values were plotted with respect to the gear speed.
3.Experimental Results
In this section, the measured steady-state DTE responses are presented as a function of the gear rotational speeds under various torque levels.
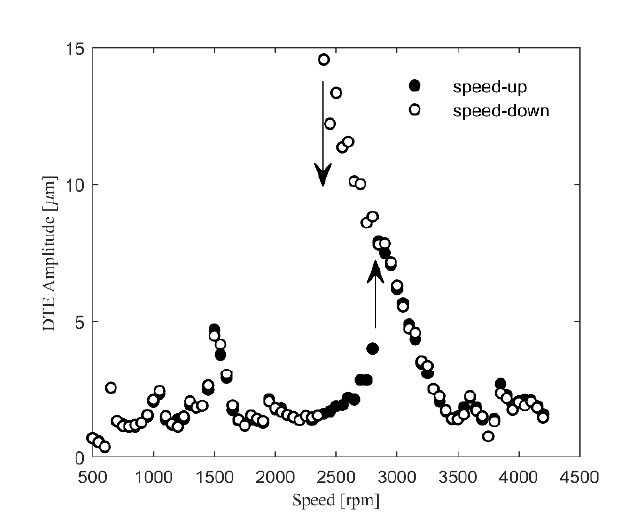
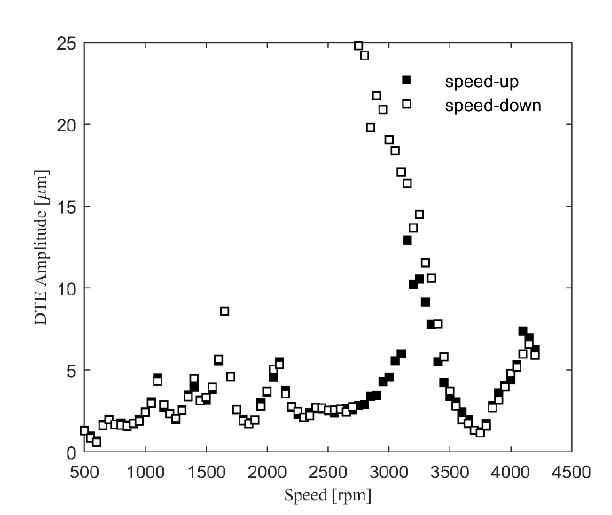
As shown in Figure 7, the DTE amplitudes were measured for both speed-up (upward speed sweep) and speed-down (downward speed sweep) phases to capture nonlinear behavior due to tooth separation (loose gear contact). The solid circles represent the DTE amplitudes measured under the speed-up condition (500 to 4200 rpm), and the hollow circles were obtained under the speed-down condition (4200 to 500 rpm) at a torque level of 100 Nm. The response curves (speed-up and speed-down) were quite similar in their amplitudes for most of the entire speed range, indicating where dynamic responses are considered linear. In other words, tooth separation did not take place at most of the speed ranges except in the region of the resonance at around 2800 rpm. In Figure 7, the jump discontinuity phenomenon is observed at the resonance. During the speed-up phase, the DTE amplitude suddenly jumped up at 2800 rpm, while the DTE amplitude jumped down at 2400 rpm in the speed-down phase. Moreover, the DTE amplitudes for the upward sweep test continued to climb up to 15 mμin contrast to the jump-up values. A similar discontinuity can be observed at several resonance peaks, 1500, 1900, and 3800 rpm, as well, but their scales were much smaller. This discontinuity indicates that a double (distinct) stable motion existed in the speed range of 2400 to 2800 rpm. As seen in Figure 7, the double stable region had a lower stable branch and upper stable branch. The lower branch could be measured only when approached from the lower speed (rpm) side, while the upper branch could be achieved only from the higher speed side. This nonlinear behavior resulted from tooth separation at the gear mesh. As a result, tooth separation led to a significant reduction in gear mesh stiffness values. In this context, it is called a softening-type nonlinear behavior for a spur gear pair.
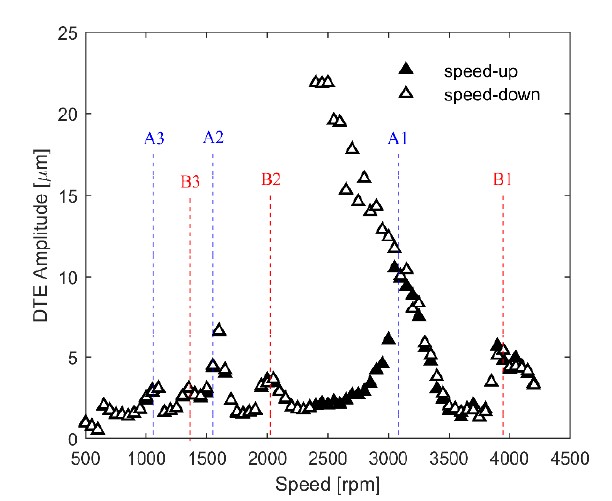
Similarly, Figure 8 shows the steady-state DTE response at a torque level of 200 Nm for both the speed-up and speed-down phases as well. The DTE response curves show resonance peaks over the entire speed range. First, resonance peaks were observed at 3100, 1550, and 1050 rpm (corresponding to 2583, 1291, and 861 Hz). These three resonance peaks were associated with the same natural mode (or natural frequency). The resonance peak at 3100 rpm (denoted by A1)was excited by the first (or fundamental) harmonic of the TE excitation. Referring to the definition of TE in the previous section, TE is a periodic function as toothpassing frequency and can be expressed by the summation of harmonic orders using FFT. In this context, the peak at 3100 rpm is called the primary resonance since it was excited by the first harmonic of the TE. The resonance peak at 1550 rpm also corresponded to the first super-harmonic resonance excited by the second harmonic of the TE, denoted by A2. Finally, the second super-harmonic resonance peak at 1050 rpm was excited by the third harmonic of the TE as well, denoted by A3. In the same manner, the resonance peaks at 3900, 1950, and 1300 rpm (corresponding to 3250, 2333, and 1083 Hz) were related to another same natural mode, as shown in Figure 8. Therefore, the two different natural modes mostly dominated the DTE responses within the rotational speed range. Figure 9 shows the steady-state DTE response at a torque level of 300 Nm. The same observations mentioned previously can be made. It is noted that the peak at 3300 rpm exhibited a distinct jump discontinuity, while the peaks at around 4200 rpm did not. This implies that the excited natural mode at 3300 rpm was more torsional than the other excited natural mode at 4200 rpm.
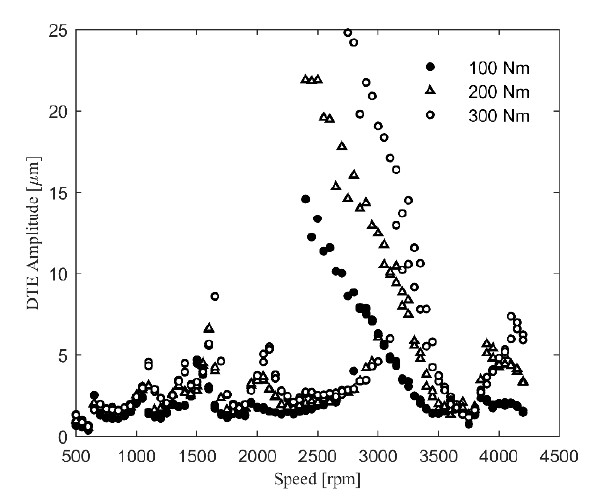
Figure 10 shows the DTE responses at torque levels of 100, 200, and 300 Nm to observe the effects of the different torque levels on the forced steady-state responses. The speed-up and speed-down phases were plotted on a curve for each torque level. The double stable regions were slightly widened, and the amplitudes of the resonance peaks increased significantly as the applied torque increased. Moreover, the natural frequency increased at an increased torque value. This is also a nonlinear behavior typically observed in gear dynamics. This is because the gear mesh stiffness increases due to the widened contact area (Hertzian contact) with higher torques, increasing the natural frequencies.
4.Conclusions
In this study, an accelerometer-based measurement system was employed to investigate the dynamic behavior of a spur gear pair. In this method, a set of uniaxial accelerometers were mounted on each flange of each shaft next to a gear at a certain radius, and a data processing scheme was used to process the data from the uniaxial accelerometers to obtain torsional vibration and then to calculate the dynamic transmission error of a gear pair. This measurement method was applied to a spur-gear pair. The measured data show that dynamic transmission errors were measured quite effectively by implementing the accelerometer-based measurement system proposed in this study. The steady-state DTE responses show that the jump discontinuities during speed-up and speed-down phases obviously occurred at the primary and super-harmonic resonances, indicating that this softening-type nonlinear behavior is an inherent characteristic of spur gear pairs under dynamic conditions. In addition, this nonlinear behavior became more significant at higher torque levels. Based on this study, nonlinearity should be taken into account in the design stage of spur gear systems. If gear systems operate near the primary or super harmonic resonances, the corresponding harmonic magnitude of TE excitation should be minimized by applying tooth modifications to gears. Therefore, the DTE amplitudes and nonlinearity can be minimized.
5.Limitations and Future Research
The method proposed in this study is not suitable for measuring DTE responses at a lower speed range. Thus, no DTE results were presented at speeds below 500 rpm since the double integration of the acceleration signals elevates the noise floor significantly at such low-speed ranges. If a gear system has resonances at that lower speed, this measurement method cannot capture the DTE responses well. In order to fill this gap, an encoder-based measurement method for a lower speed range can be combined with this accelerometer measurement method.
All the tests performed in this study used unmodified (purely involute) gears at a given contact ratio. Additional tests can be performed to determine the impact of modified tooth profiles on the dynamics of gear pairs. Also, the proposed measurement system can be modified to measure the DTE of cross-axis gears such as bevel and hypoid gears.
Author Contributions
Formal Analysis, M. R. Kang; Investigation, M. R. Kang; Data Curation M. R. Kang; Writing-Original Draft Preparation, M. R. Kang; Writing-Review & Editing, M. R. Kang.
References
-
K. -W. Kim, J. -W. Lee, J. -S. Jang, C. -Y. Choi, J. -H. Hong, and K. -J. Lee, “Development of marine turning gear based on helical planetary reducer,” Journal of the Korean Society of Manufacturing Process Engineers, vol. 19, no. 10, pp. 36-43, 2020 (in Korean).
[https://doi.org/10.14775/ksmpe.2020.19.10.036]

- J.-S. Kim, J.-H. Kim, D.-D. Lee, “Vibration characteristics of reduction gear by propeller excitation on the marine propulsion shafting system,” Proceedings of the Koren Society for Noise and Vibration Engineering Conference (KSNVE) fall conference, pp. 378-379, 2012 (in Korean).
-
A. Kahraman, “Dynamic analysis of a multi-mesh helical gear train,” Journal of Mechanical Design, vol. 116, no. 3, pp. 706-712, 1994.
[https://doi.org/10.1115/1.2919440]

-
A. Kahraman, “Effect of axial vibrations on the dynamics of a helical gear pair,” Journal of Vibration and Acoustics, vol. 115, no. 1, pp. 33-39, 1993.
[https://doi.org/10.1115/1.2930311]

- D. B. Welbourn, “Fundamental knowledge of gear noise: A survey,” Conference on Noise and Vibrations of Engines and Transmissions, 1979.
-
D. R. Houser and G. W. Blankenship, Methods for Measuring Gear Transmission Error Under Load and at Operating Speeds, SAE Technical Paper Series 891869, SAE International, USA, pp. 11-14, 1989.
[https://doi.org/10.4271/891869]

- R. G. Munro, “The DC component of gear transmission error,” Proceedings of the International Power Transmission and Gearing Conference, pp. 467-470, 1989.
- R. E. Smith and G. Works, “Single flank data analysis and interpretation,” Gear Technology, pp. 20-34, 1985.
- D. Remond and D. Play “Advantages and perspectives of gear transmission error measurement with optical encoders,” 4th World Congress on Gearing and Power Transmission, pp. 1789-1801, 1999.
- I. Hayashi and T. Hayashi, “Development of the dynamic measurement method of transmission error of a gear pair,” Proceedings of the International Symposium of Gearing and Power Transmissions, pp. 497-502, 1981.
- G. V. Tordian, H. Gerardin, “Dynamic Measurement of Transmission Error in Gears,” JSME Semi-International Symposium., Tokyo, pp. 279-284, 1967.

