Design for resonance area avoidance by changing the geometry of offshore wind turbine substructures
Copyright © The Korean Society of Marine Engineering
This is an Open Access article distributed under the terms of the Creative Commons Attribution Non-Commercial License (http://creativecommons.org/licenses/by-nc/3.0), which permits unrestricted non-commercial use, distribution, and reproduction in any medium, provided the original work is properly cited.
Abstract
The larger the topside tower size, the more the fatigue loads can generate, especially at the connection joints; additionally, problems due to resonance occur in the high-frequency area due to the movement of the tower blades and substructure. Therefore, the resonant area generated the motion of the tower blades and substructure must be considered when designing the structure. Therefore, the purpose of this study is to change the tower shape based on the substructure of a 12 MW offshore wind generator designed using the expansion method to identify the inherent vibration area of the structure's six-degrees-of-freedom (6DoF) motion. Moreover, the movement trends of the resonant areas per case are analyzed based on the tower rotor speed to present the designs to follow and avoid for the resonant areas. Seven models were designed for the transformed model, and a 6DoF motion response analysis was performed according to the wave incidence angle. In addition, the tower rotor speed frequency and substructure frequency were compared and analyzed, and an avoidance design method was presented to show the effect of 6DoF on the structure.
Keywords:
Semi-submersible, Damping, Tri-pod, Heave plate, ANSYS AQUA1. Introduction
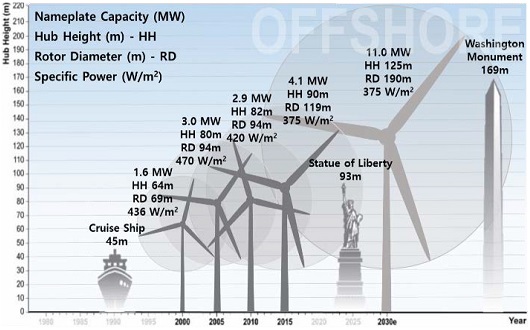
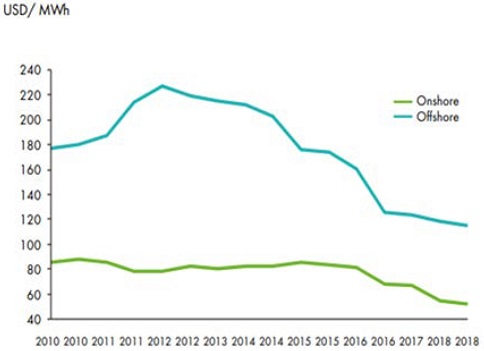
Many agreements have been proposed in response to the greenhouse gas problem. From the 1992 Climate Change Convention to the Kyoto Protocol and the Paris Convention, countries worldwide are interested in solving the greenhouse gas problem. To reduce greenhouse gas emissions, eco-friendly energy has drawn attention worldwide [1]. Wind energy is a renewable energy sector under the spotlight as an alternative energy source for the future. Wind energy is technologically mature compared to other renewable energy sources. Wind energy has been around longer than photovoltaic and tidal energy. Moreover, wind energy fields can be installed offshore. Compared to other renewable energies, wind energy has a higher site utilization rate and allows for easy construction of large-scale power plants. In 2019, wind turbines with a size of 651 GW were installed worldwide, of which 622 GW were installed onshore and 29 GW offshore. Although the capacity of offshore wind turbines is less than 4% compared to onshore wind turbines, the annual average increase rate for onshore and offshore wind turbines is 9.5% and 26.1%, respectively [2]. The size of offshore wind generators has been increasing to solve problems such as insufficient installation space, noise pollution, and transportation (Figure 1) [3]. The levelized cost of electricity (LCOE), which is a measure of the economic feasibility of the wind power industry, represents the growth potential, cost competitiveness, and efficiency of this industry, and it is useful for speculating how it will develop in the future (Figure 2) [4].
In the case of a floating wind turbine, significant fatigue occurs at the joint owing to the motion of the blade and substructure, and a resonance problem occurs in the natural frequency area of the tower blade and substructure. As for research on the substructure, research focusing on the dynamic response of the structure and model testing is being conducted independently. However, studies on the shape of the tower and substructure considering resonance are insufficient.
In this study, based on the design of the basic, the superstructure of a 12 MW offshore wind turbine designed through the expansion method, the shape of the substructure is transformed to investigate the natural frequency area of the six-degrees-of-freedom (6DoF) motion. Based on the resonance area according to the rotor speed of the tower, the movement tendency of the resonance area for each model is analyzed, the design method to avoid the resonance area is suggested, and the design direction is presented.
2. Offshore Wind Turbine Substructure
This study confirmed the results of previous studies using the fluid-based structural analysis program ANSYS AQWA and confirmed the degree of influence between design variables through program-based design [5]. For the substructure design, a 12 MW wind turbine substructure that extends the OC4 semi-submersible structure is selected. The scale ratio of the substructure is as follows [6]:
| (1) |
The model data of the 12 MW wind turbine designed using Equation 1 and the NREL 5 MW wind turbine are shown in Table 1 and Figure 3.
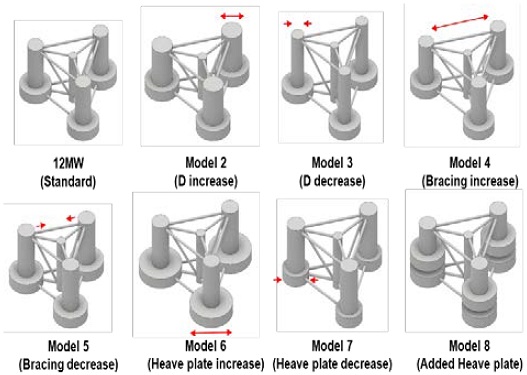
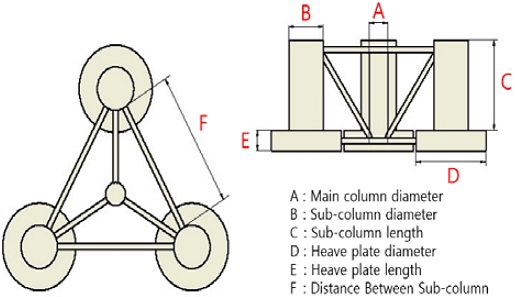
The substructure model used in this study is illustrated in Figure 4. Model 1 is a 12 MW offshore wind turbine designed using Equation 1. This was set as the reference model. In Model 2, the diameter of the auxiliary column was increased by 20% by changing the geometry of Model 1. At this time, the displacement, diameter of the main column, heave plate, and length of the brace were fixed, and the draft was designated according to the displacement. Model 3 reduces the auxiliary column diameter of Model 1 by 20%. Similarly, as in Model 2, the amount of displacement, main column diameter, heave plate, and brace length was fixed, and the draft was set. In Model 4, the length between the auxiliary columns of Model 1 was increased by 20%. The displacement, diameter of the main column, and heave plate were fixed, and the draft was designated by the fixed displacement. In Model 5, the length between the auxiliary columns of Model 1 was reduced by 20%. The displacement, diameter of the main column, and heave plate were fixed, and the draft was designated by the fixed displacement. Model 6 increased the heave plate value of Model 1 by 25%. To match the displacement, the main and auxiliary column lengths were reduced to investigate the effect of the structure's heave plate. Model 7 reduced the heave plate value of Model 1 by 25%. In Model 8, the effect is investigated by adding the same heave plate at 9.4 m, which is the center point below the waterline of Model 1.
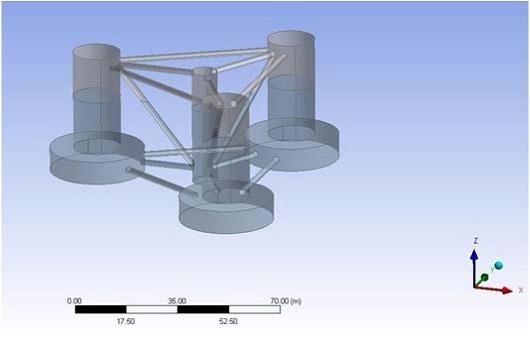
The total mass of the model was designed such that the weight and buoyancy of the upper tower, substructure, and mooring line were at the draft position. The value of the center of gravity did not include the mooring line. The draft was calculated based on the displacement of each case in the existing model. The moment of inertia was calculated from the center of gravity, and the main model specifications are listed in Table 2. Model 1 is shown in Figure 5.
3. Analysis and Results
The frequency-domain equation of motion acting on an offshore wind turbine structure can be represented as follows [7]:
| (2) |
In Equation (2), F(ω,β) is the sum of fluid forces, ω is the frequency of the wave, and β is the 6DoF motion according to the angle of incidence. M is the mass, A(ω) is the added mass, B(ω) is the damping factor, and C is the restoring force matrix.
3.1 Analysis condition
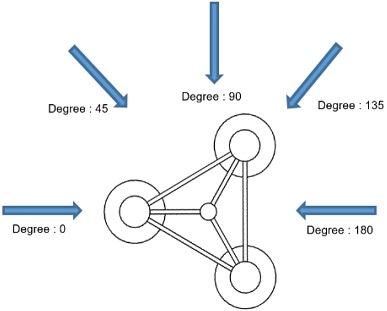
The response amplitude operator was analyzed using ANSYS AQWA. The angle of incidence was in the range of 0° to 180° at 45° intervals, as shown in Figure 6. The period was interpreted in the range of 6 to 46 s (0.137 to 1.05 rad/s).
3.2 Resonant area analysis between tower and substructure
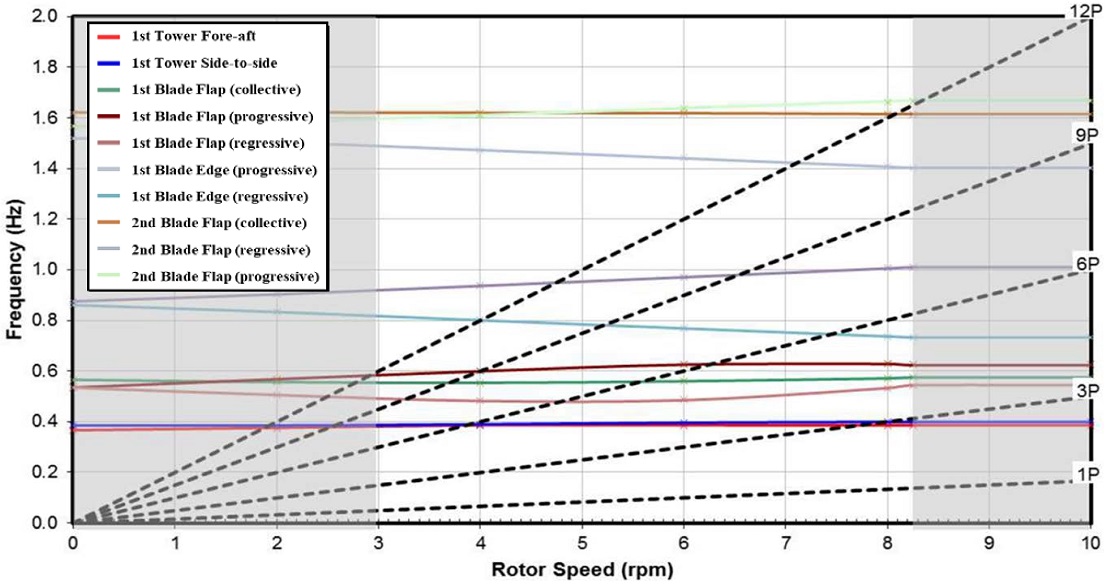
The purpose of this study was to develop a design to avoid resonance areas occurring at the connection of the upper tower and the lower structure of an offshore wind turbine. Figure 7 is a Campbell diagram showing the frequency generated in the active state of a 12 MW offshore wind turbine, where 1P is the rotational speed of the blade. From 3P to 12P, each represents three to 12 times the rotational speed of the blade. The wind speed of the extended design offshore wind turbine is generally 3–8.25 rpm. In this study, the frequency generated when the rated wind speed of the upper tower (rotor speed) was maximum was compared with the frequency of the substructure. When the frequencies of the upper tower and the lower structure equalize, resonance occurs; therefore, this should be avoided. The maximum rotor speed of a 12 MW offshore wind turbine is 8.25 rpm. Therefore, research was conducted based on the frequencies of the 1P, 3P, and 6P blades. An analysis of the model was performed for each movement with 6DoF, and the most critical data between 0° and 180° in each movement was analyzed.
3.3 Analysis of results
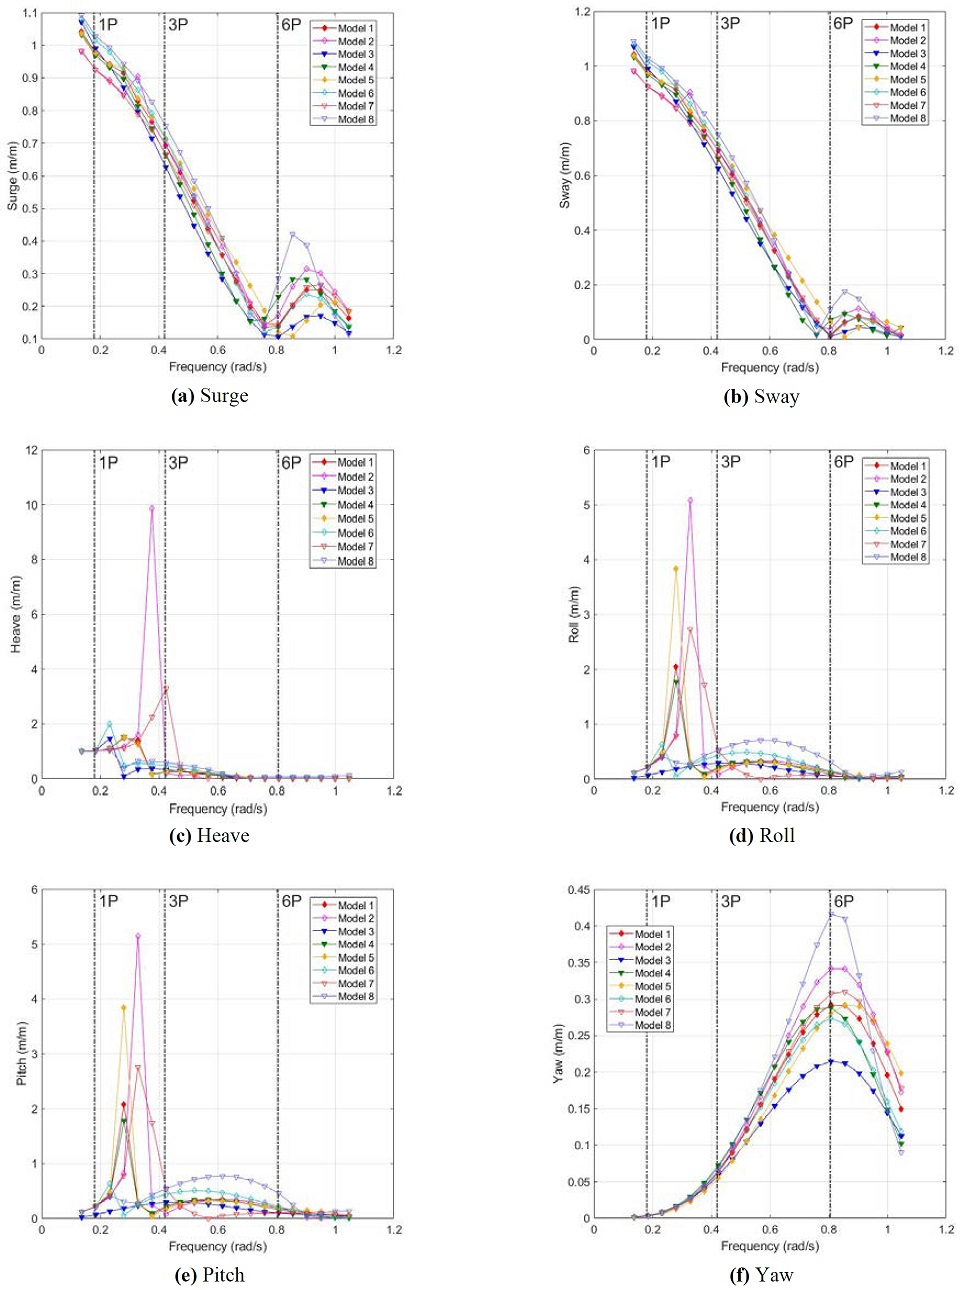
Figure 8 shows the 1P, 3P, and 6P frequencies of the blades of the tower and the resonance points of the substructures. Notably, it is possible to check the resonance area using a vertical line. Figure 8 shows the most critical data among the 6DoF motion from Models 1 to 8. Figure 8 (a) shows the surge data. The substructure frequency of approximately 0.9 rad/s is considered to be the resonance region generated by the inertia force and tension of the tension leg. In the surge motion, the largest value is that of Model 8, and the smallest is that of Model 7. It can be seen that the size of the heave plate has the greatest influence on the surge motion. Figure 8 (b) shows the sway data, and the substructure frequency of around 0.9 rad/s is considered to be the resonance region generated by the inertia force and tension of the tension leg. The largest value in the sway motion was from Model 8, and the smallest from Model 7. Notably, the size of the heave plate had the greatest influence on sway motion. However, it is observed that the design for avoiding the resonance area is not appropriate for the surge and sway motions of the substructure.
Figure 8 (c) shows the heave data, and it can be seen that the resonance area varies according to the shape. The models with the shortest resonance point frequencies are Models 3, 5, and 8, and the resonance region is generated at approximately 0.23 rad/s; moreover, the model with the longest resonance point frequency is Model 7. In addition, the resonance point of Model 7 is interlocked with the 3P frequency of the blade, and a design to avoid the 3P frequency should be carried out to locate the resonance point before and after the 3P frequency. To solve this problem, in the case of Model 7, the resonance area can be avoided by reducing the diameter of the auxiliary column and increasing the diameter of the heave plate.
Figure 8 (d) and (e) show the roll and pitch data, respectively. In both cases, the models with the shortest resonance point frequencies are Models 6 and 8, where the resonance region occurs at approximately 0.23 rad/s, and the models with the longest resonance point frequencies are Models 2 and 7. All the models can be used as the resonance frequencies of all the models do not interlock with the 1P and 3P frequencies.
Figure 8 (f) shows the yaw data. Overall, as the frequency increases, the yaw motion increases and decreases by approximately 0.8 rad/s. The model with the largest resonance point in the yaw motion was Model 8, and the smallest was Model 3. It can be seen that the design intended to avoid the resonance area with the tower for the yaw motion of the substructure is not appropriate, and special attention is needed in the 6P frequency domain.
4. Conclusion
This study was designed to avoid the resonance area occurring at the connecting part of the upper tower and the substructure of an offshore wind turbine. To determine the motion response and tendency of the substructure, seven models were designed based on a 12 MW offshore wind turbine, and the 6DoF motion was analyzed according to the wave incidence angle. In addition, by comparing and analyzing the rotor speed frequency of the upper tower and the lower structure frequency, a design method was proposed to avoid the occurrence of a resonance region, and the tendency of the 6DoF motion is shown in Figure 8. The details are as follows.
Regarding surge and sway, it was confirmed that Model 8 tended to rise in the 6P frequency domain. In the case of heave, it was confirmed that Model 7 meshed with the 3P domain. When designing, the resonance point should be located before and after the 3P zone. For pitch and roll, all models were properly designed to avoid the frequency domain. In the case of yaw, not all models avoided the 6P frequency domain, which indicates an inappropriate design. Models 3 and 6 showed lower resonance points than the other models.
In this study, Model 3, which reduced the diameter of the substructure column, and Model 6, which increased the diameter of the pontoon, were found to represent the most efficient designs to reduce the tower-substructure connection resonance.
Author Contributions
Conceptualization, S. H. An; Methodology, S. H. An; Software, S. H. An; Formal Analysis, S. H. An; Investigation, S. H. An; Resources, S. H. An; Data Curation S. H. An; Writing-Original Draft Preparation, S. H. An; Writing-Review & Editing, S. H. An and J. H. Lee; Visualization, author’s name; Supervision, S. H. An; Project Administration, J. H. Lee.
References
- Korea Energy Economics Institute, UNFCCC & Kyoto Protocol, 2002 (in Korean).
- Global Wind Energy Council, Global Wind Report 2019, 2019.
- The Future of Wind Energy, Part 3: Reducing Wind Energy Costs through Increased Turbine Size: Is the Sky the Limit?, https://emp.lbl.gov/news/future-wind-energy-part-3-reducing-wind, , Accessed October 10, 2020
-
Enas Raafat Maamoun Shouman, Global Prediction of Wind Energy Market Strategy for Electricity Generation, Modeling Simulation and Optimization of Wind Farms and Hybrid Systems, Karam Maalawi, Intechopen, 2020
[https://doi.org/10.5772/intechopen.89968]

- J. Y. Kim, ANSYS AQWA, Seoul, Korea: TSNE, 2017.
- J. T. Kim, A Study on Dynamic Responses of 12MW Floating Offshore Wind Turbine Using Fully Coupled Analysis, M. S. Thesis, Department of Naval Architecture and Ocean Engineering, University of Ulsan, Korea, 2017 (in Korean).
- D. H. Kim, Motion Analysis of Floating Offshore Wind Turbine by Using Dynamic Program, M. S. Thesis, Department of Naval Architecture and Ocean Engineering, Hongik University, Korea, 2011 (in Korean).

