Investigation on electrochemical performance of Al anode material for marine growth prevention system
Copyright © The Korean Society of Marine Engineering
Aluminum anode of marine growth prevention system for ship is installed in seachest or sea water strainer. The Al anode is connected to a control panel that feeds a current to the anode. The dissolved io)ns produced by the anode are transferred in sea water, spreads through the sea water pipe system and creates a protective film in the pipelines. Thereby, corrosion in pipeline system significantly is reduced. In application on condition as a steel ship, the big accident can be caused by the corrosion. Accordingly, in this research, we evaluated influence of applied current and flow velocity on electrochemical characteristics of Al anode for marine growth prevention system (MGPS). Based on the results of the erosion-cavitation experiments, cavitation rate increased greatly until 120 min. of the experimental time and decreased a little at the point of 180 min. where pit grew and merging occurred but showed a tendency of steadily increasing consumption rates. Based on the results of the Tafel analysis, compared to static states, corrosion current densities show a rapidly increasing tendency when flow occurred.
Keywords:
Al alloy, Corrosion, Electrochemical, Marine environment, marine growth prevention system (MGPS)1. Introduction
In piping system for vessels, growths and shellfishes inhabiting in seawater hinder smooth movements in the piping or filters, and induce corrosion. Due to these local flow rate increases in seawater inflow areas, corrosion rates in the piping systems may remarkably increase than in general seawater environments [1]. There exist several methods to prevent marine fouling such as generation of high frequency low power sound wave, application of antifouling paint and electrolysis for producing antifouling agent. In modern times, however, implementation of marine growth prevention system (MGPS) is a common approach to reducing fouling and corrosion problems in ship's piping system. The principle of the MGPS is to apply current to copper and Al anodes. Copper anode is electrolyzed to produce copper ions, which prevent marine fouling. The Al anode forms thin Al hydroxide films on pipelines and coolers to prevent corrosion. Furthermore, as this system can be installed not only in new ships but also in existing ships, it has been applied to numerous ships since 1980s with excellent effects. Recently, the MGPS is being installed in the sea chest of Al ships as well as steel ships to prevent the corrosion of seawater pipelines for cooling and the attachment of marine growths. Despite its excellent effects, however, the Al anode used for anti-corrosion may cause large accidents resulting from corrosion due to inappropriate operation following the application of the same conditions as steel ships which exhibit fundamentally different electrochemical behaviors in seawater. Seachest is the part through which seawater first flows into the ship and it is always exposed to the environment of seawater flow, and this flow has considerable influence on the erosion and corrosion of materials [2][3]. The corrosion resistance of the piping systems is determined by the passive film formed in the relevant environment and if these film is destroyed, the rates of erosion corrosion will be increased rapidly [4][5]. Therefore, in this study, as a study for preventing damage to the seachest of Al vessels by MGPS, the electrochemical characteristics of Al anodes for MGPS in seawater relative to changes in flow velocities and mutual effects of Al anodes and 5083-H116 Al alloy relative to changes in applied currents.
2. Experimental procedure
In this study, the Al anode was used which is the MGPS for corrosion protection. Currents were applied to an Al anode (exposed area: 600 cm2) to measure the potential of 5083-H116 Al alloy with distance for 3,600 sec. The experiment cell (1500 × 910 × 450 mm) was made of the 5083-H116 Al alloy considering the size of an actual sea chest. To examine the electrochemical characteristics with flow velocity and its effects on performance, experiments were conducted at four flow velocity variables using static state and an agitator. The electrochemical test specimens were mounted with epoxy to expose the area of 1 cm2, and all the specimens were polished with emery paper #2000 before testing, washed with ethanol and distilled water, and then dried. The electrochemical experiment measured a potential under the nature sea water solution, anodic and cathodic polarization trend were tested from the open circuit potential to +3.0 V and -2.0 V at the scan rate of 2 mV/s. For reference electrode, a silver/silver chloride electrode was used. For counter electrode, a platinum electrode was used. For Tafel analysis, was used to obtain corrosion potential and corrosion current density by polarizing ±250 mV based on the open circuit potential. Moreover, galvanostatic experiment was used scanning electron microscope (SEM) to observe specimen after applying constant current for 3,600 seconds in sea water. Cavitation test was used an ultrasonic vibration generator using piezoelectric effect in accordance with the requirements of modified ASTM-G32. It generates a rated output of 20 kHz from 60 Hz, 220 V power through an electronic circuit and supplies it to the vibrator, and the amplitude was set to 10 ㎛ by static amplitude automatic control. For generation of vibration by piezoelectric device, electric AC was applied to a conical horn to generate vibration in the axial direction. The sample having a dimension of 20 mm × 20 mm was face the horn of the vibrator, and the distance of 1 mm was maintained using a filler gauge. Weight measurement was calculated with difference before and after test. The specimen after test treated cleaning with an ultrasonic cleaner and drying it in a vacuum dryer for 24 hours. And 3D microscope was used to observe the damage of surface after experiment.
3. Experimental results and discussion
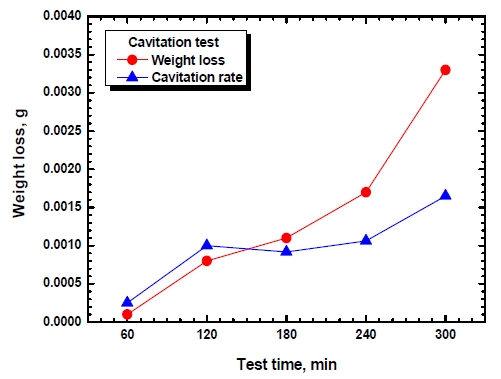
Figure 1 shows the weight loss and cavitation rate (△W(g)/△T(hr)) of the Al anode relative to the time of an erosion-cavitation experiment. Weight loss (exposed area: 1.98 cm2) caused by erosion-cavitation were measured and the results showed a very small value of 0.0001 g until 60 min. of the experimental time, almost linear increase rates until 240 min. and a weight loss of 0.0033 g after 300 min. have elapsed. The cavitation rates increased until 120 min. of the experimental time and decreased a little at the point of 180 min. while showing a tendency of slight increases thereafter until the experiment was finished. After passing the incubation period when pits began to be formed in the surface of the metal due to plastic deformation, as pits grew in the direction of the depth, the cavitation rate increased greatly to 120 min. of the experimental time. At 180 min., pits in the center merged together as soon as grew to show a tendency of slightly decreasing cavitation rates. After 240 min. of the experimental time had elapsed, merged pits grew further and at 300 min. the grown pits merged together to form larger pits, and thereby show a tendency of greatly increasing weight loss and cavitation rate.
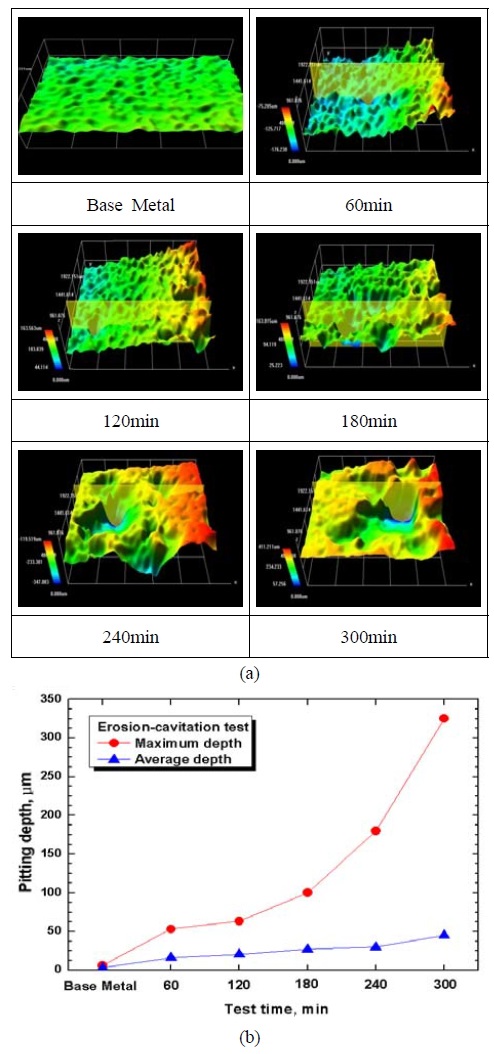
Figure 2 shows an analysis of damaged surfaces of an Al anode and the depths of pitting in the surfaces observed with a 3D microscope after conducting erosion-cavitation experiments for 60 ~ 300 min. The base metal presents a smooth shape with a roughness value of 0.1726 ㎛. In 60 min. of the experimental time, pits in sizes of maximum 53 ㎛, average 16 ㎛ were formed showing rough surface and in 120 min. pits were in a stage of growing in the direction of the depth and pits in sizes of maximum 63 ㎛, average 20 ㎛ were formed. At 180 min., pits were in a stage of merging along with growing and pits in sizes of maximum 100 ㎛, average 27 ㎛ were formed. At 240 min., large pits occurred on the center and it was judged that erosion appeared on the whole concentrated on the center of the sample to form a large pit in a size of 325 ㎛ and the sample and pits in sizes of maximum 80 ㎛, average 30 ㎛ were shown. In 300 min., pits were surroundings were eroded evenly compared to the central area to show an average depth of 45 ㎛. The average depth increased constantly over time in general while the maximum depth showed large variations.
Figure 3 presents the surface of Al alloy observed by a SEM after galvanostatic experiment conducted for 3,600 sec. in seawater. At the current densities of 1x10⁻⁶ A/cm2 and 5x10⁻⁶ A/cm2, only very small amounts of dissolution reactions around scratches were observed and generally clean surfaces were shown. At the current density of 1x10⁻⁵ A/cm2, some corrosion caused by dissolution reactions was observed and at the current density of 5x10⁻⁵ A/cm2, the dissolution reactions formed around scratches showed a slightly progressing tendency. At the current density of 1x10⁻⁴ A/cm2, a corrosion tendency toward dissolution reactions formed around scratches mixed with pit corrosion was presented. In general, at low current densities, dissolution reactions began around scratches progressed and as current densities increased, a tendency was shown that the dissolution reaction merged with sporadically occurred pit corrosion sites to damage the surface.
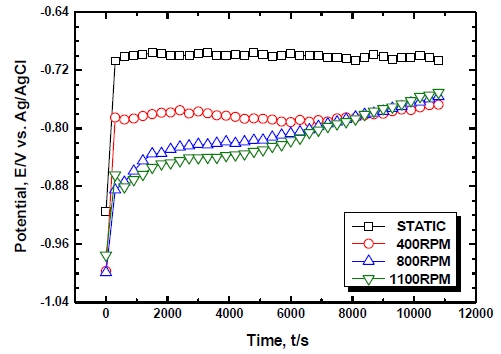
Figure 4 shows the results of potential measurement of an Al alloy relative to changes in flow velocities in seawater. In the case of static states, active potential of -0.914 V was shown at the beginning of immersion and then the potential rapidly moved toward noble direction to show a stable tendency thereafter until the end of the experiment. It is considered that the potential moved to noble direction and then showed a stable value because of the formation of a film such as an Al2O3 or Al2O3·3H2O on the surface of Al. In 400 RPM, the potential again rapidly moved toward noble direction at the beginning of immersion to show generally stable potential and then slowly increased after 6,900 sec. to show the potential of -0.767 V at the end of the experiment. In 800 RPM and 1100 RPM, the potential rapidly moved toward noble direction at the beginning of immersion and then steadily increased thereafter until the end of the experiment. In conclusion, lower potential was shown when there were flow velocities compared to static states and this is because the thickness of the diffusion layer becomes thinner due to flow velocity. Due to this decrease in the diffusion layer, the metal becomes to be subject to more active states and thus it is considered that corrosion damage will be increased compared to static states.
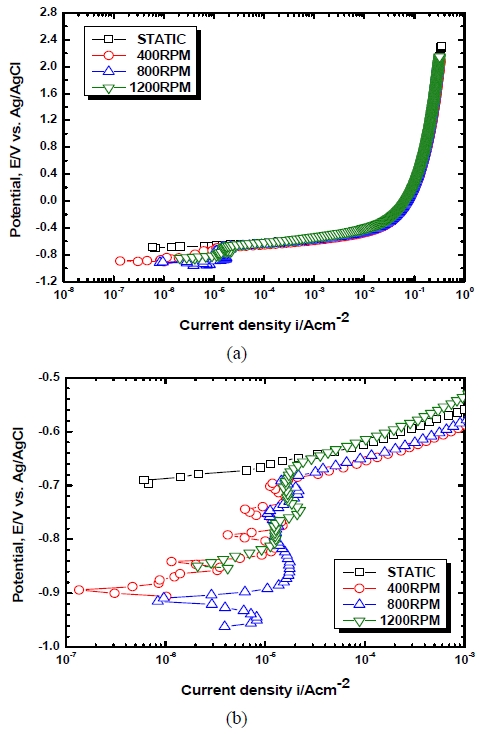
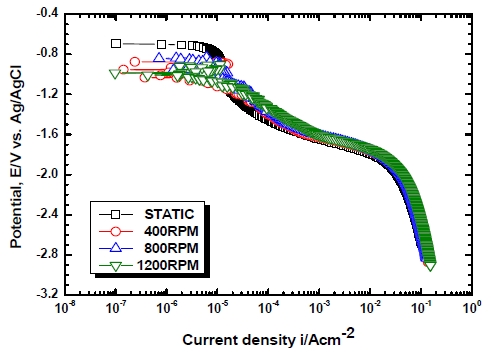
Figure 5 exhibits the tendency of anodic polarization of the Al alloy with flow velocities. No passivation range appeared at static states and as the potential increased, steady increases in current densities were observed. In 5456 Al alloy, during an anodic polarization test, an initial passivity was shown in a range where the potential was slightly higher than the open circuit potential, and then a phenomenon of rapid increases of current densities was shown thereafter due to the occurrence of pitting. Thereafter, the secondary passivity was shown due to the self healing and it could be identified that this was different from the results of previous studies[6]. To compare the passivation ranges relative to flow rates with each other, -0.857 V ~ -0.695 V was shown in 400 RPM, -0.885 V ~ -0.686 V was shown in 800 RPM and -0.805 V ~ -0.656 V was shown in 1100 RPM. A wider range of passivity was shown in 800 RPM compared to the case of 1100 RPM. It is considered that, this is because, although oxygen supply in the solution increased as the speed of revolution increased, the vortex flow created by excessive flow velocities generated air bubbles to reduce the effective area necessary for reactions between the metal and the solution [4][5]. After the pitting potential, the current density increased along with increases in the potential in almost the same tendencies.
Figure 6 shows the tendency of the cathodic polarization of the Al alloy with flow velocities in seawater. In static states, as the potential moved from the open circuit potential toward active direction, a tendency of concentration polarization caused by dissolved oxygen reduction reactions and activation polarization caused by the generation of hydrogen gas was clearly observed and generally low current densities were shown due to the effect of the concentration polarization. This concentration polarization range persisted up to around -1.645 V, but when it was placed in a more active potential range, the overall reaction was controlled by activation polarization, resulting in high current densities. This only increased the loss of the anode while little effect on corrosion protection was observed. Therefore, it is suggested that maintaining potential more positive than -1.645 V is necessary under cathodic protection. In cases where flow velocities were applied, concentration polarization did not appear clearly after the open circuit potential due to the decrease in the thickness of the diffusion layer and the mechanical damage caused by erosion. During the processes, changes in current densities from which the unstable behavior of the concentration interface could be inferred can be observed.
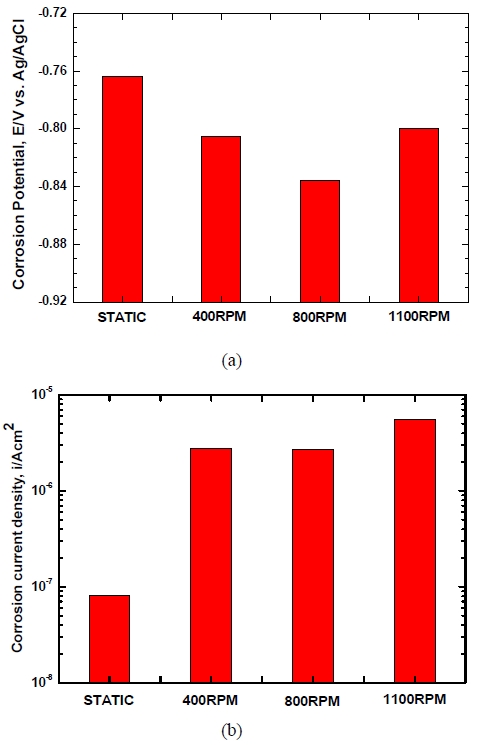
Figure 7 presents the results of a Tafel analysis of the Al alloy with flow velocities in seawater. In static states, no passivity was shown as with the anodic polarization curve while all of the cases of 400 RPM, 800 RPM and 1100 RPM showed passivity. As for corrosion potential, static states showed the noblest value of -0.764 V while the case of 800 RPM showed the most active value of -0.836 V though there were no big differences by flow velocities variable. When corrosion current densities were measured by the Tafel extrapolation method, the lowest value of 8.06×10⁻⁸ A/cm2 was shown in static states. The highest corrosion current density of 1.02×10⁻⁵ A/cm2 was shown at 1100 RPM though no big differences were observed by flow velocity variable. Therefore anode dissolution rates are high at 1100 RPM. It is mean that anode consumption rates may be increased to shorten the service life of anodes. In general, when flow rates increase, as the reaction O2 + 2H2O + 4e- → 4OH- increases due to the smooth supply of dissolved oxygen, electron consuming reactions actively occur. In addition, anode oxidation reactions, that is, the reaction Al → Al3+ + 3e- also increase and thus corrosion rates increase. However, if flow velocities go over a certain rate, excessive oxygen will be supplied to the surface of the anode and thus an oxidized layer will be formed. That is, 2Al3+ + 3O2- → Al2O3 will be formed and the corrosion rates will be temporarily decreased in some cases [7]. In conclusion, although a tendency of rapid increases of corrosion current densities compared to static was shown due to the occurrence of flows, the effect of flow velocity increases was shown to be minor. This is considered to be due to the rotating seawater flow which can reduce the thickness of mass transfer boundary layer and promote the diffusion of Al ions and corrosion products into the solution, resulting in increase of reaction rate.
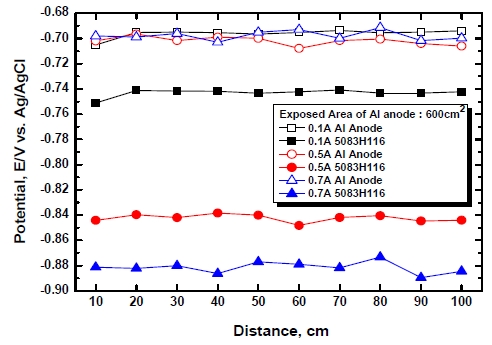
Figure 8 shows the potential of Al alloy 5083-H116 relative to applied currents and the distance variable when the area of exposure of the Al anode is 600 cm2. Since 0.8 A is applied to Al anodes in actual applications, in this study, 0.1 A, 0.5 A and 0.7 A were applied in order to avoid over protection. Regardless of applied currents and distances, the Al anode maintained similar values of -0.707 V ~ -0.691 V. On the other hand, 5083-H116 Al alloy maintained more active potential when applied currents were higher and maintained similar potential in all sections in relation to the effect of distances. The reason is considered to be the fact that since seawater is a very highly conductive solution; no big difference was shown up to 100 cm. Of the three current conditions, 0.1 A corresponds to the boundary between protection zone and non-protection zone. The 0.5 A ~ 0.7 A corresponds to protection zone as it is a concentration polarization range maintained by dissolved oxygen reduction reactions. Therefore, it is considered that at least 0.5 A of currents should be flowed. Based on Faraday’s law, it is considered that the consumption of anodes will be the largest in the case of 0.7 A.
4. Conclusions
Based on the results of the erosion-cavitation experiments, cavitation rate increased greatly until 120 min. of the experimental time and decreased a little at the point of 180 min. where pit grew and merging occurred but showed a tendency of steadily increasing consumption rates. Based on the results of the measurement of potential, cases of flow velocities showed lower potential compared to static states because the thickness of the diffusion layer becomes thinner, and due to this reduction of the diffusion layer, the material shows more active reactions. Based on the results of the anodic polarization experiments, whereas no passivation range occurred in static states, the formation of passive film was active in flow with sufficient oxygen supply and thus passivity was formed. Based on the results of the Tafel analysis, compared to static states, corrosion current densities show a rapidly increasing tendency when flow occurred. This study investigated physical properties and electrochemical characteristics of Al alloy for MGPS due to cavitation and corrosion, respectively. It is common that the presence of cavitation under a corrosive environment induces more damage due to synergistic effect[8] between cavitation erosion and electrochemical corrosion [9]. Therefore, in future work, it is valuable to plan an electrochemical-cavitation combined experiment to further examine the damage mechanism.
Acknowledgments
This research was financially supported by the Ministry of Education (MOE) and National Research Foundation of Korea (NRF) through the Human Resource Training Project for Regional Innovation (No. 2011-09-U-01-039).
Notes
References
- U. J. Lim, H. K. Jeong, K. T. Shim, and H. O. Park, “The effect of flow velocity on corrosion characteristics of A1-brass tube”, Proceedings of the Korea Society of Marine Engineering Fall Conference, p147-150, (2003), (in Korean).
-
H. R. Copson, “Effects of velocity on corrosion”, Corrosion, 16(2), p130-136, (1960).
[https://doi.org/10.5006/0010-9312-16.2.130]

-
T. Sydberger, and U. Lotz, “Relation between mass transfer and corrosion in a turbulent pipe flow”, Journal of Electrochemical Society, 129(2), p276-283, (1982).
[https://doi.org/10.1149/1.2123812]

- S. R. De Sanchez, and D. J. Schiffrin, “The use of high speed rotating disc electrodes for the study of erosion-corrosion of copper base alloys in sea water”, Corrosion Science, 28(2), p141-151, (1988).
- L. L. Shreir, Corrosion Handbook Vol. 1, Newnes-Butter Worths, p3-31, (1979).
- S. J. Kim, and J. Y. Ko, “Investigation on optimum protection potential of high-strength Al alloy (5456-H116) for application in ships”, Journal of The Korea Society of Marine Engineering, 30(1), p157-169, (2006), (in Korean).
- S. J. Kim, D. H. Kim, M. H. Lee, K. J. Kim, and K. M. Moon, “A study on the influence of Al alloy sacrificial anode efficiency due to marine environmental variation”, Journal of Ocean Engineering and Technology, 9(2), p106-111, (2000).
-
R. J. K. Wood, and S. A. Fry, “The synergistic effect or cavitation erosion and corrosion for copper and Cupro-Nickel in seawater”, Journal of Fluids Engineering, 111(3), p271-277, (1989).
[https://doi.org/10.1115/1.3243641]


