Deep learning–based drone detection with SWIR cameras
Copyright © The Korean Society of Marine Engineering
This is an Open Access article distributed under the terms of the Creative Commons Attribution Non-Commercial License (http://creativecommons.org/licenses/by-nc/3.0), which permits unrestricted non-commercial use, distribution, and reproduction in any medium, provided the original work is properly cited.
Abstract
Small unmanned aerial vehicles, commonly known as drones, and their related industries are improving in leaps and bounds. The global drone industry began with a military focus and subsequently progressed into commercial applications. Consequently, abuse cases linked to drone technology are gradually increasing. Following the technical advancement in drone technology, studies on drone detection and prevention are actively ongoing. This is one such study. Radar-based drone detection that combines various existing sensors or equipment has shortcomings, including high costs and specialist operations. Thus, this paper proposes a drone-detection system that uses only thermal images from short-wavelength infrared (SWIR) cameras. The YOLO model, which is widely used for object recognition, was used for the drone-detection algorithm. Labels were attached to 22,921 thermal images to test the constructed system; 16,121 images were used for training and the remainder for testing. The test results showed 98.17% precision and 98.65% recall. Learning through drone-image shooting in various environments, after removing static from clouds and other noise, is expected to improve detection performance in the future.
Keywords:
Drone, Anti-drone, YOLO, Object detection, Image processing, SWIR camera1. Introduction
Small unmanned aerial vehicles refer to aerial vehicles of less than 2–3 m in length that are operated remotely. The industry related to small aerial vehicles, commonly referred to as drones, is rapidly advancing [1]. In the beginning, drones were utilized for military purposes, followed by commercial applications, which are rapidly expanding. The market size of drone-related sectors is expected to grow from approximately USD 11.4 billion in 2019 to USD 20.2 billion in 2025 [2]. Drone-related technologies, such as battery-capacity expansion and drone miniaturization, are also improving in leaps and bounds, based on such drone-market growth.
Recently, drone-abuse cases by individuals or groups, involving chemicals and small terrorist bombings, have become a global problem [3]. Thus, the trend of anti-drone technology to prevent such crimes and abuse is also advancing.
Anti-drone technology refers to the combination of drone-detection technology and drone-flight neutralization technology. Currently, technologies that combine various sensors, such as ultra-high definition radar, microphones, cameras, and Radio-Frequency (RF) detection, are being developed and utilized for drone detection [4].
One representative detection technology [7] uses radar [5]-[6] or images from trick shooting. However, such detection technology has high system-configuration costs and requires specialist system operations. Therefore, it is unsuitable for personal or home uses, and it lacks portability.
Thus, this paper proposes a drone-detection system using YOLO (“You only look once”) [8], a deep learning–based algorithm that has recently been utilized in the image-processing area, utilizing only images shot by short-wavelength infrared (SWIR) cameras, without the need for special sensors or detection devices.
The paper proceeds as follows: Chapter 2 provides a simple description of the YOLO algorithm used for this study. Chapter 3 provides a detailed description of the proposed system structure, Chapter 4 evaluates the performance of the proposed system, and Chapter 5 presents the conclusion and direction for future studies.
2. Related Work
2.1 YOLO Algorithm
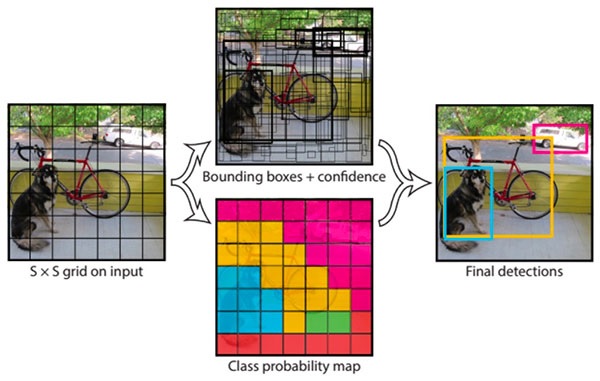
The YOLO algorithm considers the locations of bounding boxes and the class probability as a regression problem to guess the classes and locations of objects by looking at them once on video streams or images. It measures the locations of bounding boxes that cover labeled objects, after dividing the input images by an S ☓ S grid. Anchor boxes that overlap the bounding boxesthat are separated by the grid guess the objects' class probabilities, probabilities of the objects' presence, locations of object centers, and width and height of the bounding boxes to measure the confidence score. As results, the YOLO network outputs information on the bounding boxes and confidence score. Figure 1 shows the entire process.
In Figure 1, the bounding boxes and class probability are estimated by dividing the input images by 7 × 7 (S = 7), and the locations and classes of the objects are finally recognized by combining them. The confidence score relates to whether objects are really present in the bounding boxes and how much the concerned class is reflected. It can be calculated as shown in Equation (1).
| (1) |
where IoU (Intersection over Union) is the value resulting from dividing the size of the intersection of the correct-answers box and the prediction box by the size of the union, referring to the degree of overlap. In other words, if there is no intersection, IoU is 0, and if they completely overlap, it is 1.
2.2 YOLO v4
YOLO v4 [10] is the latest YOLO-algorithm version released in 2020. Figure 2 shows the object-detection process for YOLO v4.
Data input through a Convolutional Neural Network (CNN) using input images are divided into various channels through the backbone–neck module. Objects are detected through the basic YOLO algorithm for a grid divided in this manner. The performance of YOLO v4 has been improved from the previous method, which used YOLO v3 [11] as the head, a CSP (crossstage partial) network [12] as the backbone, and SPP (spatial pyramid pooling) [13] as the neck with a PAN (path-aggregation network) [14]. Therefore, to improve the performance of the preceding research, this study constructs an image analyzer with YOLO v4.
2.3 CSP
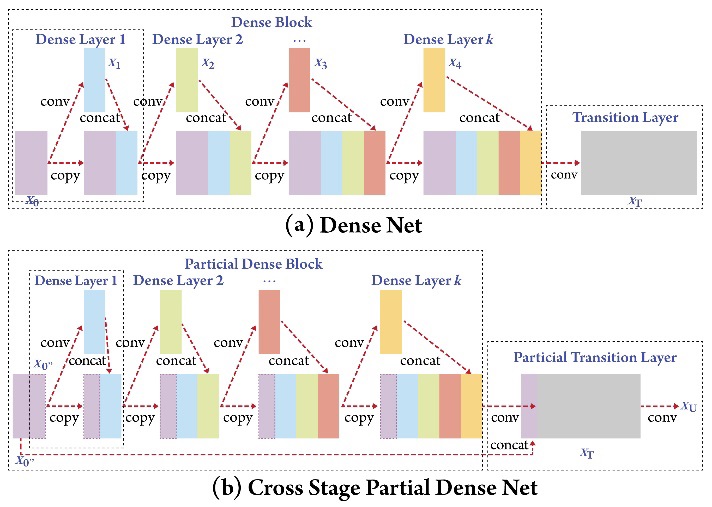
CSP is an optimization method that reduces the computation by 20% by removing the values of repeated gradients generated from the CNN learning process. Figure 3 shows the differences between networks where the CSP method is applied and not applied.
In Figure 3, while (a) shows the images going through the dense block using all of the output of the first layer, (b) shows only some passing through the partial dense block, with the remnant conveyed to the transition layer before being combined.
Through this process, the values of repeatedly computed gradients can be removed when the error back-propagation algorithm is applied to the CNN.
2.4 SPP
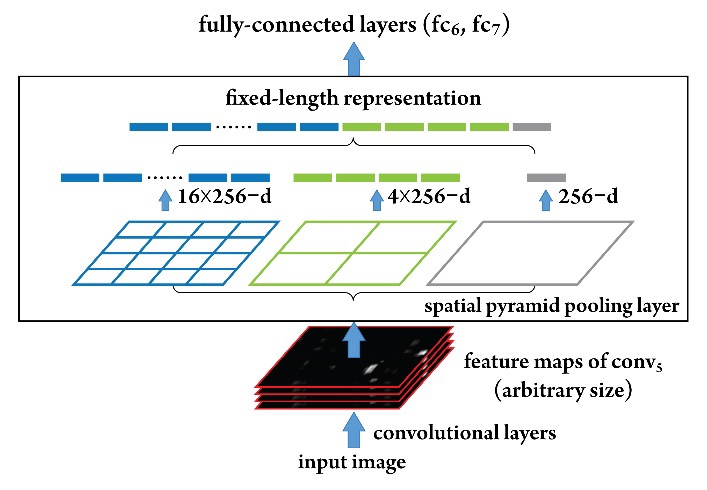
SPP is a method to improve accuracy, breaking away from using only fixed-sized images, which was pointed out as a limitation of the YOLO algorithm. Figure 4 shows the SPP network structure, with examples from specific networks.
In Figure 4, feature maps for as many filters as went through the convolution layer go through the SPP network. Additionally, they are converted to fixed-sized output data. As the CNN-based YOLO algorithm could only use fixed-sized images as input data, the learning-data categories became narrower, or the original images had to be modified or cut. This was attributed to the fact that each neuron had a fully connected structure in the CNN structure. SPPs enable the use of various-sized images for input; thus, they simultaneously break away from this structure and the fixed-sized output.
2.5 PAN
PAN, as a segmentation model, resolves imbalances in feature information through changes in the network structure because low-level features have less influence on the results than high-level features do on the final output layer in the previous CNN-layer structure. This method is referred to as bottom-up path augmentation.
3. Drone-Detection System with SWIR Cameras
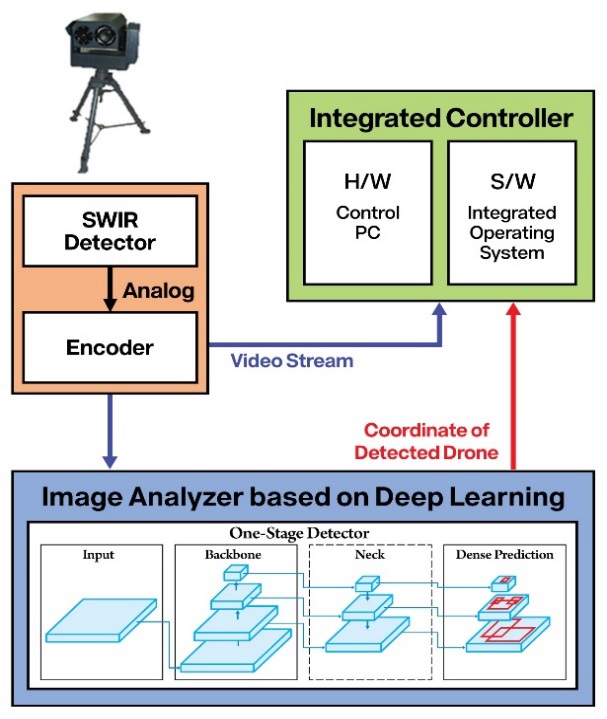
Figure 5 shows the entire configuration diagram of the proposed deep learning–based drone-detection system with SWIR cameras. The proposed system is composed of an image analyzer and an integrated controller. The image analyzer is a deep learning–based drone-detection system, as described in Chapter 2. The integrated controller controls the pan-tilt and SWIR cameras, displays images from the SWIR cameras, receives event information from the image analyzer, and displays it by overlapping it over the SWIR images when events, e.g., drone detection, occur. The following paragraphs provide detailed explanations of the image-analyzer and integrated-controller systems.
3.1 Deep learning–based image analyzer
The deep learning–based image analyzer detects the locations of drones after receiving input thermal images from the SWIR cameras; it transmits the results and event information to the integrated controller.
The deep-learning model uses the YOLO v4 algorithm described in Chapter 2. The thermal images used for input are divided based on frames and converted to one image per frame. The proposed system divides images based on 30 frames per second.
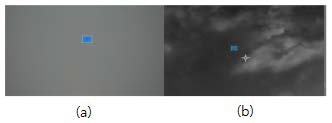
Figure 6 shows examples of the drone locations on the divided images. (a) shows the image of a drone flying on an overcast day with thick clouds. (b) is a shot of a drone flying on a fine, slightly cloudy day. The blue boxes in each image are labels attached to the images to indicate the locations of the drones that should be detected.
The locations of the drones marked in Figure 6 are converted to the same type of vertex coordinate as shown in Figure 7. The numbers in Figure 7 represent the object’s class number, x-coordinate, y-coordinate, width, and height, respectively.
Each value in Figure 7 shows the class numbers of the objects, x- and y-coordinates of the bounding boxes, width, and height in sequence. Each vertex coordinate is considered a bounding box and saved as a text file. Information on the bounding boxes of each image is used as learning data for the deep-learning model (YOLO v4). When the learning is completed, according to the learning algorithm described in Chapter 2, the drone locations are detected on the input images before the results are sent to the integrated controller.
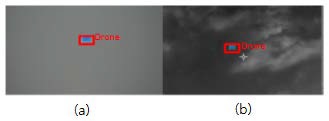
Figure 8 shows an example of how the drones detected through the deep learning–based image analyzer are displayed on the monitor of the integrated controller. The coordinates of the detected drone in Figure 5 are output by the image analyzer with a data type that matches the input data in Figure 7. The data are produced in the order of class numbers, x- and y-coordinates of the detected bounding boxes, width, and height. These data are sent to the integrated controller to display red bounding boxes. The names of the concerned objects are attached to the upper right of the bounding boxes on the monitor images of the integrated controller.
3.2 Integrated Controller
The integrated controller controls the pan-tilt and SWIR cameras, displays the images input from the SWIR cameras, receives event information, e.g., the locations and movements of recognized drones, from the image analyzer, and displays the information by overlaying it on the images from the SWIR cameras already displayed. The detailed hardware configuration of the integrated controller is shown in Table 1.
The integrated controller does not simply detect drones; it also displays their routes by tracking them. It allows users to easily see the detected drones by tracking their routes, even when they are misrecognized.
4. Experiments
4.1 Experimental Environment
This study upgraded the YOLO algorithm version from v3 to v4 by developing an experiment from preceding research [15]. It simultaneously quadrupled the volume of drone images as learning data from 5,734 to 22,921. The increased learning data were shot directly by SWIR cameras. Thirty image frames per second were obtained by flying small drones over 1.5-2 km distances.
A program called Darklabel was used to establish these learning data [16]. The learning data were established by attaching labels, x-coordinates, y-coordinates, width, and height values to all the images obtained through this program. Out of 22,921 images of established learning data, 21,437 images included drones and 1,484 images did not. Seventy percent of the data were established for training and 30% were used for testing. Consequently, 16,121 images were used for training, with 6,800 used for testing.
4.2 Parameters and Deep Learning–Model Structure
The batch size and subdivision values were all set to 64, as hyperparameters used for training, with the epoch number at 61,000. The computing resources used for training are as shown in Table 2 and are the same as those in the preceding study [15].
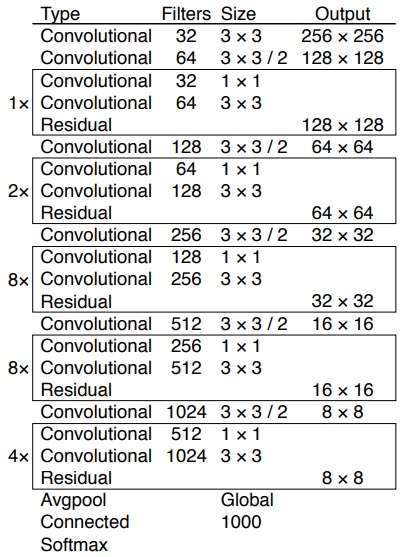
The YOLO v4–darknet53–conv.137 deep-learning model was used for training. The network structure is as shown in Figure 9.
4.3 Performance Test and Discussion
The deep-learning model was trained and tested using the model shown in Figure 9. Table 3 shows the test results expressed in a confusion matrix.
In Table 3, images including drones are marked as positive (P), with those not including drones marked as negative (N). Thus, TP (true positive) refers to the frequency of accurate predictions of the presence of drones; false positive (FP) is the frequency of predictions of the presence of drones, when no drones are present. Furthermore, FN (false negative) refers to the frequency of predictions of the absence of drones, when drones are actually present, and TN (true negative) is the frequency of accurate predictions of the absence of drones. Table 4 shows the results of the performance test using Table 3.
The precision in Table 4 is the measurement of the accuracy of the predictions of the presence of drones; the precision of the proposed system is 98.17%. This means that its prediction results are mostly accurate. Recall is a measurement of how accurately a system predicts images including drones; the recall of the proposed system is 94.65%. This means that it does not detect about five percent of drones; hence, it has considerable room for improvement.
The F1 measurement (F1 score) is the harmonic mean of the precision and recall; the F1 measurement of the proposed system is 96.38%. The accuracy is a measure of how accurately it predicts all classes or labels, and the accuracy of the proposed system is 93.3%, with room for improvement. The false-alarm rate is the rate of incorrect predictions about images without drones, predicting that they are present. The false-alarm rate of the proposed system was 28.25%, which is very high. The specificity is the rate at which the system accurately predicts images without drones, predicting that drones are not present. The specificity of the system was 71.75%.
In summary, our system still has considerable room for improvement in terms of the false-alarm rate and specificity. It is believed that the proposed system recognizes clouds or other noise as drones because the drones are relatively small in the remotely shot images. It is deemed that additional studies on removing such noise should be conducted in the future.
Furthermore, the proposed system not only detects drones, but also tracks their locations. However, its real-time tracking function was not reflected in the test. In other words, consecutive images were not used as test data; therefore, its location-tracking function was not tested.
4.4 Analysis in Comparison with Preceding Research
This study was a further development of the methodology of a previous study and contains four differences, which are summarized in Table 5.
This study updated the composition of the deep learning–based image analyzer of the preceding research [15] from the YOLO v3 algorithm to YOLO v4, and quadrupled the volume of learning data from 5,734 images in the previous study to 22,921, to enhance the detection accuracy of the image analyzer.
Moreover, the deep-learning model was transplanted to its integrated controller, the embedded hardware, to raise its actual usability. In the previous study, drone detection could only be carried out when shot images were input. However, as the system of this study uses real-time input data shot by SWIR cameras, if the integrated controller can be installed in a given environment, drone detection can be carried out anywhere.
The mAP (mean average precision), the typical performance metric in the image-processing area, was used to compare our system's performance with that of the preceding research. With the preceding research at 98.4% and that of this system at 92.9%, the preceding research was about 5.5% higher. However, this difference seems to be due to randomly sampling the evaluation data from the training data, as mentioned in the previous study. Based on this, in this study, the volume of learning data was quadrupled, and new learning data were made to study the deep-learning model, avoiding the possibility of overfitting, as was pointed out in the preceding research, whose learning data had high similarity.
5. Conclusions
A new drone-detection system was proposed and developed by improving and systemizing a preceding study [15] that detected drones using the deep learning–based YOLO algorithm. It was activated without special sensors or devices using SWIR-camera images. The 21,437 drone images, shot based on 30 frames per second, were 93.3% accurate overall. Almost no difference in accuracy was recognized with the naked eye between the data with drones and the data without drones, as the shooting distances were 1.5-2 km. This is likely because they appear very small with the camera pixels.
In future studies, the system accuracy will be improved by shooting several drones in various environments and by increasing the learning data. The interface between the deep learning–based image analyzer and SWIR cameras proposed in this paper and other surveillance systems, as well as how to exchange event information, will also be studied further.
Acknowledgments
Following are results of a study on the “Leaders in INdustry-university Cooperation+” Project, supported by the Ministry of Education and National Research Foundation of Korea. And this Work was partially supported by the Ministry of Education of the Republic of Korea and The National Research Foundation of Korea (NRF-2019M3E8A1103533).
Author Contributions
Conceptualization, H. M. Park, J. H. Kim, J. K. Kim, and S. D Lee; Hardware, J. K. Kim and S. D. Lee; Software, H. M. Park, G. S. Park, and Y. R. Kim; Validation, H. M. Park, J. H. Kim, J. K. Kim, and S. D Lee; Data Management G. S. Park and Y. R. Kim; Writing-Original Draft Preparation, H. M. Park; Writing-Review & Editing, H. M. Park, J. H. Kim, J. K. Kim, and S. D Lee.
References
- H. -G. Kim, “Analysis on patent trends for industry of unmanned aerial vehicle,” 2017 Fall Conference of the Korean Entertainment Industry Association, pp. 90-93, 2017 (in Korean).
- Commercialization Promotion Agency for R&D Outcomes, S&T Market Report, vol. 67, pp. 10, 2019 (in Korean).
- S. H. Choi, J. S. Chae, J. H. Cha, and J. Y. Ahn, “Recent R&D trends of anti-drone technologies,” Electronics and Telecommunications Trends, vol. 33, no. 3, pp. 78-88, 2018 (in Korean).
-
D. -H. Lee, “Convolutional neural network-based real-time drone detection algorithm,” The Journal of Korea Robotics Society, vol. 12, no. 4, pp. 425-431, 2017 (in Korean).
[https://doi.org/10.7746/jkros.2017.12.4.425]

- C. Seol and Y. Chung, “X-band phased array antenna radar design for drone detection,” 2019 Summer Conference of the Institute of Electronics and Information Engineers, pp. 363-365, 2019 (in Korean).
- B. T. Koo, S. H. Han, J. H. Choi, et al., “Implementation of AESA based intelligent radar system for small drone detection,” 2019 Fall Conference of the Institute of Electronics and Information Engineers, pp. 933-934, 2019 (in Korean).
-
K. -W. Lee, K. -M. Song, J. -H. Song, et al., “Implementation of radar drone detection based on ISAR technique,” The Journal of Korean Institute of Electromagnetic Engineering and Science, vol. 28, no. 2, pp. 159-162, 2017 (in Korean).
[https://doi.org/10.5515/KJKIEES.2017.28.2.159]

-
J. Redmon, et al., “You only look once: Unified, real-time object detection,” Proceedings of the IEEE Conference on Computer Vision and Pattern Recognition, pp. 779-788, 2016.
[https://doi.org/10.1109/CVPR.2016.91]

-
C. Szegedy, W. Liu, Y. Jia, et al., “Going deeper with convolutions,” Proceedings of the IEEE Conference on Computer Vision and Pattern Recognition, pp. 1-9, 2015.
[https://doi.org/10.1109/CVPR.2015.7298594]

- A. Bochkovskiy, et al., “YOLOv4: Optical speed and accuracy of object detection,” arXiv preprint arXiv:2004.10934, 2020.
- J. Redmon and A. Farhadi, “YOLOv3: An incremental improvement,” arXiv preprint arXiv:1804.02767, 2018.
- C. -Y. Wang, et al., “CSPNet: A new backbone that can enhance learning capability of CNN,” Proceedings of the IEEE/CVF Conference on Computer Vision and Pattern Recognition Workshops, pp. 390-391, 2020.
-
K. He, et al., “Spatial pyramid pooling in deep convolutional networks for visual recognition,” IEEE Transactions on Pattern Analysis and Machine Intelligence, vol. 37, no. 9, pp. 1904-1916, 2015.
[https://doi.org/10.1109/TPAMI.2015.2389824]

-
S. Liu, et al., “Path aggregation network for instance segmentation,” Proceedings of the IEEE Conference on Computer Vision and Pattern Recognition, pp. 8759-8768, 2018.
[https://doi.org/10.1109/CVPR.2018.00913]

- J. -K. Kim, et al., “Faraway small drone detection based on deep learning,” International Journal of Computer Science and Network Security, vol. 20, no. 1, pp. 149-154, 2020.
- GitHub - darkpgmr/DarkLabel: Video/Image Labeling and Annotation Tool, https://github.com/darkpgmr/DarkLabel, .

