A study on defect detection in X-ray image castings based on unsupervised learning
Copyright © The Korean Society of Marine Engineering
This is an Open Access article distributed under the terms of the Creative Commons Attribution Non-Commercial License (http://creativecommons.org/licenses/by-nc/3.0), which permits unrestricted non-commercial use, distribution, and reproduction in any medium, provided the original work is properly cited.
Abstract
In this paper, we propose a deep-learning-based defect detection system for the non-destructive quality inspection of castings based on X-ray images. Our system comprises a defect classification network and a defect search network and achieves high classification performance with limited data by minimizing the overfitting for one type of object. The proposed defect classification network determines whether the acquired X-ray image is Defect by using a convolution neural network and outputs the defect probability through softmax. Compared to binarized defect classification or defect location tracking, this method of outputting the defect probability does not require a separate reworking of the training dataset, because the data labeling is the same as the existing quality evaluation task. In addition, to detect the location of the defect causing the defect classification, our proposed defect search network estimates the region where the defect is likely to exist through a Grad-CAM based on the feature map of the classification network. The proposed network then determines the ROI around each peak of the estimated regions and detects the exact shape and location of the defect through boundary detection. It is, therefore, possible to minimize quality control costs through a precise quality analysis of each casting product by simultaneously detecting small defects that are easy to ignore because large defects are found in the image. To verify the validity of this study, an experiment was conducted by constructing a dataset of actual cast products, and the proposed detection model achieved an accuracy of 90%. In addition, by comparing the fully connected network and the SVM-based model, the model improved by about 20%, demonstrating that it is possible to detect defects without labeling defect locations.
Keywords:
Defect detection, X-ray image, Castings, Unsupervised, Deep learning1. Introduction
Product casting is an important technique applied to most developed products in a wide range of fields, including transportation and tool production. Quality control of such casting is more important in certain areas related directly to safety, and various studies on improving such techniques are actively being conducted. Product casting is critical to the level of quality because a number of voids, which are empty spaces within an object, are generated for reasons such as gases and cooling generated during the manufacturing process. Because it is difficult to ascertain the presence of such pores in metals, a non-destructive X-ray-based inspection method capable of penetrating metal has been widely applied.
An X-ray image consists of brightness data on the size of the scanned X-rays transmitted and absorbed by an object. The brightness of the pixel is proportional to the attenuation of the material, and the information is 2D-imaged at all planes. The resolution of such X-ray images depends on the function, part, shape, and material properties of each X-ray being inspected. High-resolution images can be obtained if the inspection object is a low-density material, has a small cross section, and is of a simple shape [1]-[5]. However, noises in X-ray images such as beam curing and image noise are complex and difficult to solve because of the large amplitude.
For such an X-ray analysis, several studies on simply detecting or dividing a porosity have been conducted. A porous division is being actively studied, not only in the field of casting, but also in medicine and industrial fields. However, because the properties of the materials used in each field are extremely different for each process characteristic, there are no unified standards for analysis. Therefore, most porosity segmentation and detection systems are automated only up to the imaging stage, and the rest of the system chooses a semi-automatic method that proceeds based on manpower. To solve this problem, research has been conducted on automated porosity division in various fields. In general, porosity division can be applied through an algorithm called a “segmentation recipe” and using metadata for each individual inspection object [6]. Du Plessis et al. [3] presented a semi-automated workflow for objects manufactured through additive manufacturing. In addition, Iassonov et al. [7], Rezaei et al. [8], and Tretiak et al. [9] conducted a porosity analysis to develop automated porosity partitioning algorithms in various fields. However, because these studies only suggested the possibility of automation, they did not reach a practical automated algorithm.
The significant advancements in machine learning technology centered on deep learning have recently enabled the development of automated analysis algorithms in various fields. In particular, a convolution neural network (CNN) was designed as a layered network that learns generalized features by learning the weights of convolution filters for image classification [10]-[12]. In a CNN-based network, it is easier to learn features with higher-resolution images; however, because of a large number of computations, it is essential to adjust the parameters of the CNN at an appropriate scale. U-Net [13] has recently been proposed to analyze both large and small features in high-resolution images. Yamashita et al. [14] presented an overview of a CNN in medical images, as well as a case of using machine learning for medical XCT segmentation, which improves the accuracy of examinations. However, these networks require labeled datasets to train. However, general industrial data have limitations in building a dataset through data labeling.
Therefore, in this paper, we propose a deep-learning-based defect detection system using X-ray images for detection and segmentation with minimal data labeling. Our system comprises a defect classification network and a defect search network that achieves a high classification performance using limited data by minimizing the overfitting for one type of object. The proposed defect classification network determines whether the acquired X-ray image is Defect by using the convolution neural network and outputs the defect probability through softmax. Compared to binarized defect classification or defect location tracking, this method of outputting the probability of the defects does not require a separate rework for the training dataset because the data labeling is the same as in the existing quality evaluation task. In addition, to detect the location of the defect, which is the cause of defect classification, our proposed defect search network estimates the area where a defect is likely to exist through gradient-weighted channel activation mapping (Grad-CAM), based on the feature map of the classification network. The proposed network then determines the ROI around each peak of the estimated regions and detects the exact shape and location of the defect through boundary detection. Thus, it is possible to minimize quality control costs through a precise quality analysis of each casting product by simultaneously detecting small defects that are easy to ignore, because large defects are found in the images.
2. Related Studies
2.1 Contrast Limited Adaptive Histogram Equalization
Contrast Limited Adaptive Histogram Equalization (CLAHE) is a histogram smoothing method that limits the maximum contrast and minimum intensity; it is suitable for images with uneven contrast. The CLAHE method is based on dividing an image into several non-overlapping areas of almost the same size. The separated grid is divided into a corner area, a boundary area, and an inner area according to the characteristics of each. Subsequently, gray scale mapping is applied according to each area based on the desired clip factor. This CLAHE algorithm is a preprocessing method used to check the detailed features of images with uneven contrast, such as X-rays. In the case of non-destructive testing applied to the industrial field described herein, significant scattering or shielding of X-rays occurs because metal materials are examined, and this includes large amounts of noise. Therefore, in this study, as CNN information requiring normalized input, the image is preprocessed through CLAHE and then input.
2.2 Visual Description of CNN
Deep-learning-based networks are highly black box algorithms and have significant difficulties in designing and debugging networks. A recent study on weight map recycling, such as transfer learning, proved that the same kernel can be applied to similar tasks [15]-[16]. Object detection and recognition are algorithms that fundamentally perform the same and use the same feature extraction kernel. In this study, defect determination is achieved and the location of the defect is found through the visualization of a CNN. Such CNN visualization methods are divided into deconvolution and CAM views.
A deconvolution view is the most intuitive approach to understanding images, and is used to understand the feature expression based on the activation of the map. A deconvolution [17] is a reverse convolution operation that reverses the trained CNN through a structure such as an upsampling layer and reconstructs it into a visualization architecture. The visualization result has detailed edge, edge, and color features of the lower layer, and the higher layer represents important pose transformation, class-specific transformation, and complex information.
In addition, the CAM method is of high-resolution and shows information of the CNN-based feature extractor through visualization that can be classified into classes. CAM expresses the location of a specific object by class through the probability intensity at the pixel level. In [18], because a CNN is visualized through global average pooling, the application is limited; however, in the Grad-CAM proposed in [19], because the CNN is visualized, it can be applied to various networks and its performance is improved compared to that of the CAM. In this study, Grad-CAM was applied to identify defect information through minimal data labeling.
3. Proposed Method
3.1 Defect Detection Based on Unsupervised Learning
In this paper, we propose an unsupervised-learning-based defect detection system to identify defects of non-destructive inspection targets based on X-ray images.
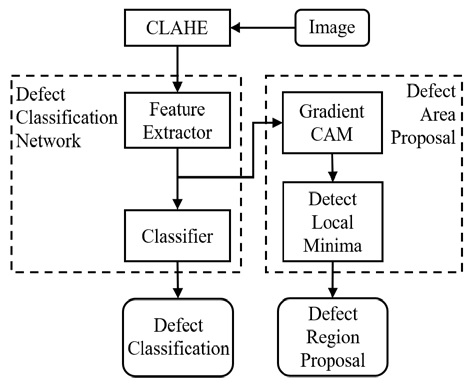
Figure 1 shows the overall architecture of the proposed system. The proposed defect detection system consists of a CLAHE-based image preprocessing algorithm, defect detection network, and defect region proposal network. The CNN-based image processing model applied in the proposed system ignores small noises and gradually extracts large features according to the depth of the layer. However, X-ray images have a large amount of noise at a high scale, such as afterimages and moire effects. Therefore, when a CNN-based image processing model is applied as is, an error is generated due to learning of the afterimage as a feature pattern. To solve this problem, the detection system proposed in this study reduces the noise level generated on a large scale in the X-ray image through the CLAHE algorithm to weaken the characteristic pattern of noise and make the shape of the defect stand out. Thus, the CNN model can effectively recognize the features and objects of the defect, thereby minimizing the problem of overfitting caused by the image captured in the local area.
The image preprocessed through CLAHE is used to determine whether it is Defect through a feature extractor composed of a CNN and a fully connected classifier. The proposed defect classification network is designed to be lighter than that of several existing classification networks because the existing network locates the exact defect through a single network and includes a defect analysis through a porosity division, which is a defect. However, because this system is designed to be separated into two stages, i.e., identifying and presenting the location of defects, it is extremely efficient compared to the previous approach because it has the same performance through two relatively light networks.
It is difficult to detect porous defects even with the naked eye because X-ray images for industrial non-destructive inspection in practice have a limited resolution. Therefore, the reliability of the human-dependent data labeling process is limited and non-uniform. In order to solve this problem and improve the reliability of the detection system, we propose an unsupervised learning-based defect domain proposal network that detects the location of defects based on whether or not an image is Defect. When a defect occurs, this network constructs an activation map for each class by obtaining the last result of the CNN-based feature extractor for the class features that are destroyed by the classifier of the defect classification network without an independent learning process in the Grad-CAM. The activation map is a map with the location and intensity of features to be classified by the feature extractor into the corresponding class. The location of this pixel matches the location of the actual image, and the larger the size is, the more main features and locations used to determine a specific class. Therefore, by finding the local maxima of this activation map and extracting the ROI around the region, the region with a high probability of a defect is extracted. Through this system, it is possible to efficiently detect existing defects through minimized data labeling and learning processes.
3.2 Defect Classification Network
The proposed defect classification network is configured to be smaller than the existing detection network for learning efficiency.
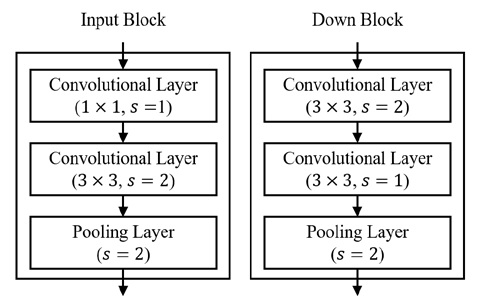
Figure 2 shows the CNN-based block applied to this network. The image-based detection network of the deep learning architecture is mainly a combination of a CNN and a pooling layer, and the performance and speed differ depending on the type. In this study, we apply a design based on the block of Res-Net 50. The left side of Figure 2 is the input block, which is the top network block, which expands the channel of the input image and down-samples it through the convolution and pooling layers. This minimizes damage to the image features and at the same time reduces the resolution of the image, thereby reducing the computational load of the subsequent down block. The down block consists of two convolutional layers and one pooling layer. The first convolution layer reduces the resolution of the input image and expands the channel to preserve the previous features. By adjusting the number of strides of the layer to 2, the down block is designed to continuously reduce the image such that the convolution filter can check the entire image. The design of this system can be easily changed to a variable resolution through the design of these separate blocks.
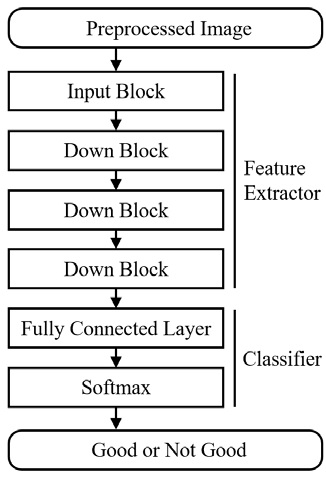
Figure 3 shows a network designed with input blocks, down blocks, and fully connected layers. The proposed defect classification network consists of one input block and three down blocks, compresses the input preprocessed image by 256-fold, and finally reduces it to a feature map. These feature maps are serialized, classified through a fully connected layer, and classified into two classes: good and poor. Compared to binary classification, this method is easier to debug through probabilistic elements, and it will be easy to add new defects in the future.
4. Experiment and results
4.1 Details of experimental X-ray data
To learn and verify the validity of the defect detection system proposed in this paper, we use a dataset constructed from an X-ray image of an actual product. The dataset is organized by classifying normal and Defect products based on the images collected during the entire investigation of the product being produced. Table 1 shows the composition and details of this dataset.
4.2 Quantitative evaluation
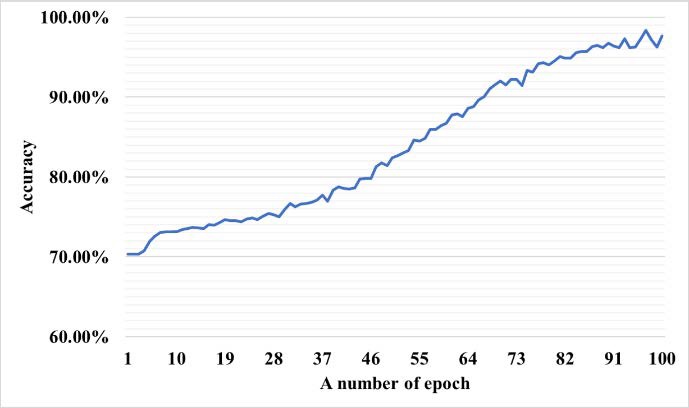
In the experiment on the proposed network, training was conducted by separating 80% of the training data and 20% of the verification data from the dataset, the results of which are shown in Figure 4.
The x-axis of Figure 4 refers to the accuracy of the data, and the y-axis refers to the epoch of the experiment. The experimental results start at 70%, which is the ratio of normal and Defect data in the first epoch, and increases more than 90% in the final 100th epoch. In X-ray images, defects can occur in all areas and their characteristics also vary; thus, unlike general object classification datasets, the diversity of the features is high, and training is difficult. Unlike the deep learning training results that converge in a logarithmic form, which is a general training result, the results in Figure 4 show the training results linearly. Therefore, if the number and clarity of the dataset are enhanced, better results can be obtained.
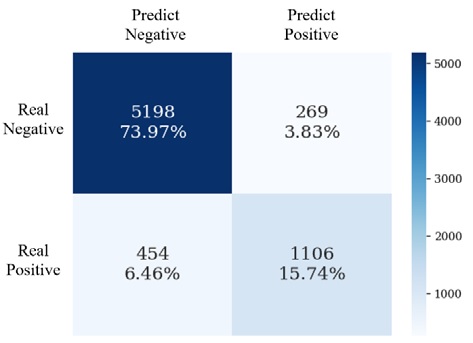
Defect detection, the goal of this study, is an important task for evaluating the quality of a product, and beyond accurately classifying good and poor, erroneous detection between such states should be minimized. The confusion matrix and F1 score were therefore evaluated in this study. Figure 5 shows the confusion matrix of the detection results. Here, the vertical axis indicates normality and failure of the actual detection results, and the horizontal axis indicates normality and failure of the predicted detection results. In the confusion matrix shown in Figure 5, the results in the diagonal direction are classified correctly, and the accuracy is 90%. The number of actual defects in the lower left corner of Figure 5, classified as normal, is approximately twice as many as in the opposite case shown in the upper-right corner. This is due to a data imbalance that has three-times the amounts of poor data and normal data. It can, therefore, be confirmed that the results of this study are stable.
Although studies on defect detection algorithms based on X-ray images are diverse, a unified analysis is difficult because there is no dataset. Therefore, to prove the validity of the model proposed in this paper, a fully connected network and a CNN and SVM were compared with the existing classification modelDefect. Table 2 analyzes the results through the F1 score, accuracy, error rate, precision, and recall. The accuracy was approximately 90% and the error rate was approximately 10%, demonstrating that a real defect detection was possible with high accuracy. The MLP model showed a significant difference in performance at 77% and the SVM at 71%. In addition, the general automated quality inspection solution must not only accurately detect, but also analyze, the problem of falsely detecting an actual Defect product. To this end, we analyzed the accuracy, precision, and reproducibility. In addition, because the precision and reproducibility are inversely proportional to each other, the F1 score is used to analyze these two indicators together. The accuracy of the detection network proposed in this paper is 0.80, the reproducibility is 0.74, and the F1 score is 0.77, which is lower than that of the comparative model. However, this occurred because the experimental data had a higher normal rate than the Defect data, and the stability of the proposed model can be verified through a high precision score.
4.3 Qualitative evaluation
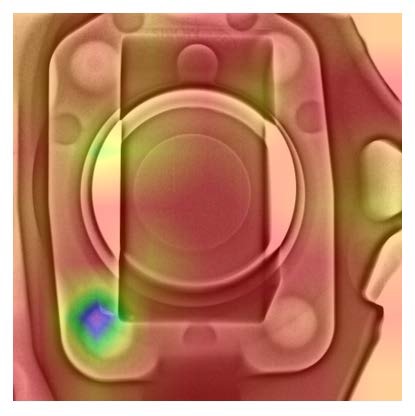
The results of determining the monitoring system function location of the defect are difficult to quantitatively analyze because the location dataset is not configured. Therefore, in this study, the results are analyzed through actual data for a qualitative evaluation of the results. If the result of the proposed detection network is output through Grad-CAM, the activation map can be found in the actual image according to the strength of the classification. Figure 6 shows that the location of the defect in the lower left corner is accurately expressed by combining the activation map and the actual image, and a high activation occurs in the defect area.
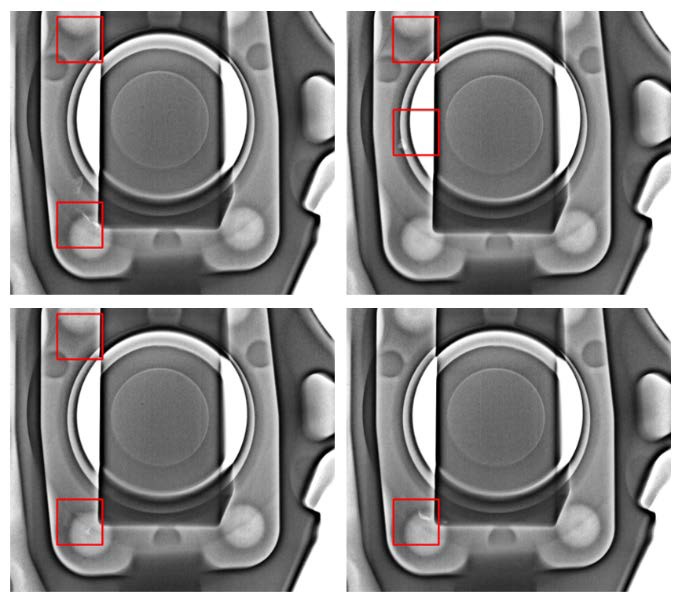
Because the result of Grad-CAM occurs as a region without outputting a single value like probability, the local maxima, which is the maximum value of the region, must be detected. Figure 7 shows the result of detecting the ROI when focusing on the local maxima detected through the proposed algorithm. In Figure 7, there is a white defect inside the red square. Thus, it can be confirmed that the system proposed in this paper properly detects defects.
5. Conclusion
In this paper, to improve the efficiency in the quality control of product castings, a network that locates and classifies defects, is proposed. The proposed network can efficiently process X-ray images based on a CNN, and does not require metadata such as location information, thus minimizing the cost of building a dataset. Training and experiments were conducted based on the X-ray image data of actual cast products, and the results showed an excellent accuracy of over 90%. In the future. Based on this study, we plan to study an algorithm that automatically clusters optimized datasets.
Acknowledgments
This work was supported by the Busan Innovation Institute of Industry, Science & Technology Planning (BISTEP) grant funded by the Busan Metropolitan City (Project: Open Laboratory Operational Business Developing and Diffusing the Regional Specialization Technology).
Author Contributions
Conceptualization, D. H. Seo; Methodology, S. H. Lee and Y. I. Joo; Software, S. H. Lee; Formal Analysis, J. H. Seong; Investigation, H. I. Seo; Resources, H. I. Seo; Data Curation, H. I. Seo; Writing Original Draft Preparation, S. H. Lee; Writing Review & Editing, S. H. Lee; Visualization, S. H. Lee; Supervision, D. H. Seo; Project Administration, D. H. Seo.
References
-
L. D. Chiffre, et al., “Industrial applications of computed tomography,” CIRP Annals, vol. 63, no. 2, pp. 655-677, 2014.
[https://doi.org/10.1016/j.cirp.2014.05.011]

-
A. D. Plessis, et al., “X-ray microcomputed tomography in additive manufacturing: A review of the current technology and applications,” 3D Printing and Additive Manufacturing, vol. 5, no. 3, pp. 227-247, 2018.
[https://doi.org/10.1089/3dp.2018.0060]

-
A. D. Plessis, et al., “Standard method for microCT-based additive manufacturing quality control 2: Density measurement,” MethodsX, vol. 5, pp. 1117-1123, 2018.
[https://doi.org/10.1016/j.mex.2018.09.006]

-
A. Thompson, et al., “X-ray computed tomography for additive manufacturing: A review,” Measurement Science and Technology, vol. 27, no. 7, 072001, 2016.
[https://doi.org/10.1088/0957-0233/27/7/072001]

-
J. P. Kruth, et al., “Computed tomography for dimensional metrology,” CIRP Annals, vol. 60, no. 2, pp. 821-842, 2011.
[https://doi.org/10.1016/j.cirp.2011.05.006]

-
I. Maskery, et al., “Quantification and characterisation of porosity in selectively laser melted Al–Si10–Mg using X-ray computed tomography,” Materials Characterization, vol. 111, pp. 193-204, 2016.
[https://doi.org/10.1016/j.matchar.2015.12.001]

-
P. Iassonov, et al., “Segmentation of X‐ray computed tomography images of porous materials: A crucial step for characterization and quantitative analysis of pore structures,” Water Resources Research, vol. 45, no. 9, 2009.
[https://doi.org/10.1029/2009WR008087]

-
F. Rezaei, et al., “The effectiveness of different thresholding techniques in segmenting micro CT images of porous carbonates to estimate porosity,” Journal of Petroleum Science and Engineering, vol. 177, pp. 518-527, 2019.
[https://doi.org/10.1016/j.petrol.2018.12.063]

-
I. Tretiak, et al., “A parametric study of segmentation thresholds for X-ray CT porosity characterisation in composite materials,” Composites Part A: Applied Science and Manufacturing, vol. 123, pp. 10-24, 2019.
[https://doi.org/10.1016/j.compositesa.2019.04.029]

-
Y. LeCun, et al., “Deep learning,” Nature, vol. 521, no. 7553, pp. 436-444, 2015.
[https://doi.org/10.1038/nature14539]

-
Y. LeCun, et al., “Convolutional networks and applications in vision,” Proceedings of 2010 IEEE International Symposium on Circuits and Systems, pp. 253-256, 2010.
[https://doi.org/10.1109/ISCAS.2010.5537907]

-
A. Krizhevsky, et al., “ImageNet classification with deep convolutional neural networks,” Communications of the ACM, vol. 60, no. 6, pp. 84-90, 2017.
[https://doi.org/10.1145/3065386]

-
O. Ronneberger, et al., “U-Net: Convolutional networks for biomedical image segmentation,” International Conference on Medical Image Computing and Computer-Assisted Intervention, pp. 234-241, 2015.
[https://doi.org/10.1007/978-3-319-24574-4_28]

-
R. Yamashita, et al., “Convolutional neural networks: An overview and application in radiology,” Insights into Imaging, vol. 9, no. 4, pp. 611-629, 2018.
[https://doi.org/10.1007/s13244-018-0639-9]

-
J. H. Seong, et al., “Selective Unsupervised Learning-Based Wi-Fi Fingerprint System Using Autoencoder and GAN,” IEEE Internet of Things Journal, vol. 7, no. 3, pp. 1898-1909, 2019.
[https://doi.org/10.1109/JIOT.2019.2956986]

-
S. H. Tae, et al., “Study on fingerprint positioning network based on radio map encoding,” Journal of the Korean Society of Marine Engineering, vol. 44, no. 4, pp. 318-324, 2020.
[https://doi.org/10.5916/jamet.2020.44.4.318]

-
M. D. Zeiler, et al., “Adaptive deconvolutional networks for mid and high level feature learning,” 2011 International Conference on Computer Vision, pp. 2018-2025, 2011.
[https://doi.org/10.1109/ICCV.2011.6126474]

-
B. Zhou, et al., “Learning deep features for discriminative localization,” Proceedings of the IEEE Conference on Computer Vision and Pattern Recognition, pp. 2921-2929, 2016.
[https://doi.org/10.1109/CVPR.2016.319]

-
R. R. Selvaraju, et al., “Grad-CAM: Visual explanations from deep networks via gradient-based localization,” Proceedings of the IEEE International Conference on Computer Vision, pp. 618-626, 2017.
[https://doi.org/10.1109/ICCV.2017.74]


