Experimental investigation into the effect of structural shape on the hydrodynamic performance of a fixed-type oscillating water column wave energy converter
Copyright © The Korean Society of Marine Engineering
This is an Open Access article distributed under the terms of the Creative Commons Attribution Non-Commercial License (http://creativecommons.org/licenses/by-nc/3.0), which permits unrestricted non-commercial use, distribution, and reproduction in any medium, provided the original work is properly cited.
Abstract
Research on renewable energy, as well as its importance, as a substitute for fossil fuels is steadily garnering increasing attention worldwide. Among various renewable energy sources, wave energy has tremendous potential owing to its high energy density and uptime compared with others. Oscillating water columns are one of the most promising types of wave energy converters. Extensive studies have been conducted to investigate the hydrodynamic performance of OWC devices. However, most studies adopted a single geometry (circular or rectangular) for this device. Therefore, this study experimentally investigated the effect of structural differences on hydrodynamic performance using two differently-shaped OWC models with the same diameter. Although the results obtained from the given conditions may indicate that there is no significant difference in the hydrodynamic performance owing to a difference in structural shape, it is premature to draw a conclusion herein. Therefore, a subsequent experiment with a 3D CFD-based RANS-VOF model will be conducted in the near future for more in-depth investigations.
Keywords:
Wave energy, Oscillating Water Column (OWC), Wave Energy Converter (WEC), Model experiment, Hydrodynamic performance1. Introduction
Today, more than 85% of the world's energy requirements relies on fossil fuels [1]. The excessive use of fossil fuels pollutes the environment and causes global ecological challenges such as global warming and sea level rise. To address such challenges, the development of novel energy sources and studies on renewable energy are essential.
Among various renewable energy resources, including hydrogen energy, fuel cells, solar energy, solar light, bioenergy, wind power, and ocean energy, wave energy is one of the most promising renewable energy resources because it has several significant advantages compared with other energy sources [2]. Additionally, wave energy has a relatively higher energy density and lower energy loss compared with other energy sources. Wave Energy Converters (WECs) are devices that adopt this wave energy to produce power. In terms of device uptime, WEC can produce power at approximately 90% of the time, whereas other types of energy converters only generate power at 20–30% of the time [3]. WECs can be classified based on their energy conversion mechanisms or installation methods- fixed and floating types [4]. The Oscillating Water Column (OWC) device generates power via three conversion stages. In the first stage, wave energy is converted into pneumatic energy in the air chamber. In the second stage, the pneumatic energy is converted into mechanical energy via the Power Take-Off (PTO) system, and in the last stage, this mechanical energy is converted into electricity.
The OWC concept was introduced by Masuda and Miyazaki in 1979 [5]. Since then, investigations into the hydrodynamic performance of OWC devices under various conditions have been carried out analytically, experimentally, numerically, or under a combination of conditions. Most previous studies adopted 2D numerical models and experiments in 2D wave flumes [6]-[16]. However, recent studies tend to focus on 3D approaches. By comparing 2D and 3D models, a recent study [17] determined that utilizing 2D numerical models to evaluate the hydrodynamic performance of OWC devices significantly overestimated the device efficiency. Elhanafi et al. [18]-[21] conducted a series of studies via numerical, experimental, or a combination of both to investigate 3D-fixed and floating offshore OWC WECs, which were under different parameters and conditions. Zabihi et al. [22] employed a 3D-fixed offshore OWC device to experimentally investigate hydrodynamic performance. Celik and Altunkaynak [23] developed a mathematical vibration model to estimate the surface elevation inside the chamber, and the results obtained were verified with experimental results. An OWC device with an L-shaped chamber was investigated via a 3D model experiment to determine the advantages of geometrical configuration [24]. Singh et al. [25] adopted 3D basin testing to investigate the dynamic response of a moored OWC under actual sea conditions. Connell et al. [26] proposed a free heaving OWC model with nonlinear PTO damping conditions using a 3D model testing and Computational Fluid Dynamics (CFD) modeling. An annular sector OWC device integrated with a dual cylindrical caisson breakwater was proposed, and its hydrodynamic performance was investigated using 3D physical model tests under different water depths, wave heights, and periods [27]. Zhan et al. [28] proposed a practical hybrid k-e/laminar CFD method for 3D models with OWCs. CFD simulations and 3D experiments were conducted to examine the hydrodynamic scaling effect of a cylindrical OWC device under various parameters [29]. In general, these 3D numerical and experimental investigations focus on unique OWC devices, with either rectangular or circular chamber cross-sections. The structural geometry of the OWC device alters the wave damping effect on the device, as well as the performance of the device. Therefore, to initiate a series of investigations into the effect of structural shape (i.e., different chamber cross-sections) on the hydrodynamic performance of OWC devices, 3D experimental approaches are proposed using two different models with the same diameter but different chamber cross-sections: right rectangular and circular sections.
2. Model Experiment
2.1 Test Facility
The experiments were performed in a tank with dimensions of 25 × 1 × 1.2 m3, which was provided by the Korea Maritime and Ocean University, Busan, Republic of Korea. The wave tank is equipped with a piston-type wave generator at one end and wave absorber at the other end.
2.2 OWC Device
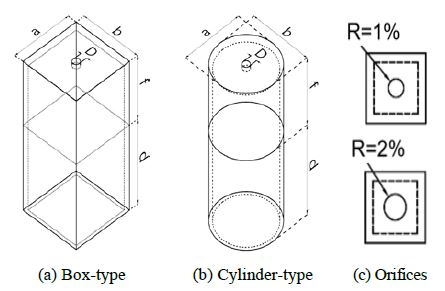
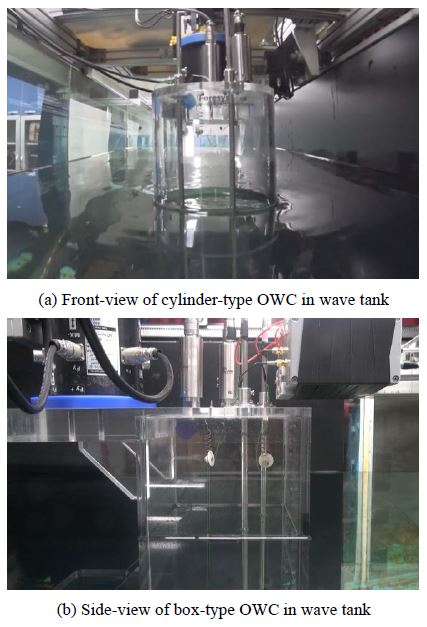
Two 1:5 3D physical scale models with the same diameter (box-type and cylinder-type OWCs) and manufactured using acrylic materials, were adopted, as shown in Figure 1 (refer to Table 1 for dimensions). In the experiments, the models were fixed in position to simulate a stationary OWC, as shown in Figure 2. Based on Froude’s similitude law, water depth was maintained at 0.8 m during the experiment, which represents 4.0 m at full-scale. To eliminate the sidewall effect, the ratio of the tank’s width to the model transverse dimension should be at least 5:1 [30]. The ratio of the model’s breadth to the tank’s width was set at 0.2 m (tank width/breadth > 5).
To investigate the performance of the OWC device, orifice plates were applied on top of the OWC chamber. The orifice plates on the chamber induce a nonlinear damping effect, which allows the nonlinear air turbine PTO to be investigated. Orifice plates with different radii (1% and 2% opening ratio of the cross-sectional area of the cylinder and box-type chamber top, respectively), but the same thickness (10 mm) of the chamber were applied.
2.3 Measurements and model performance
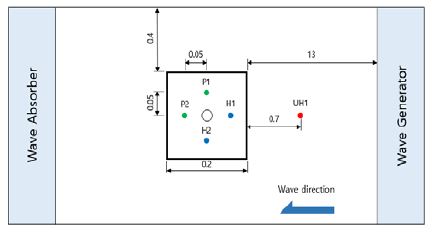
Three wave gauges (two capacitance-type in the chamber and one ultrasonic-type in front) were adopted to measure the instantaneous free-surface elevation in the chamber (H1 and H2) and incoming wave height (UH1). The measured free-surface elevation inside the chamber was averaged based on the assumption that the elevation inside the chamber was linear and not sloshed. In addition, two pressure sensors (P1 and P2) were fitted on top of the chamber to determine the differential air pressure inside the chamber. The averaged value obtained was adopted as the chamber differential air pressure (△p).
The vertical velocity of the free-surface elevation inside the chamber (dηowc/dt) was calculated by differentiating the measured time-series chamber elevation (ηowc). Then, the air flow rate (q(t)) was calculated using Equation (1) assuming a negligible air compressibility effect in the small-sized model.
| (1) |
where a and b are the width and length of the OWC chamber, respectively.
The hydrodynamic performance of the OWC model was investigated under regular waves of different heights and periods, as well as nonlinear PTO damping conditions. The incident wave and time-averaged extracted pneumatic powers of the OWC were calculated using Equations (2) and (3), respectively. By combining Equations (2) and (3), Equation (4) is obtained and can be used to calculate performance efficiency (ζ).
| (2) |
| (3) |
| (4) |
| (5) |
where PI, A, ρ, T, Cg,and k represent the mean incident wave energy flux per unit width, incoming wave amplitude water density, wave period, group velocity of incoming wave calculated by Equation (5), and wave number, respectively [31]. Additionally, PE represents the time-averaged pneumatic extracted power [32][33][34], while Δp(t) indicates the differential pressure generated by the air flow in the chamber.
The pressure coefficient refers to the pressure of the air passing through the orifice compared with the pressure of the water level in the chamber, which is calculated using Equation (6).
| (6) |
where ΔPmax is the differential air pressure amplitude, as defined in Equation (7).
| (7) |
The experiments were conducted at two wave heights (H) of 0.05 m and 0.1 m, and ten wave periods (T) from 1.1 s to 2.9 s. The total number of wave conditions is 20, as summarized in Table 2. To obtain high-quality experiment measurements, the experiment was repeated three times for each case. The time-series of 6–8 wave cycles were captured in 60 s to ensure reliability.
3. Results and Discussion
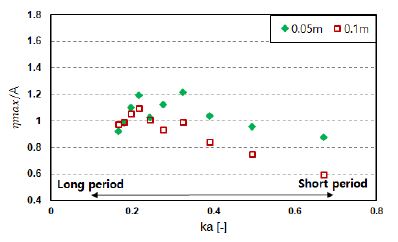
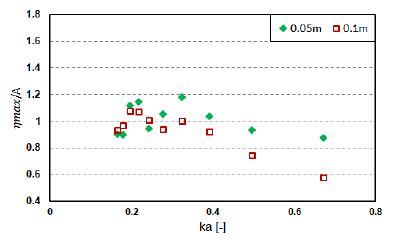
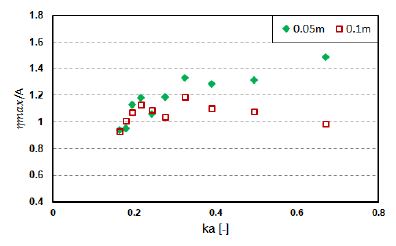
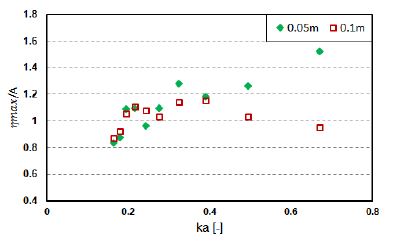
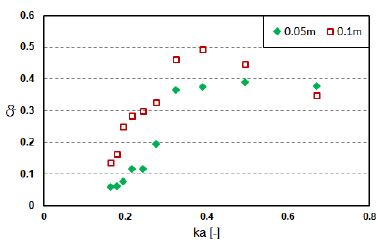
Figures 4-7 present the amplification factor (ratio between the maximum free-surface elevation, ηmax, and incident wave amplitude, A) against ka, which is a dimensionless parameter that considers the changes in wave frequency or period.
As can be observed in Figures 4 and 5 (i.e., 1% orifice), the trends of each device’s response to both wave heights are similar. In general, the amplification factor increased until it reached a peak at a certain ka value as the wave frequency increased, and then decreased continuously; however, each wave height exhibited varying peaks at different ka values. Furthermore, the surface elevations of H = 0.05 m in most frequencies were higher than those of H = 0.1 m. However, it should be noted that there was a sudden drop before a peak occurred at H = 0.05 m for both shapes.
The overall trends of each device with the 2% orifice for both wave heights (see Figures 6 and Figure 7) were similar to the amplification factor tendency of devices with the 1% orifice (i.e., increased until the peak, then decreased), except for an outlier at the highest frequency for H = 0.05 m. It is notable that the application factors of both devices with the 2% orifice for both wave heights were relatively superior at higher frequencies (i.e., ka = 0.243–0.671) than for those with 1% orifice.
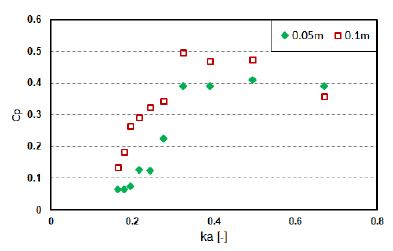
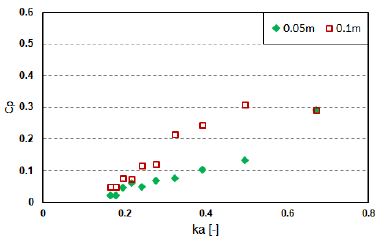
Figures 8–11 show the pressure coefficient (CP) of each device under given conditions. When the 1% orifice was attached (Figures 8 and Figure 9), the pressure coefficient for both shapes inclined as ka increased and peaked at a certain frequency, thereby indicating the resonant frequency of the chamber. After the peak, the pressure coefficient appeared to decline with a further increase in wave frequency.
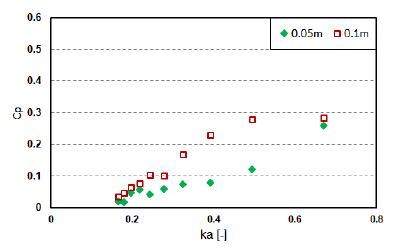
Unlike the tendency with the 1% orifice, the pressure coefficients of the 2% orifice were considered (Figures 10 and 11), and they continued to increase.
This could mean that applying different damping conditions could alter the resonance frequency of the devices. However, the size of the orifice plates was half, and the resulting pressure coefficients were not linearly related. In addition, it is notable that the pressure coefficient discrepancy between H = 0.05 m and H = 0.1 m was more significant when a lower PTO damping was applied.
Based on the amplification factor and pressure coefficient previously presented, the extracted power can be estimated using Equation (3). The efficiency of the device was defined as the ratio of the extracted power to the incident wave power, as expressed in Equation (4). It should be noted that although the air flow rate is not given, it is expected to follow the differential pressure of the devices [21].
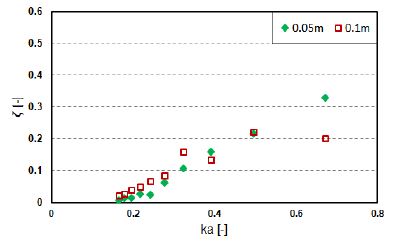
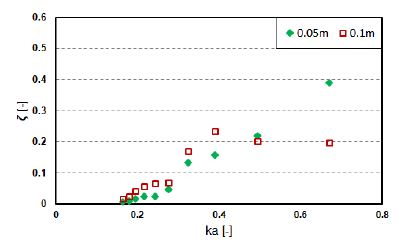
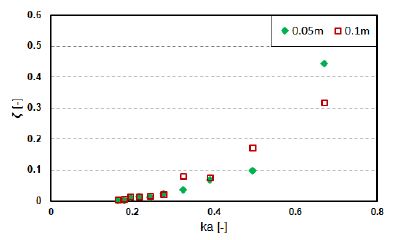
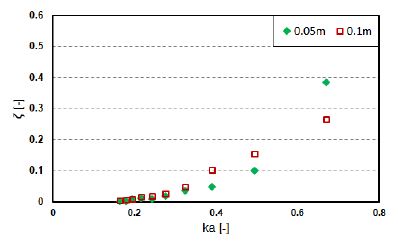
Because the differential pressure and air flow rate, which follow the aforementioned differential pressure, are the governing parameters for the power extraction, the device efficiencies were expected, as illustrated in Figures 12-15. The power extractions increased with an increase in the pressure coefficient. At a certain frequency (ka = 0.4), the cylinder-type exhibits higher efficiency when the wave height is at 0.1 m; however, the box-type tends to vary depending on PTO damping. In general, the efficiency of both devices was determined to be greater for higher wave frequencies (i.e., shorter wave periods).
4. Conclusion
In this study, we examined the hydrodynamic performances of two differently-shaped OWC models in a 1:5 scale with the same diameter (i.e., different water-plane area; rectangular and circular) under 80 test conditions: a combination of two wave heights, ten wave periods, and two PTO damping conditions for each device. For the given experimental conditions, it was inferred that no significant difference appeared in the hydrodynamic performance, owing to the shapes (box- and cylinder-type) of the OWC devices. However, it is too early to draw a conclusion as only bare minimum conditions were considered in this study. Therefore, for a deeper understanding of the effect of structural shape on the hydrodynamic performance of OWC, a subsequent experiment will be conducted with a broader range of experimental conditions, including higher PTO damping conditions and wave frequencies. In addition, extra wave probes will be installed in follow-up experiments to investigate the energy balance of two differently-shaped OWC devices. Furthermore, a fully nonlinear 3D CFD model testing based on the Reynolds-averaged Navier-Stokes (RANS-VOF) model will be performed, and its results will be verified against the experimental results obtained from further numerical approaches.
Acknowledgments
This research was a part of the project titled 'Design of Compact-sized OWC WEC (130W class) to fulfil the Power Needs of Un-electrified/Power-inaccessible Offshore Facilities', funded by the Ministry of Oceans and Fisheries, Korea.
Author Contributions
Conceptualization, H. -G. Kang and C. J. Kim; Methodology, H. -G. Kang and C. J. Kim; Experiment, Y. -K. Kim and H. -G Kang; Formal Analysis, H. -G Kang and C. J. Kim; Investigation, Y. -K. Kim, H. -G Kang, H. -D. Kang, and C. J. Kim; Resources, Y. -K. Kim, H. -G Kang, and C. J. Kim; Data Curation, H. -G Kang and C. J. Kim; Writing—Original Draft, Y. -K. Kim; Writing—Review & Editing, H. -G Kang, S. J. Lee, and H. -J. Jo; Visualization, Y. -K. Kim; Supervision, H. -D. Kang, S. J. Lee and H. -J. Jo; Project Administration, H. -J. Jo; Funding Acquisition, H. -D. Kang and S. J. Lee.
References
- BP Statistical Review of World Energy, 68th Edition, BP plc UK, 2019.
- O. Edenhofer, R. P. Madruga, and Y. Sokona et al., Renewable Energy Sources and Climate Change Mitigation: Special Report of the Intergovernmental Panel on Climate Change, Cambridge University Press, Cambridge, U.K., 2011.
-
B. Drew, A. R. Plummer, and M. N. Sahinkaya, “A review of wave energy converter technology,” Proceedings of the Institution of Mechanical Engineers, Part A: Journal of Power and Energy, vol. 223, no. 8, pp. 887-902, 2009.
[https://doi.org/10.1243/09576509JPE782]

-
A. F. O. Falcão, “Wave energy utilization: A review of the technologies,” Renewable and Sustainable Energy Reviews, vol. 14, no. 3, pp. 899-918, 2010.
[https://doi.org/10.1016/j.rser.2009.11.003]

- Y. Masuda and T. Miyazaki, “Wave power electric generation study,” Proceedings of Symposium on Wave and Tidal Energy, vol. 1, pp. B6 85-92, 1978.
-
A. J. N. A. Sarmento, “Wave flume experiments on two-dimensional oscillating water column wave energy devices,” Experiments in Fluids, vol. 12, pp. 286-292, 1992.
[https://doi.org/10.1007/BF00187307]

-
D. V. Evans and R. Porter, “Hydrodynamic characteristics of an oscillating water column device,” Applied Ocean Research, vol. 17, no. 3, pp. 155-164, 1995.
[https://doi.org/10.1016/0141-1187(95)00008-9]

-
K. Thiruvenkatasamy and S. Neelamani, “On the efficiency of wave energy caissons in array,” Applied Ocean Research, vol. 19, no. 1, pp. 61-72, 1997.
[https://doi.org/10.1016/S0141-1187(97)00008-4]

-
A. F. O. Falcao and P. A. P. Justino, “OWC wave energy device with air flow control,” Ocean Engineering, vol. 26, no. 12, pp. 1275-1295, 1999.
[https://doi.org/10.1016/S0029-8018(98)00075-4]

-
R. S. Tseng, R. H. Wu, and C. C. Huang, “Model study of a shoreline wave power system,” Ocean Engineering, vol. 27, no. 8, pp. 801-821, 2000.
[https://doi.org/10.1016/S0029-8018(99)00028-1]

-
E. V. Rapaka, R. Natarajan, and S. Neelamani, “Experimental investigation on the dynamic response of a moored wave energy device under regular sea waves,” Ocean Engineering, vol. 31. no. 5-6, pp. 725-743, 2004.
[https://doi.org/10.1016/j.oceaneng.2003.09.001]

-
N. Dizadji and S. E. Sajadian, “Modeling and optimization of the chamber of OWC system,” Energy, vol. 36, no. 5, pp. 2360-2366, 2011.
[https://doi.org/10.1016/j.energy.2011.01.010]

-
B. Bouali and S. Larbi, “Contribution to the geometry optimization of an oscillating water column wave energy converter,” Energy Procedia, vol. 36, pp. 565-573, 2013.
[https://doi.org/10.1016/j.egypro.2013.07.065]

-
F. He and Z. Huang, “Hydrodynamic performance of pile-supported OWC-type structures as breakwaters: An experimental study,” Ocean Engineering, vol. 88, pp. 618-626, 2014.
[https://doi.org/10.1016/j.oceaneng.2014.04.023]

-
Y. Luo, J. -R. Nader, P. Cooper, and S. P. Zhu, “Nonlinear 2D analysis of the efficiency of fixed oscillating water column wave energy converters,” Renewable Energy, vol. 64, pp. 255-265, 2014.
[https://doi.org/10.1016/j.renene.2013.11.007]

-
D. Z. Ning, J. Shi. Q. -P. Zou, and B. Teng, “Investigation of hydrodynamic performance of an OWC (oscillating water column) wave energy device using a fully nonlinear HOBEM (higher-order boundary element method),” Energy, vol. 83, pp. 177-188, 2015.
[https://doi.org/10.1016/j.energy.2015.02.012]

-
A. Elhanafi and C. J. Kim, “Experimental and numerical investigation on wave height and power take–off damping effects on the hydrodynamic performance of an offshore–stationary OWC wave energy converter,” Renewable Energy, vol. 125, pp. 518-528, 2018.
[https://doi.org/10.1016/j.renene.2018.02.131]

-
A. Elhanafi, G. Macfarlane, A. Fleming, and Z. Leong, “Investigations on 3D effects and correlation between wave height and lip submergence of an offshore stationary OWC wave energy converter,” Applied Ocean Research, vol. 64, pp. 203-216, 2017.
[https://doi.org/10.1016/j.apor.2017.03.002]

-
A. Elhanafi, G. Macfarlane, A. Fleming, and Z. Leong, “Scaling and air compressibility effects on a three-dimensional offshore stationary OWC wave energy converter,” Applied Energy, vol. 189, pp. 1-20, 2017.
[https://doi.org/10.1016/j.apenergy.2016.11.095]

-
A. Elhanafi, G. Macfarlane, A. Fleming, and Z. Leong, “Experimental and numerical investigations on the hydrodynamic performance of a floating–moored oscillating water column wave energy converter,” Applied Energy, vol. 205, pp. 369-390, 2017.
[https://doi.org/10.1016/j.apenergy.2017.07.138]

-
A. Elhanafi, G. Macfarlane, A. Fleming, and Z. Leong, “Experimental and numerical measurements of wave forces on a 3D offshore stationary OWC wave energy converter,” Ocean Engineering, vol. 144, pp. 98-117, 2017.
[https://doi.org/10.1016/j.oceaneng.2017.08.040]

-
M. Zabihi, S. Mazaheri, and M. M. Namin, “Experimental hydrodynamic investigation of a fixed offshore Oscillating Water Column device,” Applied Ocean Research, vol. 85, pp. 20-33, 2019.
[https://doi.org/10.1016/j.apor.2019.01.036]

-
A. Çelik and A. Altunkaynak, “Determination of damping coefficient experimentally and mathematical vibration modelling of OWC surface fluctuations,” Renewable Energy, vol. 147, Part 1, pp. 1909-1920, 2020.
[https://doi.org/10.1016/j.renene.2019.09.104]

-
K. Rezanejad, A. Souto-Iglesias, and C. G. Soares, “Experimental investigation on the hydrodynamic performance of an L-shaped duct oscillating water column wave energy converter,” Ocean Engineering, vol. 173, pp. 388-398, 2019.
[https://doi.org/10.1016/j.oceaneng.2019.01.009]

-
U. Singh, N. Abdussamie, and J. Hore, “Hydrodynamic performance of a floating offshore OWC wave energy converter: An experimental study,” Renewable and Sustainable Energy Reviews, vol. 117, 2020.
[https://doi.org/10.1016/j.rser.2019.109501]

-
K. O. Connell, F. Thiebaut, G. Kelly, and A. Cashman, “Development of a free heaving OWC model with non-linear PTO interaction,” Renewable Energy, vol. 117, pp. 108-115, 2018.
[https://doi.org/10.1016/j.renene.2017.10.027]

-
J. Chen, H. Wen, Y. Wang, and B. Ren “Experimental investigation of an annular sector OWC device incorporated into a dual cylindrical caisson breakwater,” Energy, vol. 211, 2020.
[https://doi.org/10.1016/j.energy.2020.118681]

-
J. M. Zhan, Q. Fan, W. Q. Hu, and Y. J. Gong, “Hybrid realizable k-ε/laminar method in the application of 3D heaving OWCs,” Renewable Energy, vol. 155, pp. 691-702, 2020.
[https://doi.org/10.1016/j.renene.2020.03.140]

-
S. Dai, S. Day, Z. Yuan, and H. Wang, “Investigation on the hydrodynamic scaling effect of an OWC type wave energy device using experiment and CFD simulation,” Renewable Energy, vol. 142, pp. 184-194, 2019.
[https://doi.org/10.1016/j.renene.2019.04.066]

- S. K. Chakrabarti, Offshore Structure Modeling, Singapore: World Scientific Publishing Co. Pte. Ltd., 1994.
- R. A. Dalrymple and R. G. Dean, Water Wave Mechanics for Engineers and Scientists, World Scientific Publishing Co. Pte. Ltd, 1991.
- A. C. Mendes and W. M. L. Monteiro, “Performance analysis of a model of OWC energy converter in non-linear waves,” Proceedings of the 7th European Wave and Tidal Energy Conference (EWTEC), 2007.
-
R. Pascal, G. Payne, C. M. Theobald, and I. Bryden, “Parametric models for the performance of wave energy converters,” Applied Ocean Research, vol. 38, pp. 112-124, 2012.
[https://doi.org/10.1016/j.apor.2012.06.003]

-
D. Z. Ning, R. -Q. Wang, Q. -P. Zou, and B. Teng, “An experimental investigation of hydrodynamics of a fixed OWC wave energy converter,” Applied Energy, vol. 168, pp. 636-648, 2016.
[https://doi.org/10.1016/j.apenergy.2016.01.107]


