Numerical study on the lift-drag and cavitation performances of a two-dimensional hydrofoil using the Coanda effect
Copyright © The Korean Society of Marine Engineering
This is an Open Access article distributed under the terms of the Creative Commons Attribution Non-Commercial License (http://creativecommons.org/licenses/by-nc/3.0), which permits unrestricted non-commercial use, distribution, and reproduction in any medium, provided the original work is properly cited.
Abstract
As international regulations on environmental pollution become stricter, new and existing ships are required to reduce their carbon emissions. Therefore, it is essential to develop a high-performance ship with low carbon emissions. A variety of high-performance propellers are being developed worldwide to achieve this goal. In this study, the Coanda effect was applied to a two-dimensional hydrofoil for the development of a high-performance propeller. CFD (Computational Fluid Dynamics) was used to compare the lift and drag performance between NACA66(mod.) and Coanda hydrofoils in two dimensions. The pressure distribution of each hydrofoil was compared for the same lift coefficient. The pressure distribution and cavitation performance of the hydrofoil with the Coanda effect were also compared with those of the NACA66(mod.) hydrofoil.
Keywords:
Hydrofoil, Coanda effect, Lift, Drag, Cavitation, CFD1. Introduction
In 2013, the International Maritime Organization (IMO) established the Energy Efficiency Design Index (EEDI). Beginning in 2020, regulations on pollutant emissions will be tightened. For example, pollutant emission standards for SOx in ship fuel have been reduced from 3.5% to 0.5%. Therefore, there has been increased interest in improving the operational efficiency of ships to save fuel.
Attempts have been made to optimize the propeller design and to apply energy-saving devices that are installed before and after the propeller position in order to improve the propulsion efficiency of ships. However, design improvements are unable to facilitate dramatic fuel savings. Screw propellers have been used in ships for more than 300 years. They use the lift generated by the rotation of the propeller blades to generate thrust. Through much research and development, screw propellers are currently the most efficient ship propulsion devices in use. Therefore, it is difficult to improve the efficiency by more than 2%, even with optimization tools and analysis techniques. Thus, in order to significantly improve the efficiency of existing propulsion systems, a new type of propulsion system must be developed.
Many studies have already been conducted in the field of aerodynamics, such as thrust deflection of jets and high-lift systems (Pfingsten and Padespiel 2007, Yoon et al. 2012, Harijono Djojodihardjo 2013, Park et al. 2016). However, there are relatively few studies related to the Coanda effect in the field of fluid dynamics. In this study, the Coanda effect was applied to a hydrofoil to develop a new type of high-efficiency propeller. In similar studies, the Coanda effect was applied to a fin stabilizer to improve lift efficiency (Oh et al. 2003, Seo et al. 2016). In the studies, a cylindrical slit was installed on the trailing edge of the hydrofoil, and jets were injected through the slit. The jet flow along the cylinder surface is through the Coanda effect, which induces the downwash of the fluid at the top side of the hydrofoil. Thus, the hydrofoil can achieve lift without an angle of attack (AOA).
The configuration for improving the performance of the hydrofoil includes the internal structure of the modified hydrofoil for injecting the jet and the jet slit located on the surface. A conventional hydrofoil generates lift by using the AOA, which can induce a downwash. However, the AOA is limited by stall, which limits the lift. In addition, when the downwash is induced at the leading edge of the hydrofoil, cavitation occurs due to the concentration of the pressure drop on the leading edge. This could decrease the lift performance and damage the hydrofoil surface.
In the case of a hydrofoil with the Coanda effect, the direction of the jet injected from the jet slit is changed by the Coanda effect, which induces an additional downwash of the surrounding fluid. Therefore, the hydrofoil can attain a higher lift than a conventional hydrofoil at the same AOA. In contrast to a conventional hydrofoil with the same lift, the induction of the downwash is divided between the leading edge and the trailing edge. Therefore, the pressure drop is divided between the leading edge and trailing edge by the injected jet, which could combat the cavitation problem.
2. Geometry and Numerical Method
2.1 Geometry of Coanda hydrofoil
The Coanda hydrofoil design is based on the NACA0012 cross section from the National Advisory Committee for Aeronautics (NACA), and its shape has been referenced in previous studies (Seo et al. 2016). To install the jet slit, the maximum thickness distribution of the NACA0012 cross section was extended to the trailing edge, and a cylindrical jet nozzle was placed at the trailing edge. The height of the slit is 0.5% of the chord length, and the shape is displayed in Figure 1.
The length of the chord depicted in Figure 1 is 0.15 m, but the numerical simulations were performed with chord lengths of 0.1 m and 0.15 m, which is controlled by the parallel part of the hydrofoil. The numerical results were compared with those of an NACA66(mod.) having a chord length of 0.15 m.
2.2 Numerical method
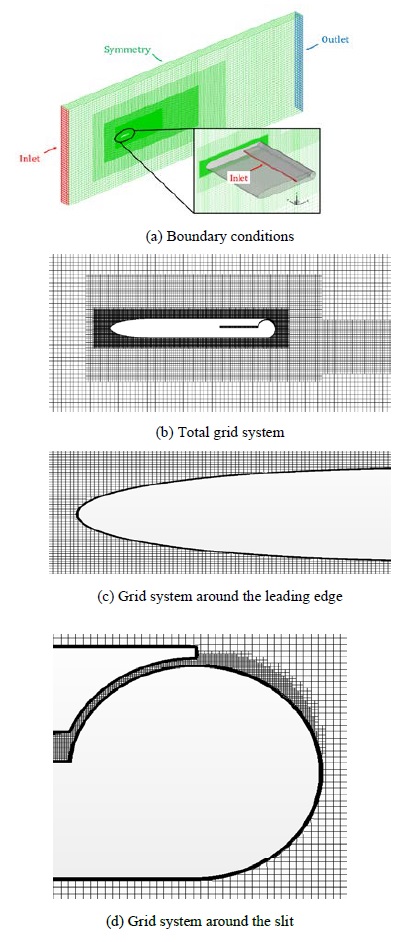
STAR-CCM+ was used for the numerical simulation. It is a commercial software that is usually used to simulate complex flows. It supports flexible changes to the grid system, which makes it relatively easy for users to simulate problems that are difficult to represent when generating a grid system. Continuous equations and the Reynolds-Averaged Navier-Stokes (RANS) equations were considered as the governing equations. Because the jet injection area is required to define the jet momentum coefficient, a 2D calculation was performed using symmetry conditions in a thin 3D domain.
A three-dimensional physical model of implicit unsteady and incompressible flow is considered. The software is based on the finite volume method, and the diffusion and convection terms are discretized by the second-order central differential scheme and the second-order upwind scheme. The continuous equation and RANS equations are expressed as follows:
| (1) |
The SST k−ω model was used as the turbulence model. This is the model most commonly used for the analysis of turbulent flows, such as propeller wakes. The SST k−ω model combines the k−ω model with the k−ϵ model and the Johnson–King model, depending on the characteristics of the flow field.
2.3 Grid system
Figure 2 illustrates the grid system used for the numerical simulation of the Coanda hydrofoil. There are 1.1 million grid elements. A total of 24 prism layers were used inside the slit to maintain y+ less than 1 on the wall at the slit.
3. Lift and Drag Performance
3.1 Numerical simulation of the NACA66(mod.)
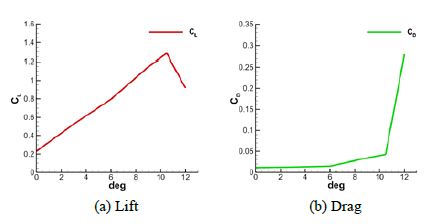
The lift and drag performance of the Coanda hydrofoil was compared with that of the NACA66(mod.) cross section used for various marine propellers, as depicted in Figure 3. The chord length of the NACA66(mod.) was 0.15 m, and the AOAs considered were 0°, 3°, 6°, 9°, 10.5°, and 12°. The inflow velocity was 5 m/s. Figure 4 presents the numerical results of the non-dimensionalized performance of the NACA66(mod.). In the case of NACA66(mod.), it can be observed that the stall occurs near 10°, and the lift coefficient at this angle is approximately 1.3.
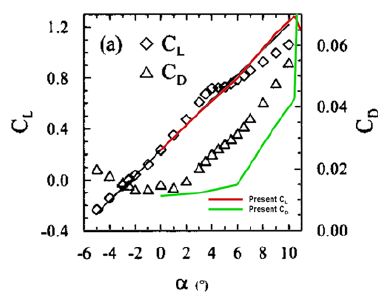
The above results are compared with the experimental data (Leroux et al. 2004) studied with the same hydrofoil in Figure 5. The Reynolds numbers of the experiment of the reference paper and the numerical simulation in this study are both approximately 8×10⁵.
Overall, the lift is well matched, but the drag of the numerical simulation is relatively low. This discrepancy is due to the turbulence model applied for the numerical simulation.
The pressure distribution at 6° is compared with that mentioned in the reference papers based on the same hydrofoil (Leroux et al. 2004, Seo and Lele 2009) in Figure 6. It was observed that the pressure distribution for the chord direction matches well.
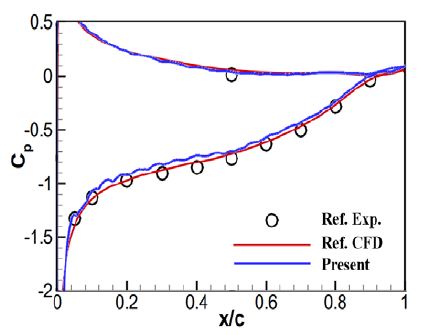
Comparison of the pressure distribution at 6 ° with the reference paper (Leroux et al. 2004, Seo and Lele 2009)
Even though the Reynolds numbers applied in the experiment and simulation were in a transition region, the fully turbulent model was used in the numerical simulation for simulation efficiency because the injected jet is a turbulent region. Since the lift and pressure distributions match well, a further study was conducted based on these simulation conditions.
3.2 Numerical simulation of Coanda hydrofoil
The flow rate of jet used to simulate the performance of Coanda hydrofoil is determined by the jet momentum coefficient:
| (2) |
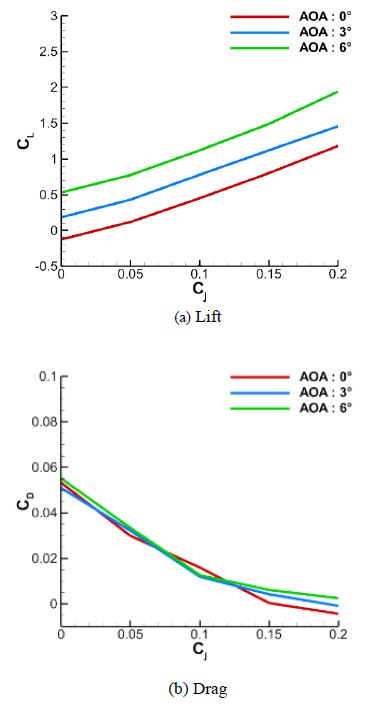
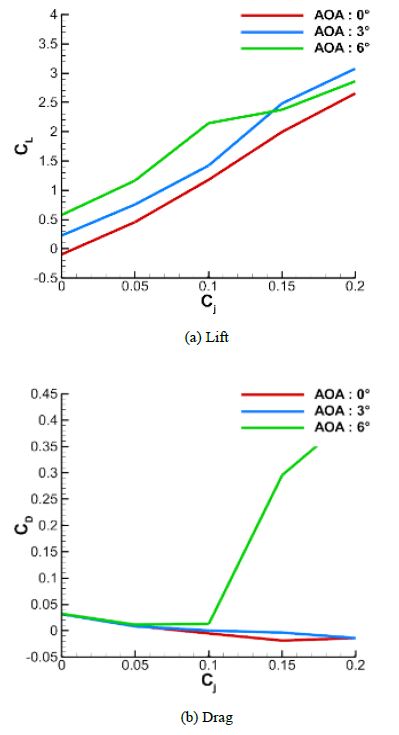
where is the mass flow rate, Vjet is the jet velocity at the slit, S is the cross-sectional area of the hydrofoil, and V∞ is the inflow velocity. The numerical simulation was performed at AOAs of 0 °, 3 °, and 6° with a chord length of 0.1 m, which is controlled by the parallel part of the Coanda hydrofoil. The numerical results of the lift and drag performance were obtained with Cj values of 0, 0.05, 0.1, 0.15, and 0.2, and an inflow velocity of 5 m/s. The non-dimensionalized performance of the 0.1-m Coanda hydrofoil is shown in Figure 7.
With a chord length of 0.1 m, the lift coefficient increased to 2.0 or more without stall according to the AOA and Cj. The drag coefficient is higher than that of NACA66(mod.) at low Cj because the maximum thickness distribution of NACA0012 was extended to the trailing edge of the hydrofoil, which increased the overall volume. However, if Cj increased, the drag was gradually reduced owing to the thrust by the jet injection.
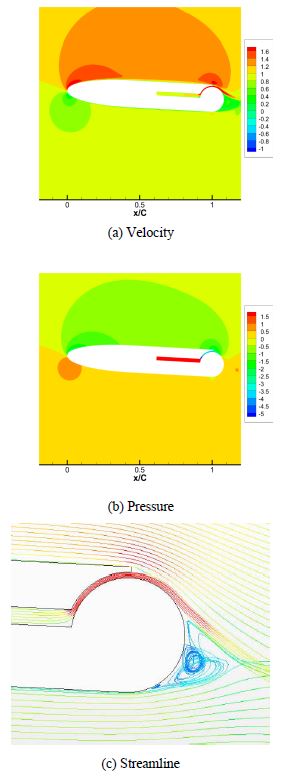
In order to analyze the surrounding flow of the Coanda hydrofoil, Figure 8 presents the velocity, pressure, and streamline contours at AOA=3° and Cj=0.2. In the case of the conventional hydrofoil, the pressure drop was concentrated on the leading edge because the induction point of the downwash was located on the leading edge. However, the induction point on the Coanda hydrofoil is divided between the leading edge and trailing edge by the Coanda effect due to the jet injection, so the pressure drop gets dispersed.
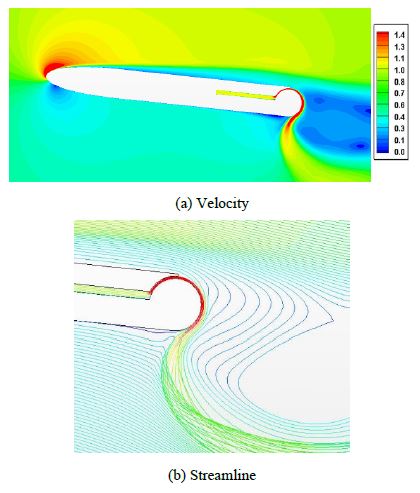
Figure 9 illustrates the result of the Coanda hydrofoil with a chord length of 0.15 m. The lift coefficient increased to 2.5 or more depending on AOA and Cj. However, unlike the result at a chord length of 0.1 m, the drag dramatically increased when Cj was greater than 0.1 at AOA=6°.
In order to analyze the cause of drag increase, Figure 10 depicts the flow characteristics at AOA=6° and Cj =0.2. The velocity distribution around the slit demonstrates that the injected jet flows from the slit to the end of the cylinder. The jets that changed direction beyond the perpendicular direction due to the Coanda effect no longer generate thrust and act like a curtain, which creates a huge low-velocity field behind the hydrofoil. This is considered to be the cause of the sudden increase in drag. The flow is also separated at the top side of the hydrofoil, and stall occurs similarly for the case of the conventional hydrofoil.
The results indicate that stall occurred near a lift coefficient of 1.2 for NACA66(mod.). However, the lift coefficient increased up to 2.5 or more for the Coanda hydrofoil depending on the chord length, AOA, and Cj. The Coanda hydrofoil revealed a different tendency in the lift and drag coefficients based on the chord length, even though the lift and drag coefficients are dimensionless values. This tendency is considered to be the effect of changing only the parallel length of the hydrofoil rather than changing the scale to reduce the chord length. It can be seen that the increase in lift coefficient by the Coanda effect on the slit is closely related to the chord length of the hydrofoil.
4. Cavitation Performance Simulation
4.1 Verification of numerical method
Before the cavitation simulation of the Coanda hydrofoil, the cavitation performance of the NACA66(mod.) was simulated to verify the numerical method. The simulation conditions were an AOA of 6°, a chord length of 0.15 m, an inflow velocity of 5 m/s, and a cavitation number of 1.49.
| (3) |
where Pv (2338.8 Pa) is the saturation pressure of water at 20 °C, ρ (999.19 kg/m3) is the density, and V is the inflow velocity.
The simulation results are displayed in Figure 11 and Table 1. The cavitation model used in this study is the Schnerr-Sauer model, and the cavitation shape and shedding frequency were compared with those of a previous study (Ducoin et al., 2012). The results demonstrated that the present numerical method is reliable, and the cavitation performance of the Coanda hydrofoil could be simulated using the same method.
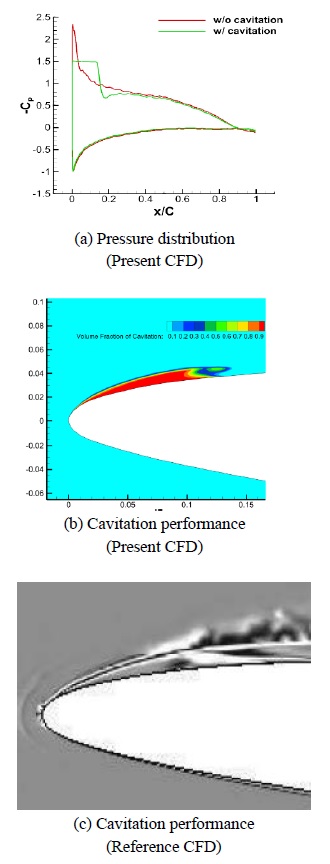
Pressure distribution of NACA66(mod.) and comparison of cavitation performance between present and reference CFD
4.2 Cavitation performance simulation of Coanda hydrofoil
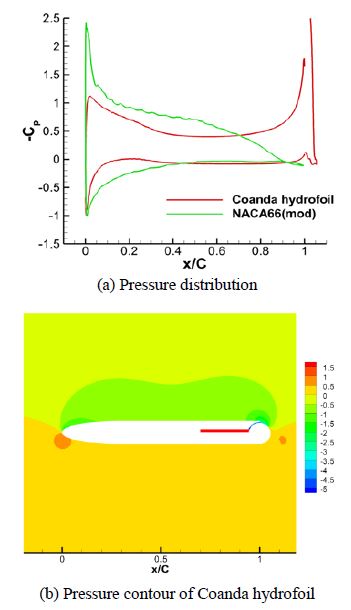
A Coanda hydrofoil with the same lift coefficient as the NACA66(mod.) was selected to compare the cavitation performance. The NACA66(mod.) has a lift coefficient of 0.79 at AOA=6°, and the lift coefficient of the Coanda hydrofoil is 0.79 at a chord length of 0.15 m, AOA=0°, and Cj=0.073. The pressure distributions at the same lift coefficient are exhibited in Figure 12.
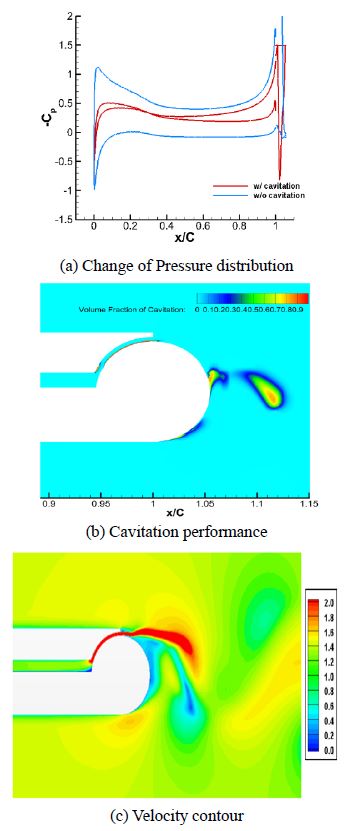
The pressure drop of the NACA66(mod.) was concentrated on the leading edge. However, in the case of the Coanda hydrofoil, the pressure drop was concentrated on the slit because the jet injection from the slit induced the downwash, which generated lift. The pressure distribution and cavitation performance after reducing the total pressure to σ=1.49 are presented in Figure 13.
Figure 13 (b) and (c) display the instantaneous shot from the cavitation simulation. As shown in Figure 13, cavitation occurs on the slit surface and disturbs the flow direction of the jet when the jet injection slit is located on the trailing edge. As a result, the jet can no longer induce downwash, and most of the lift is lost. The simulation was also performed at the same lift coefficient with AOA = 3° to move the pressure drop from the trailing edge to the leading edge. As a result, cavitation occurred at both the jet slit and the leading edge.
4.3 Structural modification of Coanda hydrofoil and simulation of lift and drag performance
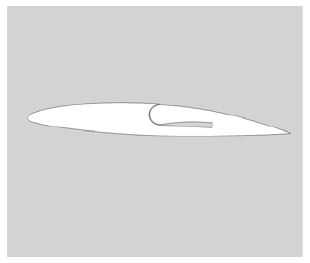
In the case of the Coanda hydrofoil, the cavitation that could disturb the flow direction of the jet occurs on the slit surface when the jet is injected on the trailing edge. When the AOA was increased to move the pressure drop to the leading edge at the same lift, cavitation occurred on the leading edge, as in the case of a conventional hydrofoil. Therefore, the Coanda hydrofoil faces two cavitation problems that need to be solved. First, the Coanda hydrofoil is based on the NACA0012, so the thickness distribution is concentrated on the leading edge. Therefore, it possesses disadvantages in terms of the change in pressure distribution according to the AOA. Second, the circular jet slit located in the trailing edge has a cavitation problem that could lead to a loss of lift. Therefore, it was modified to a different shape to solve the problem. NACA66(mod.) offset was used to change the thickness distribution, and the shape of the modified Coanda hydrofoil is shown in Figure 14.
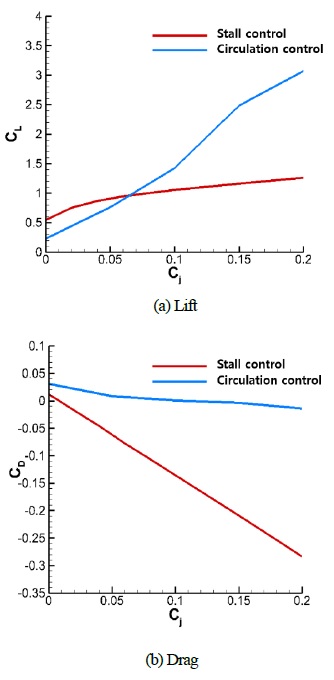
In order to distinguish between the earlier Coanda hydrofoil and new hydrofoil, the previous shape is referred to as the circulation control type, and the new shape is referred to as the stall control type. The lift and drag performance Cj at AOA=3 ° are shown in Figure 15. The stall control type has a higher lift than the circulation control type at a low Cj, and the increase of lift according to the increase of Cj is relatively slow. On the other hand, the drag coefficient is rapidly decreased by the increase of Cj compared with the circulation control type.
4.4 Cavitation performance simulation of stall control type
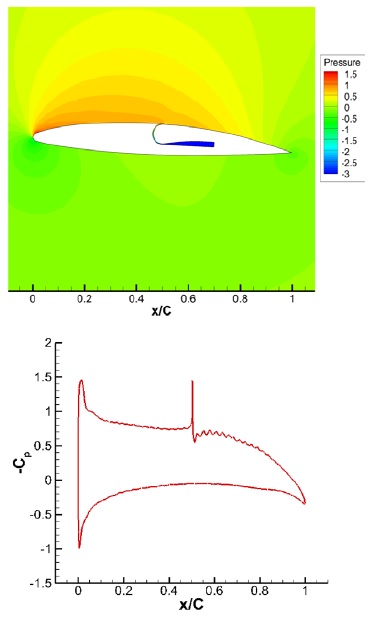
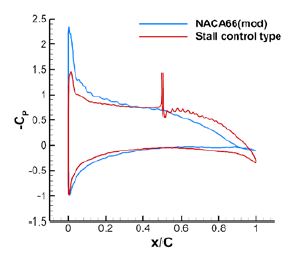
Table 2 presents the comparison of the lift and drag forces between the NACA66(mod.) and stall control type for the cavitation simulation. The pressure distribution of the stall control type is illustrated in Figure 16. In the stall control type, the pressure distribution is dispersed in the chord direction instead of being concentrated at the leading or trailing edge.
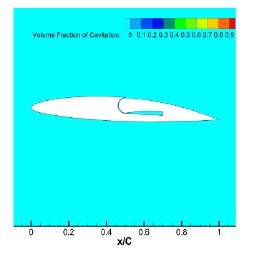
The pressure distribution between NACA66(mod.) and stall control types is compared in the plots in Figure 17. The total pressure was controlled to σ=1.49, and the resulting cavitation performance of the stall control type is shown in Figure 18. In the case of the stall control type, variation in the pressure distribution was not observed after controlling the cavitation number, and cavitation was not measured in the entire area. The jet slit of the stall control type is located on the top side of the hydrofoil, in contrast to the circulation control type. The stall control type has a lower AOA than NACA66(mod.) at the same lift, so the pressure distribution is dispersed over the entire area and is relatively uniform. Therefore, the cavitation number is decreased in the longitudinal direction, and cavitation is not observed in the entire area.
5. Conclusions
In this study, the shape of a conventional hydrofoil was modified by injecting a jet through a slit to induce additional lift by the Coanda effect. A conventional hydrofoil induces a downwash at the leading edge by the AOA, so the flow can be separated when the fluid viscosity reaches a certain limit. This causes stall and limits the lift.
In order to enhance the lift performance, it is necessary to increase the thickness distribution or camber of the hydrofoil. However, this could increase the drag. To overcome this limitation, the Coanda effect was applied to the hydrofoil. The drag tends to decrease owing to the thrust by the jet injection, and the thrust becomes more than the drag force when the jet injection is higher.
The circulation control design achieved significant high lift performance when cavitation did not occur. However, cavitation is likely to occur at the slit surface and could disturb the jet flow direction. As a result, the jet injection will be unable to induce a downwash, thereby causing most of the lift to be lost. The stall control type was designed to solve the cavitation problem of the circulation control type.
Most of stall control type used the NACA66(mod.). The stall control type has a higher lift than the circulation control type at low Cj, and the increase of lift according to Cj is relatively slow. On the other hand, the drag coefficient is rapidly decreased by the increase of Cj compared with the circulation control type. In addition, the pressure distribution was dispersed in the longitudinal direction, and the stall control type had a relatively uniform pressure distribution. This resulted in an improved cavitation performance.
Acknowledgments
This work was supported by the National Research Foundation of Korea (NRF) grant funded by the Ministry of Science and ICT, Republic of Korea (No. 2019R1F1A1060883).
Author Contributions
Conceptualization, M.-J. Eom and K.-J. Paik; Methodology, M.-J. Eom and K.-J. Paik; Software, M.-J. Eom and J.-H. Lee; Formal Analysis, M.-J. Eom and K.-J. Paik; Investigation, M.-J. Eom and J.-H. Lee; Resources, M.-J. Eom and K.-J. Paik; Data curation, M.-J. Eom and J.-H. Lee; Writing-Original Draft Preparation, M.-J. Eom; Writing-Review & Editing, K.-J. Paik and J.-H. Lee; Visualization, M.-J. Eom; Supervision, K.-J. Paik; Project Administration, K.-J. Paik; Funding Acquisition, K.-J. Paik.
References
- J. K. Oh et al. “Application of Coanda effects to a ship hydrofoil,” Journal of Ship and Ocean Technology, vol. 7, no. 2, pp. 29-39, 2003.
-
J-B. Leroux, J. A. Astolfi, and J. Y. Billard, “An experimental study of unsteady partial cavitation,” Journal of Fluids Engineering, vol. 126, no. 1, pp. 94-101, 2004.
[https://doi.org/10.1115/1.1627835]

- J. H. Seo and S. Lele, “Numerical investigation of cloud cavitation and cavitation noise on a hydrofoil section,” Proceedings of the 7th International Symposium on Cavitation CAV 2009, pp. 1-15, 2009.
-
A. Ducoin, B. Huang, and Y. L. Young, “Numerical modeling of unsteady cavitating flows around a stationary hydrofoil,” International Journal of Rotating Machinery, 2012.
[https://doi.org/10.1155/2012/215678]

-
S. -H. Yoon et al, “Experimental study of thrust vectoring of supersonic jet utilizing co-flowing Coanda effects,” Journal of the Korean Society for Aeronautical & Space Sciences, vol. 40, no. 11, pp. 927-933, 2012 (in Korean).
[https://doi.org/10.5139/JKSAS.2012.40.11.927]

-
Harijono Djojodihardjo, “Progress and development of Coandă jet and vortex cell for aerodynamic surface circulation control–An overview,” The SIJ transactions on Advances in Space Research & Earth Exploration (ASREE), vol. 1, no. 1, pp. 32-42, 2013.
[https://doi.org/10.9756/SIJASREE/V1I2/0102540402]

-
K. -C. Pfingsten and R. Radespiel, “Numerical simulation of a wing with a gapless high-lift system using circulation control,” New Results in Numerical and Experimental Fluid Mechanics VI, pp. 71-79, 2007.
[https://doi.org/10.1007/978-3-540-74460-3_9]

-
D. -W. Seo, S. -J. Lee, and J. K. Oh, “Performance analysis of stabilizer fin applied Coanda System,” Journal of Ocean Engineering and Technology, vol. 30, no. 1, pp. 18-24, 2016 (in Korean).
[https://doi.org/10.5574/KSOE.2016.30.1.18]

-
S. H. Park, H. B. Chang, and Y. Lee, “Experimental study of the effect of side plate on the Coanda effect of sonic jet,” Journal of the Korean Society of Propulsion Engineers, vol. 20, no. 2, pp. 24-30, 2016 (in Korean).
[https://doi.org/10.6108/KSPE.2016.20.2.024]


