Effect of diffuser angle and J-groove depth on improvement in suction performance of annular jet pump model
Copyright © The Korean Society of Marine Engineering
This is an Open Access article distributed under the terms of the Creative Commons Attribution Non-Commercial License (http://creativecommons.org/licenses/by-nc/3.0), which permits unrestricted non-commercial use, distribution, and reproduction in any medium, provided the original work is properly cited.
Abstract
Jet pumps are extensively used in the transportation of sensitive goods such as food (potato, onion, and capsicum), capsules, and live fish. The operating mechanism of the jet pump is the transfer of momentum and energy from the primary to secondary fluid without any rotating and reciprocating bodies. The jet pump is prone to cavitation in the mixing chamber of the nozzle outlet, where an extreme pressure drop occurs. This study presents numerical investigation results regarding the improvement in suction performance in an annular jet pump (AJP) model by varying the diffuser angle and J-groove depth. The J-groove is a rectangular groove engraved on the wall of the AJP model in the flow direction. The study results indicate that the installation of the J-groove with a suitable diffuser angle in the AJP model is effective in improving the suction performance and consequently suppressed cavitation in the pump. A tradeoff exists between the suction performance improvement and pump efficiency reduction by the J-groove installation; however, the degradation in the pump efficiency is insignificant compared with the suction performance improvement.
Keywords:
Annular jet pump (AJP), Diffuser angle (α), J-groove, Cavitation, Suction performance1. Introduction
Jet pumps are widely used in chemistry, petroleum, metallurgy, refrigeration, nuclear reactors, food transportation, and many other industries [1][2]. The use of the jet pump is increasing owing to its uncomplicated design, absence of moving components, low cost of production, favorable mass transfer, and mixing characteristics [3][4]. A jet pump comprises five main components: primary pipe, secondary pipe, mixing chamber (nozzle and throat), diffuser, and outlet. The operating principle of the jet pump is easy to understand. The jet pump typically comprises two inlets: one each for the primary and secondary fluids. The primary fluid is supplied with high pressure, which transfers energy and momentum to the stagnant or slow-moving secondary fluid in a suction chamber. The turbulent mixing of the primary and secondary fluids occurs in the mixing chamber or throat of the jet pump. After mixing, the mixture will diffuse to the outlet [5]. The major disadvantage of the jet pump is its low efficiency due to frictional and mixing losses. Jet pumps are highly susceptible to cavitation because of severe pressure drops.
Generally, two types of jet pumps exist: the central jet pump (CJP) and annular jet pump (AJP) [6]. Many studies have been conducted regarding the design [7][8], performance analysis [9][10], suction performance [11][12], and optimum design [13] of the CJP. Meanwhile, studies related to AJPs are few. Shimuzu et al. [14] conducted numerous experiments on the AJP and explained the correlation between the design parameters and performance of the AJP. Elger et al. [6] concluded that the recirculation flow in the AJP was dependent on the pump geometry, Reynolds number, and momentum ratio. Kwon et al. [15] analyzed different turbulence models for the numerical analysis of AJPs to satisfy their experimental data.
Cavitation is the main problem affecting the intended operation of the AJP. Cavitation bubbles occur in the pump when the operation occurs below the vapor pressure of the liquid. Cavitation deteriorates the pump performance and causes serious damage to transported goods. Cavitation in a jet pump differs from that in a normal centrifugal pump. Cavitation occurs in a jet pump owing to the instability of the re-entrant jet, and an adverse pressure gradient will reinforce the re-entrant jet and cloud cavitation in the jet pump [16]. The cloud cavitation is visible in the divergence section of the jet pump. Cavitation can occur in an AJP when the primary jet velocity is increased, or the suction pressure or pump outlet pressure is decreased [11]. Xiao and Long conducted a cavitation analysis of the AJP [17]. Numerical and experimental analyses indicated that cavitation occurred at the throat and diffuser of the AJP. This was due to the separation of the primary flow near the wall. The cavitation phenomenon differed based on the variation in the mass ratio of the AJP. At a low mass ratio, cavitation occurs in the suction chamber because of recirculation flow and can cause serious damages, e.g., during fish transportation [18]. A reduced adverse pressure gradient can suppress cloud cavitation in the AJP [16].
In an AJP, cavitation primarily occurs at the throat and diffuser [19]. The cavitation problem can be resolved by modifying the diffuser in the AJP model. Generally, the flow in the diffuser is determined by the inflow conditions (velocity distribution and Reynolds number) and diffuser geometries (diffuser angle and diffuser length) [20]. Meanwhile, the flow conditions and area ratio are dependent variables in the AJP. Hence, the diffuser angle has been considered to improve the adverse pressure gradient in the diffuser [21].
In this study, because the diffuser angle is one of the key parameters for improving the suction performance, the pump and suction performances were investigated based on the variation in the diffuser angles and J-groove installation using an AJP model via CFD analysis. Therefore, an improved suction performance can ensure the safe transportation of sensitive objects.
2. Pump Model and Methodology
2.1 Pump Model
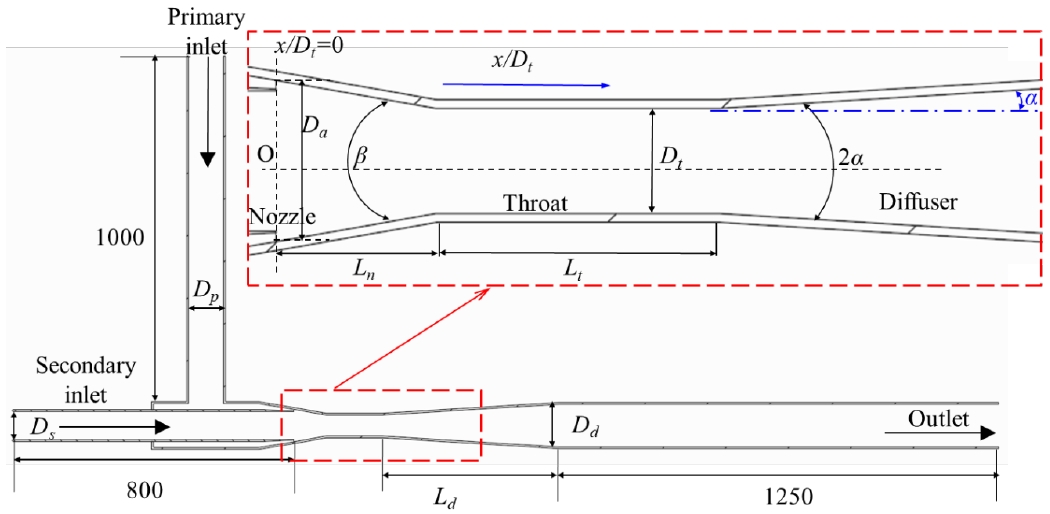
The AJP model was adopted from the study of Long et al. [18]. A schematic view of the AJP model is shown in Figure 1. The AJP model is composed of a primary inlet, a secondary inlet, a nozzle, a throat, a diffuser, and an outlet. The nozzle, throat, and diffuser are the main components of the AJP. The nozzle is used to increase the dynamic pressure, whereas the primary and secondary flows are mixed in the throat. Finally, the diffuser releases the fluid and objects at atmospheric pressure. The key point in the design of the AJP is the length-to-diameter ratio of the throat for an effective mixing. Generally, the length-to-diameter ratio of the throat is 2.17–2.89 [22]. The main design parameters of the annular jet pump are listed in Table 1. In the magnified view of the dotted rectangular box, as shown in Figure 1, the regions located at 0 ≤ x/Dt ≤ 1.2, 1.2 ≤ x/Dt ≤ 4.1, and x/Dt ≥ 4.1 represent the nozzle outlet, throat, and diffuser, respectively.
The AJP is categorized based on the area ratio m. The area ratio is defined as the throat-to-jet area ratio, as shown in Equation (1). In the AJP, the jet is shaped like an annular nozzle. The area of the jet is calculated using Equation (2).
| (1) |
| (2) |
| (3) |
where At is the throat area of the AJP, Aj the jet area of the AJP, Dt the diameter of the throat, Da the diameter of the annular nozzle, and Ds the diameter of the secondary pipe.
The area ratio is an important parameter for the classification of an AJP. The appropriate selection of the area ratio can suppress the recirculation regime and maintain the nozzle effect. Therefore, an area ratio of 1.75 was selected for the design of the AJP model, thereby classifying the AJP model in the same category. In this study, some diffuser angles were selected for a further investigation of the AJP model.
2.2 Design of J-Groove Shape
The J-groove is a groove engraved on the wall of the throat and diffuser of the AJP model. Generally, the J-groove is used to suppress swirl flows, cavitation, and secondary flows in turbomachinery, such as inducers [23], the Francis turbine [24], and pump turbines [25]. The various design parameters of the J-groove impose different effects on the suppression of swirl flows [26].
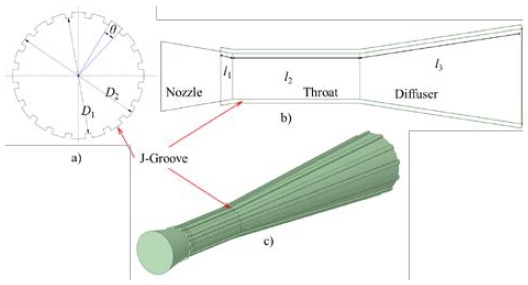
As indicated in previous studies, the current design of the AJP model is prone to a severe pressure drop at the pump throat. This pressure drop induces cavitation in the AJP model. The installation of the J-groove in the throat and diffuser of the AJP can induce a reverse flow from the high-pressure region at the diffuser outlet to the low-pressure region at the throat inlet through the groove passages [19]. The reverse flow will increase the pressure at the throat region and minimize the possibility of cavitation occurrence in the AJP model. Figure 2 shows a schematic view of the J-groove design. In the AJP model, the J-groove is located at the nozzle outlet, throat, and diffuser with lengths l1, l2, and l3, respectively. θ is the J-groove angle, which represents the J-groove width. The depth (d) of the J-groove is calculated using Equation (4). Therefore, the main design parameters for the J-groove are the length (l1, l2, l3), angle (θ), depth (d), and number (N).
| (4) |
where D2 and D1 are the outer and inner diameters of the J-groove, respectively.
The depth variation was considered in this study for improving the pressure drop in the AJP model because it was the most influential parameter affecting the pump efficiency and pressure drop at the nozzle outlet [19].
Table 2 shows the specifications of the J-groove. The length (l3) is controlled by the diffuser angle (α), and it decreases with an increase in the diffuser angle. In this study, except for the J-groove depth (d) and length (l3), the same J-groove shape parameters were used for different diffuser angles, which means that J-grooves with different depths were installed for various pump diffuser angles.
2.3 Numerical Methodology
CFD analysis was performed to evaluate the flow phenomena in the AJP model. In this study, the commercial code ANSYS CFX 19.2 [27] was used. The CFD analysis was performed in the AJP model by assuming steady and incompressible flows. Moreover, the realizable κ–ε turbulence model, which uses the variable turbulent viscosity, was selected for the CFD analysis. The turbulence model has been known to provide an accurate prediction for the spreading of jets by calculating the transport equation for the dissipation rate from vorticity fluctuation [28]. Furthermore, the viscous sublayer near the wall in the κ–ε model can be modeled using numerical grids with y+ values less than 5. Otherwise, the scalable wall function can be selected for a higher y+ value [29].
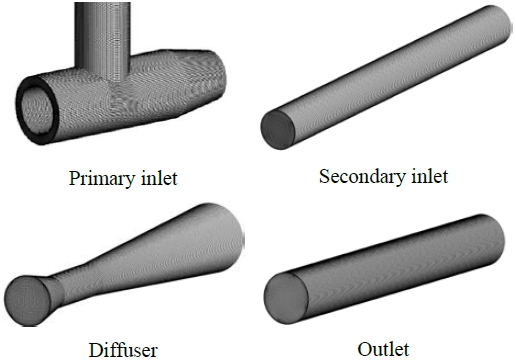
The numerical grid of the AJP model is shown in Figure 3. ANSYS ICEM 19.2 [27] was used to generate a hexahedral mesh for the CFD analysis. The y+ values near the wall of the primary inlet, secondary inlet, nozzle, diffuser, and outlet were 3.54, 0.33, 2.75, 0.73, and 0.14, respectively. The y+ value near the wall of the AJP model was less than 5. Therefore, the realizable κ–ε turbulence model can predict the viscous sublayer in the AJP.
The inlet boundary conditions were the total pressure and mass flow rate of the primary and secondary inlets, respectively. The outlet boundary condition was the static pressure. The cavitation phenomenon in the AJP was captured using a homogeneous mixture of water and water vapor at 25 °C. The Rayleigh–Plesset equation was used to evaluate the cavitation that occurred in this study.
| (5) |
| (6) |
| (7) |
To measure the pump performance, the mass ratio (q), pressure ratio (p), and efficiency (η) were used, as shown in Equations (5) to (7) [1].
Here, q is the mass ratio, p the pressure ratio, η the pump efficiency, Qs the secondary mass flow rate, Qn the mass flow rate at the nozzle exit, pmT the total pressure at the diffuser outlet, psT the total pressure at the secondary inlet, and pnT the total pressure at the nozzle exit.
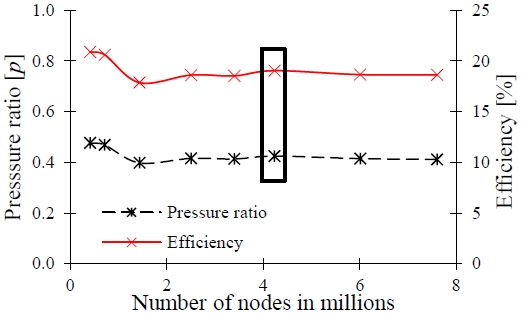
The primary inlet was set as follows: static pressure, ps = 372 kPa; mass flow rate, Qs = 27.8 kg/s. According to the mass conservation law, Qs = Qn, and the secondary flow rate was set accordingly to yield a mass ratio of 0.05–0.9. A mesh dependency test was performed to select the appropriate numerical grid for the CFD analysis. Figure 4 shows the results of the mesh dependency test. The mesh dependency test indicated that the 4.2 million nodes yielded stable CFD analysis results. A further increase in the number of meshes did not affect the pump performance.
3. Results and Discussion
3.1 Performance Curves of Pump Model
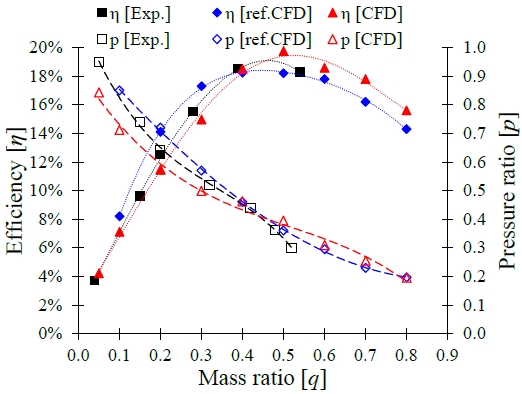
Figure 5 shows the performance curves of the AJP model, in which the comparison of performance curves between the experimental and CFD analysis results is revealed. For the validation test of the current CFD analysis method, the reference experimental and CFD analysis results by Long et al. [18] were adopted for the AJP model. The performance curves of the AJP model were prepared by varying the mass ratio from 0.1 to 0.8, and the BEP was located at a mass ratio of q = 0.5 in the current CFD analysis result. Figure 5 shows the consistency between the experimental and CFD analysis results.
3.2 Effect of Diffuser Angle
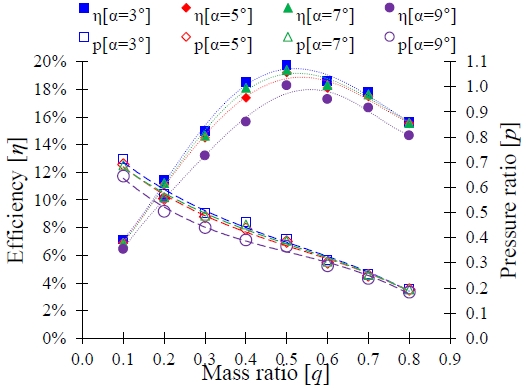
The performance curves for the different diffuser angles are shown in Figure 6. The efficiency of the AJP decreased with the increase in the diffuser angle. When the diffuser angle (α) was modified from 3° to 9°, the best efficiency decreased from 19.75% to 18.34%.
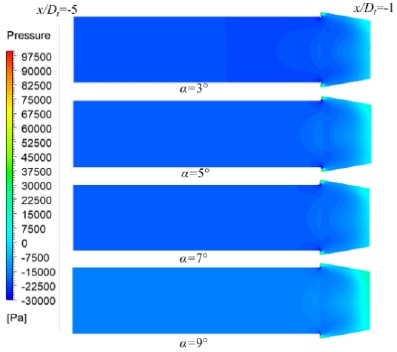
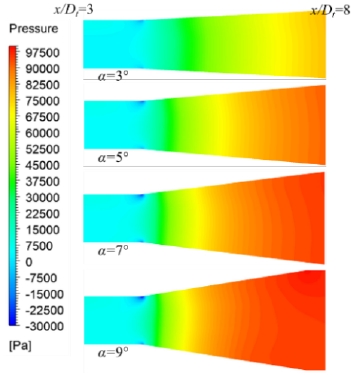
Figure 7 shows the static pressure contours in the secondary pipe and nozzle outlet at q = 0.5. The static pressure in the secondary pipe and nozzle outlet changed as the diffuser angle varied. When α = 9°, the static pressure distribution was higher than those of the other diffuser angles, thereby decreasing the pressure ratio and efficiency of the AJP model. Figure 8 shows the pressure distribution in the throat and diffuser of the AJP model. The diffuser length (l3) changed with the diffuser angle, as shown in Table 2; however, the pressure contours in Figure 8 are shown only in the region with the same distance from the throat. The change in the diffuser angle introduced a significant variation in the pressure gradient from the diffuser inlet to the exit. When the diffuser angle was higher, a rapid pressure change occurred at a shorter distance.
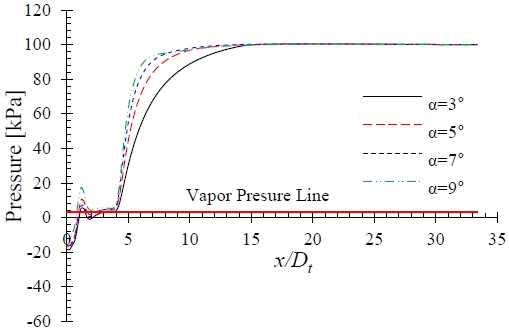
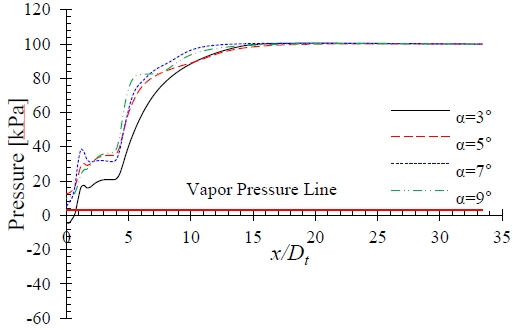
The main concern in the AJP is the improvement in the pressure gradient in the throat and diffuser. Therefore, the static pressure distribution in the AJP model with varying diffuser angle was evaluated. Figure 9 shows the pump passage static pressures at q = 0.5 without the J-groove installed, and the pressures at the nozzle outlet region (0 ≤ x/Dt ≤ 1.2) were below the vapor pressure line. The pressure drop in the nozzle outlet caused the cavitation cloud in the AJP model. Hence, the pressure in the area must be improved to ensure an appropriate operation of the AJP model.
3.3 Effect of J-Groove Depth
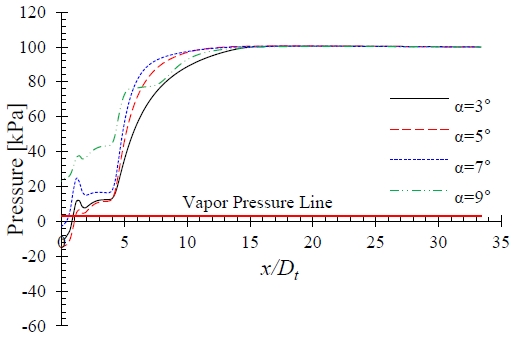
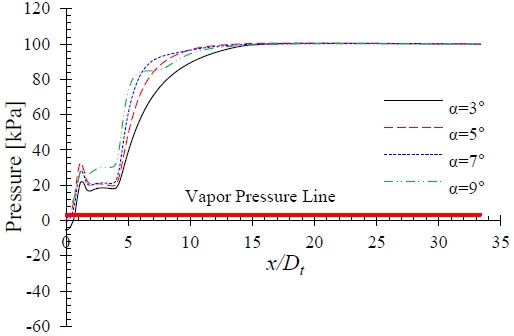
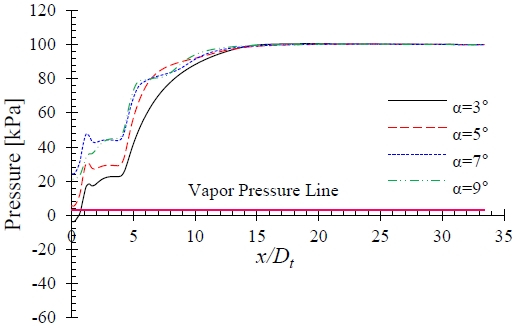
Figure 12 shows the effect of the J-groove depth on the pressure distribution in the AJP model. A relatively shallow J-groove depth of d = 1.0 mm imposed less effects on the improvement in the pressure distribution at the nozzle outlet and throat compared with deeper groove depths of d = 1.5 and 2.0 mm at the BEP (q = 0.5). However, when the depth of the J-groove increased further, the pressure was increased significantly in the nozzle outlet and throat became more significant.
Moreover, the higher diffuser angle indicated a greater increase in pressure at the nozzle outlet and throat regions. However, as shown in Figure 10, an increase in the diffuser angle resulted in a decrease in the pump efficiency. Consequently, as a tradeoff exists between the pressure improvement and pump efficiency deterioration by the J-groove installation, a suitable combination of the diffuser angle and J-groove depth is required.
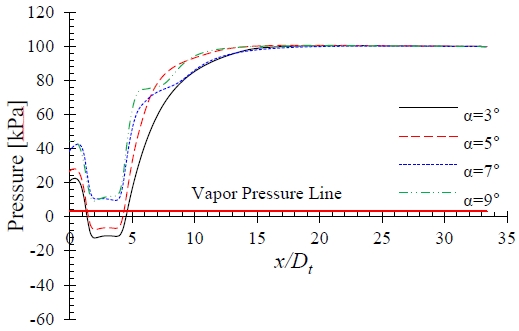
Figure 14 shows the pressure distributions for the case involving a J-groove depth of d = 1.8 mm with the variation in the mass ratio at q = 0.5 and 0.8, separately. The installation of the J-groove improved the pressure above the vapor pressure line in the AJP model when α = 7° and 9°. This indicates that the installation of the J-groove with an appropriate groove depth is effective for improving the pressure in the nozzle outlet and throat of the AJP model.
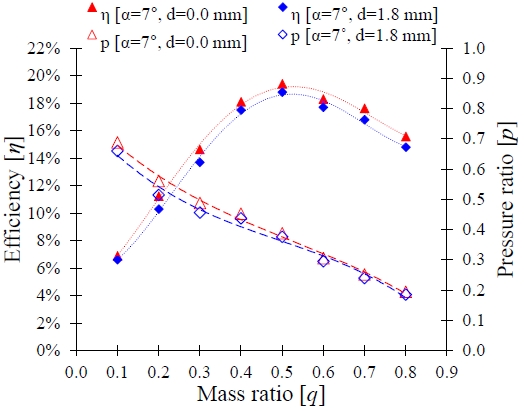
Figure 15 shows a comparison of the performances of the AJP without and with the J-groove installation. A diffuser angle of α = 7° and a J-groove depth of d = 1.8 mm were adopted as the best combination among the cases shown in Table 2, in consideration of the lower pump efficiency decrease and the larger pressure increase over the vapor pressure. The maximum efficiency decreased from 19.40% to 18.88% (a 0.52% decrease) with the installation at the BEP (q = 0.5).
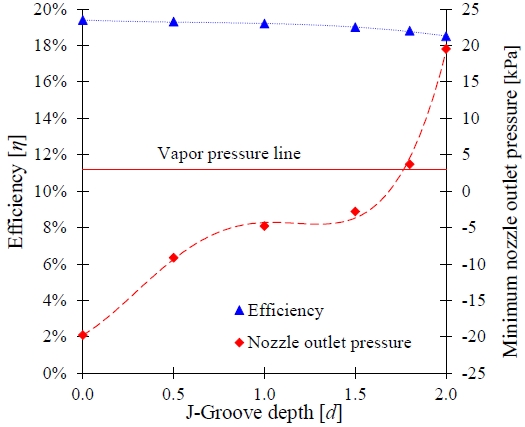
Figure 16 shows the correlation between the J-groove depth and each of the efficiency and minimum nozzle outlet pressure. The J-groove depth directly affected the pump efficiency. The minimum nozzle outlet pressure increased significantly with the J-groove depth, whereas the pump efficiency decreased insignificantly.
Therefore, based on the results of the J-groove installation, it is evident that the degradation in the pump efficiency was inevitable. However, an appropriate combination of the J-groove depth and diffuser angle can be used to increase the pressure at the nozzle exit and throat, as well as to achieve minimal degradation in the pump efficiency.
3.4 Improvement in Suction Performance with J-Groove
The cavitation phenomenon was evaluated using the AJP model, where Equation (8) was used to evaluate the cavitation performance.
| (8) |
Here, σn is the cavitation number, pn the static pressure at the nozzle exit, pv the vapor pressure of water at 25 °C, vn the velocity at the nozzle exit, and ρ the density of water at 25 °C.
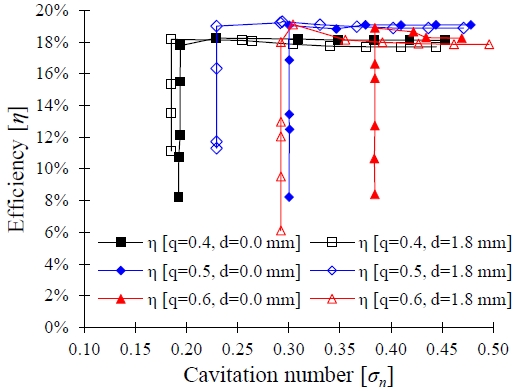
Figure 17 shows the suction performance curves for the AJP model with the variation in the mass ratio q. As shown, the installation of the J-groove improved the suction performance of the AJP model. Furthermore, it resulted in a shift in the cavitation inception point at every mass ratio. At mass ratio q = 0.5, cavitation inception occurred in the pump model at σn = 0.30 in the case without J-groove installation; however, the cavitation inception point shifted to cavitation number σn = 0.22 for the case with J-groove installation. Similarly, the cavitation number σn decreased from 0.39 to 0.28 and 0.19 to 0.18 with the J-groove installation at q = 0.6 and 0.4, respectively. This indicates that the installation of the J-groove effectively improved the suction performance of the AJP model.
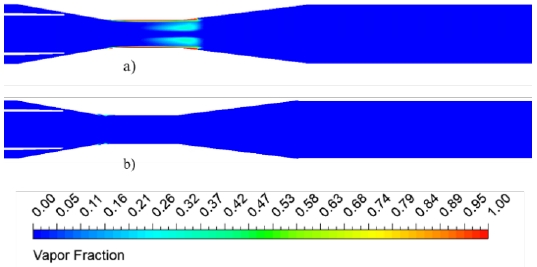
Figure 18 shows the vapor volume fraction distribution in the AJP model at mass ratio q = 0.5 and cavitation number σn = 0.30. The volume fraction numbers 0 and 1 indicate liquid water and vapor gas (cavitation inception), respectively. The vapor volume fraction decreased remarkably by the installation of the J-groove in the AJP model, as it suppressed the cavitation occurrence significantly. Therefore, it is conjectured that, by the J-groove installation, the operating range of the AJP can be extended widely with the cavitation-free operation condition.
4. Conclusion
This study was conducted to improve the suction performance in an AJP model by varying the diffuser angle and J-groove depth using numerical simulations.
The variation in the diffuser angle introduced a significant change in the pressure gradient from the diffuser inlet to the exit. When the diffuser angle increased, the amount of pressure increased in the nozzle outlet and throat, where the lowest pressure region in the pump was relatively larger; however, the pump efficiency decreased.
A relatively shallow J-groove depth has imposed an insignificant effect on the improvement in the pressure at the nozzle outlet and throat compared with a larger groove depth. However, when the depth of the J-groove increased, the pressure was increased significantly in the nozzle outlet and throat, but the pump efficiency was decreased consequently.
Consequently, a tradeoff occurred between the suction performance improvement and pump efficiency degradation by the J-groove installation. Nonetheless, the degradation in the pump efficiency was insignificant compared with the suction performance improvement.
The results of this study indicated that the installation of the J-groove with a suitable combination of diffuser angle and groove depth in the AJP effectively improved the suction performance, and suppressed cavitation occurrence in the pump.
Author Contributions
Conceptualization, U. Shrestha and Y. -D. Choi, Methodology, U. Shrestha; Software, U. Shrestha; Validation, U. Shrestha and Y. -D. Choi; Formal Analysis, U. Shrestha; Investigation, U. Shrestha; Resources, U. Shrestha; Data Curation, U. Shrestha; Writing—Original Draft Preparation, U. Shrestha; Writing—Review & Editing, Y. -D. Choi; Visualization, U. Shrestha; Supervision, Y. -D. Choi; Project Administration, Y. -D. Choi; Funding Acquisition, Y.- D. Choi.
References
-
D. F. Elger, E. T. McLam, and S. J. Taylor, “A new way to represent jet pump performance,” Journal of Fluids Engineering, vol. 113, no. 3, pp. 439-444, 1991.
[https://doi.org/10.1115/1.2909515]

-
X. Deng, J. Dong, Z. Wang, and J. Tu, “Numerical analysis of an annular water-air jet pump with self-induced oscillation mixing chamber,” The Journal of Computational Multiphase Flows, vol. 9, no. 1, pp. 47-53, 2017.
[https://doi.org/10.1177/1757482X16688476]

-
Y. I. Kryzhanivskyi and D. O. Panevnyk, “The study on the flows kinematics in the jet pump's mixing chamber,” Geotechnical and Mining Mechanical Engineering, Machine Building, no. 1, pp. 62-68, 2019.
[https://doi.org/10.29202/nvngu/2019-1/7]

-
Y. K. Kim, D. Y. Lee, H. D. Kim, J. H. Ahn, and K. C. Kim, “An experimental and numerical study on hydrodynamic characteristics of horizontal annular type water-air ejector,” Journal of Mechanical Science and Technology, vol. 26, no. 9, p. 2773-2781, 2012.
[https://doi.org/10.1007/s12206-012-0724-9]

-
S. Nilavalagan, M. Ravindran, and H. C. Radhakrishna, “Analysis of mixing characteristics of flow in a jet pump using a finite-difference method,” The Chemical Engineering Journal, vol. 39, no. 2, pp. 97-109, 1988.
[https://doi.org/10.1016/0300-9467(88)80100-X]

-
D. F. Elger, S. J. Taylor, and C. P. Liou, “Recirculation in an annular-type jet pump,” Journal of Fluids Engineering, vol. 116, no. 4, pp. 735-740, 1994.
[https://doi.org/10.1115/1.2911843]

-
D. T. Hatzlavramidis, “Modeling and design of jet pumps,” SPE Production Engineering, vol. 6, no. 4, pp. 413-419, 1991.
[https://doi.org/10.2118/19713-PA]

- T. W. Richardson and E. C. McNair Jr., “A guide to the planning and hydraulic design of jet pump remedial sand bypassing systems,” Army Engineer Waterways Experiment Station Vicksburg MS Hydraulics Lab, no. WES/IR/HL-81-1, 1981.
-
D. R. Croft, “Jet pump design and performance analysis,” AIAA 14th Aerospace Sciences Meeting, p. 183, 1976.
[https://doi.org/10.2514/6.1976-183]

-
M. F. Gubin and Y. N. Gornostaev, “Calculation of jet-pump operation in the technical water supply system of hydroelectric station turbine-generator units,” Hydrotechnical Construction, vol. 5, no. 1, pp. 49-55, 1971.
[https://doi.org/10.1007/BF02379336]

-
R. G. Cunningham, A. G. Hansen, and T. Y. Na, “Jet pump cavitation,” Journal of Fluids Engineering, vol. 92, no. 3, pp. 483-492, 1970.
[https://doi.org/10.1115/1.3425040]

- N. L. Sanger, A jet pump cavitation prediction parameter, NASA TM X-52417, National Aeronautics and Space Administration, USA, 1968.
-
R. G. Cairns and T. Y. Na, “Optimum design of water jet pumps,” Journal of Engineering for Gas Turbines and Power, vol. 91, no. 1, pp. 62-68, 1969.
[https://doi.org/10.1115/1.3574677]

-
Y. Shimizu, S. Nakamura, S. Kuzuhara, and S. Kurata, “Studies of the configuration and performance of annular type jet pumps,” Journal of Fluids Engineering, vol. 109, no. 3, pp. 205-212, 1987.
[https://doi.org/10.1115/1.3242649]

-
O. B. Kwon, M. K. Kim, H. C. Kwon, and D. S. Bae, “Two-dimensional numerical simulations on the performance of an annular jet pump,” Journal of Visualization, vol. 5, no. 1, pp. 21-28, 2002.
[https://doi.org/10.1007/BF03182599]

- J. P. Franc, “Partial cavity instabilities and re-entrant jet,” 4th Internetional Symposium on Cavitation, 2001.
-
L. Xiao and X. Long, “Cavitating flow in annular jet pumps,” International Journal of Multiphase Flow, vol. 71, pp. 116-132, 2015.
[https://doi.org/10.1016/j.ijmultiphaseflow.2015.01.001]

-
X. Long, M. Xu, Q. Lyu, and J. Zou, “Impact of the internal flow in a jet fish pump on the fish,” Ocean Engineering, vol. 126, pp. 313-320, 2016.
[https://doi.org/10.1016/j.oceaneng.2016.09.027]

-
Y. -D. Choi and U. Shrestha, “Cavitation performance improvement of an annular jet pump by J-Groove,” The KSFM Journal of Fluid Machinery, vol. 23, no. 4, pp. 25-35, 2020.
[https://doi.org/10.5293/kfma.2020.23.4.025]

- C. A. Moore and S. J. Kline, “Some effects of vanes and of turbulence in two-dimensional wide-angle subsonic diffusers,” Technical Note 4080, National Advisory Committee for Aeronautics, Washington, USA, 1958.
-
X. Meng, Z. Zuo, M. Nishi, and S. Liu, “A numerical study on the flow mechanism of performance improvement of a wide-angle diffuser by inserting a short splitter vane,” Processes, vol. 8, no. 2, p. 143, 2020.
[https://doi.org/10.3390/pr8020143]

-
X. P. Long, Q. L. Zeng, X. L. Yang, and L. Xiao, “Structure optimization of an annular jet pump using design of experiment method and CFD,” IOP Conference Series: Earth and Environmental Science, vol. 15, no. 5, p. 052020, 2012.
[https://doi.org/10.1088/1755-1315/15/5/052020]

-
Y. -D. Choi, J. Kurokawa, and H. Imamura, “Suppression of cavitation in inducers by J-Grooves,” Journal of Fluids Engineering, vol. 129, no. 1, pp. 15-22, 2007.
[https://doi.org/10.1115/1.2375126]

-
Z. Chen and Y. -D. Choi, “Suppression of cavitation in the draft tube of Francis turbine model by J-Groove,” Proceedings of the Institution of Mechanical Engineers, Part C: Journal of Mechanical Engineering Science, vol. 233, no. 9, pp. 3100-3110, 2019.
[https://doi.org/10.1177/0954406218802310]

-
U. Shrestha, P. M. Singh, and Y. -D. Choi, “Suppression of flow instability in draft tube of pump turbine using J-Groove,” The KSFM Journal of Fluid Machinery, vol. 22, no. 6, pp. 5-13, 2019.
[https://doi.org/10.5293/kfma.2019.22.6.005]

-
U. Shrestha and Y. -D. Choi, “Effect of J-Groove design parameter on suppression of swirl flow in draft tube of Francis hydro turbine,” Journal of the Korean Society of Marine Engineering, vol. 43, no. 8, pp. 631-639, 2019
[https://doi.org/10.5916/jkosme.2019.43.8.631]

- ANSYS Inc., ANSYS Help, https://ansyshelp.ansys.com/account/secured?returnurl=/Views/Secured/prod_page.html?pn=CFX&lang=en, , Accessed June 18, 2020.
-
T. -H. Shih, W. W. Liou, A. Shabbir, Z. Yang, and J. Zhu, “A new κ-ε eddy viscosity model for high Reynolds number turbulent flows,” Computers Fluids, vol. 24, no. 3, pp. 227-238, 1995.
[https://doi.org/10.1016/0045-7930(94)00032-T]

- ANSYS Inc., ANSYS Customer Portal, https://support.ansys.com/portal/site/AnsysCustomerPortal, , Accessed: June 18, 2020.

