Development of a free-surface profile prediction model for multi-pass shape roll die drawing process using response surface method
Copyright © The Korean Society of Marine Engineering
This is an Open Access article distributed under the terms of the Creative Commons Attribution Non-Commercial License (http://creativecommons.org/licenses/by-nc/3.0), which permits unrestricted non-commercial use, distribution, and reproduction in any medium, provided the original work is properly cited.
Abstract
In the multi-pass shape drawing process used for metal forming, the drawing force is typically applied unevenly to the material, thus causing errors in the dimensions of the material. In addition, the process is time consuming and costly. To overcome these problems, the roll die drawing process replaces the fixed drawing dies with non-driven roll dies that can undergo rotational movements to reduce friction forces at the die-material contact point. In this study, we propose a free-surface profile prediction model using the response surface method for the roll gap of a multi-pass drawing process using a roll die to fabricate square drawing material. We first derived geometrical parameters to apply to the response surface method. Then, using four process parameters that influence the deformation behavior of the material, a Box-Behnken design for response surface analysis was proposed, and a second-order regression model was derived through finite element analyses. In addition, finite element analysis was performed to validate the free-surface profile prediction model. Our verification results confirmed that the free-surface profiles predicted by the theoretical model agreed with those obtained via finite element analysis. Hence, our proposed free-surface profile prediction model based on response surface analysis can be used to design rectangular-shaped roll die drawing processes.
Keywords:
Roll die drawing, Free-surface profile prediction, Response surface method, Box-Behnken design, Finite element analysis1. Introduction
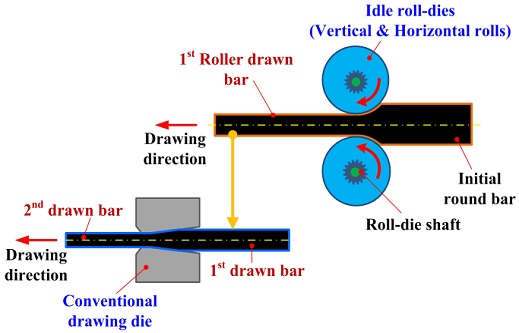
Drawing is a typical metal forming process for fabricating long products with the required cross-sectional shape by passing tubes and rods through dies with relatively small cross sections. The multi-pass shape drawing process involves drawing a round bar, the initial material, several times to produce a final product with an arbitrary cross-sectional shape. In the case of general multi-pass shape drawing, the drawing force is applied unevenly to the material, so there may be local concentrations of die wear and stress, which could lead to errors in product dimensions. In addition, to obtain a high reduction ratio, an intermediate heat treatment process is required, which is costly and time consuming. To address the above problems, a multi-pass shape drawing process using roll dies, as shown in Figure 1, has recently attracted attention. Roll die drawing replaces fixed drawing dies with non-driven roll dies that can undergo rotational movement to reduce friction forces at the die-material contact point. This results in a lower drawing load and higher reduction in area than the process using conventional drawing dies.
Thus far, several researchers have investigated the applicability of roll die drawing. Pilarczyk et al. [1] investigated changes in characteristics such as microstructure, residual stress, surface roughness, and mechanical properties by applying roll dies to high-carbon steel wire fabrication. Bayoumi [2] proposed a theoretical model for roll die drawing and rolling loads of circular and rectangular shapes and found that the drawing load could be reduced by approximately 40% with the roll die drawing process. Lambiase et al. [3] used finite element simulation to examine the effects of key process parameters such as initial wire diameter, roll die diameter, and height reduction rate on residual stress, contact pressure distribution, and drawing load in the flat roll die drawing process. Durante et al. [4] presented theoretical models for the maximum spread and drawing load of wires in the flat roll drawing process. For this purpose, the model of Shinokura and Takai [5], which is the maximum spread model of the rolling process, was applied to the roll die drawing process. In addition, a series of finite element analyses were performed to derive a linear regression model for the drawing load. Kim et al. [6] designed a multi-roll die drawing process using the back-pull effect for the production of automobile components and presented a drawing load prediction model applicable to the roll die drawing process. Kim et al. [7] designed a tandem drawing process using 4-roll dies and a multidie drawing process for circular-to-square shape fabrication and then evaluated the drawing loads in the two processes using the forming load prediction model. Amine et al. [8] performed drawing experiments with drawing dies in two sets of three rolls and conventional drawing dies for low-carbon steel and high-carbon steel wires, thereby comparatively analyzing the drawing loads, wire temperatures, and mechanical properties. Their experimental results showed that the surface quality was better for roll die drawing, but the drawing load and wire temperature slightly increased compared to those of the existing drawing dies. Cheon et al. [9] proposed a design method for intermediate roll die shape in the tandem drawing process, which consists of 4-roll dies and a conventional die, on the basis of the virtual die method and the die offset for the corner filling method to reduce the unfilled area at the corners of the rectangular bar. In that study, finite element analysis was used to investigate the deformation behavior of materials depending on the intermediate roll die shapes and to verify the effectiveness of the proposed design method.
Most previous studies have been limited to the process of creating axisymmetric shapes or flat rolls, leading to limitations in their application to the shape drawing process. In addition, no study has focused on the deformation behavior of materials during roll drawing, apart from the study of Durante et al. [4]. Existing studies, such as the Shinokura and Takai model, are based on rolling spread prediction models [5]. However, there is a significant difference among the four roll die shape drawings in the deformation behavior from the rolling process because of the axial tensile force acting on the material at the die outlet. Thus, unlike the rolling process, the width decreases similarly to the existing shape drawing process rather than being spread in the rolling process [9].
In this study, we propose a free-surface profile prediction model for the roll gap during the shape roll die drawing process via the response surface method for the production of square drawing material. First, the multi-pass shape roll drawing process was designed using the average reduction in area and electric field analysis, which are the existing design principles of the shape drawing process. From the design process, geometric parameters to be applied to the response surface analysis were derived. In addition, the main process parameters influencing the deformation behavior of the material during rolling and roll die drawing processes were identified. A total of four factors—local offset ratio, aspect ratio, reduction ratio, and friction coefficients—were determined as the independent variables. Using these process parameters, a Box-Behnken design for response surface analysis was proposed, and a second-order regression model was derived through a series of finite element analyses. Finally, the finite element analysis was performed to additionally evaluate the validity of the free-surface profile prediction model.
2. Design of multi-pass shape roll die drawing process
2.1 Design of pass schedule
In general, a shape drawing process consists of 2−3 passes of a multi-pass drawing process. Therefore, in this study, the pass schedule was designed based on the average reduction in area under the assumption of applying roll die drawing to the intermediate pass of the multi-pass shape drawing process. The number of passes in the multi-pass shape drawing process can be set by the average reduction in area equation expressed using Equation (1).
| (1) |
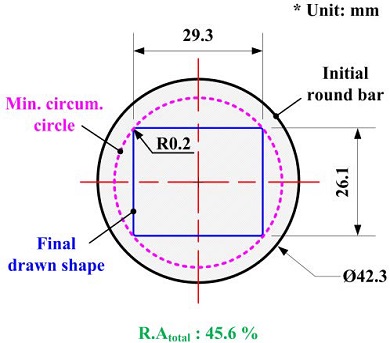
where ravg is the average reduction in area, rtotal is the total reduction in area, and n is the number of passes. In general, the multi-pass shape drawing process limits the reduction in area to less than 30% per pass. Figure 2 shows the cross-sectional shape and dimensions of the rectangular product used in this study. The initial shape diameter should be larger than the minimum circumscribed circle of the product's shape so that an under-cut is not generated during shape drawing. The minimum circumscribed circle diameter of the final product cross section is 38.3 mm, and by using Equation (1), the number of passes was set so that the average reduction in area is 30% or less. At the same time, the initial material diameter has an overall offset of 2 mm for each pass from the minimum circumscribed circle diameter of the product shape, considering the filling rate of each pass. Therefore, the total number of passes and initial material diameter were set to 2 and 42.3 mm, respectively, and the total reduction in area was 45.6%.
2.2 Design of intermediate roll die shape
Most shape drawing products are fabricated through 2 to 3 passes of the multi-pass drawing process, so the shape design needs to have the appropriate intermediate pass dies to reduce the formation of load and local stress concentrations and improve the dimensional precision of the final product. In this study, we first referred to the electric field analysis method proposed by Lee et al. [10] for the design of intermediate die shapes.
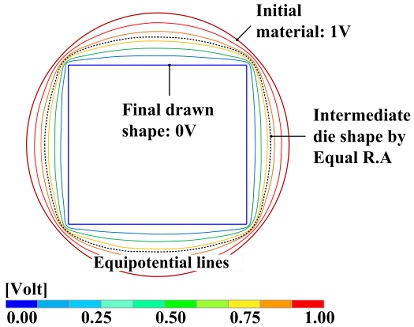
The design method of intermediate die shape using electric field analysis (EFA) is as follows. First, different voltages are applied to two objects with the centers coinciding. This creates a finite equivalent potential line that does not overlap between the two objects. According to a previous study [11], the equivalent potential line showed a tendency which is similar to the minimum work path between two conductors. Based on this tendency, the shape with the area corresponding to the reduction in area of the pass schedule is extracted from the many equivalent potential lines, and it is used as the intermediate die shape for each pass. In the present study, a pass schedule based on equal reduction in area was applied. Two-dimensional electric field analysis was performed using ANSYS 2019 r2 to design intermediate die shapes. Figure 3 shows the equipotential lines formed by applying 1 V and 0 V to the initial shape and the final shape, respectively, and the intermediate die shape by equal reduction in area pass schedule.
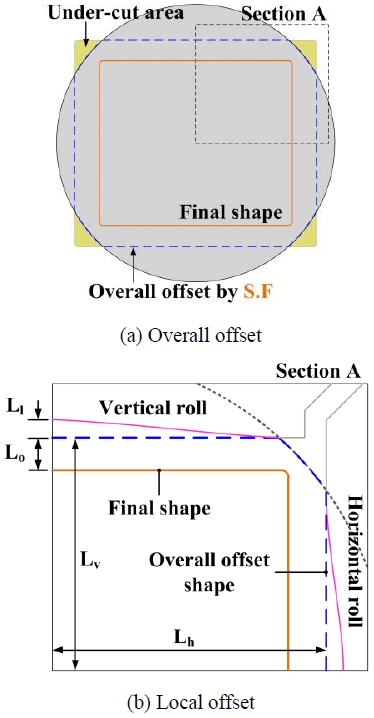
However, the intermediate shape design method using electric field analysis is generally applied to conventional shape drawing dies and cannot be directly applied to the roll groove design. In roll die drawing, there is a roll gap that results in a free-surface that does not come into contact with the die. Free-surface parts that do not undergo deformation by contact with the roll die will cause a strain inhomogeneity in the conventional drawing die pass, which will reduce the dimensional accuracy. Therefore, overall consideration of the free-surface part is required in the intermediate shape design. In addition, it is necessary to define the relevant parameters applicable to the process design method and the free-surface profile prediction model of this study for rectangular shapes with various aspect ratios. Therefore, the intermediate roll die shape for the multi-pass shape drawing process was determined by the following procedure as shown in Figure 4, referring to the electric field analysis results and the roll die groove design method proposed by Kim et al. [6].
First, considering the dimensional precision in the second pass of drawing, the final product shape is overall offset with the shape factor so that the deformation is uniform throughout the product shape. At this time, the under-cut area between the enlarged final product and the initial shape is excluded from the intermediate shape. The shape factor (S.F) is defined using Equation (2) below and is calculated by the square root of the area ratio between the intermediate shape area and the drawn product shape according to the pass schedule [12]. However, the intermediate shape determined in the first step produces high strain deviations in roll die drawing. Therefore, in the second step, the intermediate shape is partially offset locally based on the intermediate shape from the electric field analysis to reduce such strain deviations. Here, the ratio of the local offset amount to the overall offset amount is defined as the local offset ratio (LR) as shown in Equation (3), and the ratio of the horizontal and vertical length of overall offset shape is defined as a process variable called the aspect ratio (AR), as shown in Equation (4). These values are used as the design variables for the subsequent experimental design method. Based on the designed intermediate shape information, that is, the process parameters, the free-surface profile of the intermediate shape is predicted, and the design suitability is determined by considering the presence of overfilled or underfilled defects in the next pass.
| (2) |
where Ai is the area of the intermediate shape for pass i in the schedule, Af is the area of the final drawn product and r is the percent reduction in area.
| (3) |
where Ll is the length of the local offset and Lo is the length of the overall offset.
| (4) |
where Lh and Lv are the horizontal and vertical length of the overall offset shape. The process parameters explained above are shown in Figure 4.
3. Free-surface profile prediction model
3.1 Box-Behnken design
The response surface method is a statistical analysis method for response surfaces that represent the change in responses when complex actions of several variables have an impact on response variables. The main purpose of using the response surface method is to estimate the functional relationship between the design variables and response variables from a given experimental dataset by linear or quadratic regression and to select a combination of design variables (or experimental factors) to obtain an optimal response. Box-Behnken design is a representative experimental design method used for response surface analysis. It has a smaller number of experimental points compared to the 3k factorial design when the number of factors is k, and it is easier to make orthogonal blocks and to obtain a quadratic regression equation. A quadratic regression model with k design variables can be expressed in terms of linear, squared, and interaction terms, as shown in Equation (5).
| (5) |
Here, Y is the response value of Wv and Ws (see Figure 5), A is the local offset ratio, B is the aspect ratio, C is the reduction in area, D is the friction coefficient, and β is the regression coefficient.
In this study, we propose a quadratic regression model to predict the free surfaces in the roll gap in four shape roll dies drawing process based on the Box-Behnken design. For this purpose, as key process parameters affected the material deformation behaviors, along with the local offset ratio and aspect ratio which are the geometric parameters defined in the intermediate shape design process, friction coefficient and reduction in area were also selected by referring to previous studies [4][13][14]. The response variables were set as the reduced width of contact area after the roll drawing in the contact area between the initial material and the vertical and side rolls, respectively. Based on the measured response variable, the predicted shape of the free surface part was determined as follows. First, it is assumed that the intermediate point (PI) of the free surface part of the initial material moves in the direction of the center of the shape, and the distance of PI is proportional to the square root of the reduction rate. Here, the square root of the reduction rate is defined as the reduction factor (RF), and is calculated as in Equation (6).
| (6) |
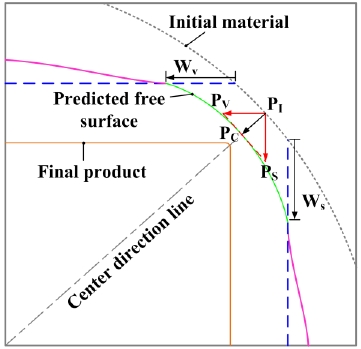
Thereafter, when the point of PI moves in the horizontal and vertical directions independently by the length of the measured response variable multiplied by the reduction factor, the corresponding positions are defined as PV and PS, respectively. The point of PI will be simultaneously affected by the reduction in the width and height directions. Thus, a triangle connecting the two points (PV, PS) and the free surface midpoint (PI) is created. In order to apply the initial assumption, the final position (PC) of the midpoint of the free surface shape after drawing can be determined as the point where the movement path of the intermediate point (PI) toward the center direction intersects with the hypotenuse of the triangle. Finally, the arc shape connecting the boundary point of the contact area between the vertical roll and the side roll and the point (PC) of the hypotenuse determined previously is illustrated. Figure 5 demonstrates the procedure explained above. The values of design variables at each level are given in Table 1.
3.2 Finite element analysis
Rigid-plastic finite element analysis was performed for each combination of design variables according to the Box-Behnken design using DEFORM-3D, a commercial forming analysis software. High purity stainless steel 316L was considered as the material in the analysis. The flow stress equation obtained from the uniaxial tensile test is shown in Equation (7).
| (7) |
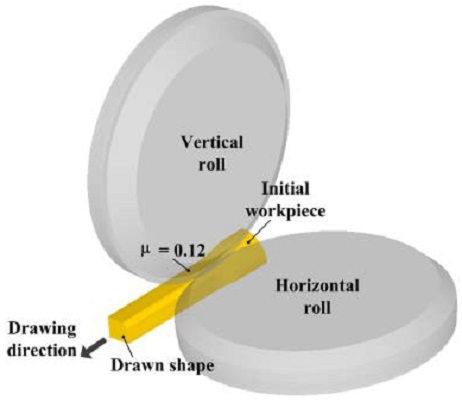
A quarter model of the overall shape was applied considering the analysis time and the symmetry of the product shape. The length and diameter of the initial material were 120 mm and 42.3 mm, respectively, and a total of 105,369 tetrahedral elements were used. Considering the equipment specifications used in the field, the drawing speed was 10 mm/s, and the friction coefficient between the workpiece and the die was set to 0.12 based on previous studies [6][7]. The above finite element analysis model is shown in Figure 6.
3.3 Regression model
Table 2 shows the results for a total of 27 finite element analyses. Based on the values of Wv and Ws measured from FE analysis, the coefficients of the regression model for Wv and Ws derived from the results are shown in Table 3 and Table 4, respectively.
In addition, the significance of the design variables for each response value was evaluated through analysis of variance (ANOVA). DF is the degree of freedom of design variables, SS is the sum of squares, MS is the mean square of SS divided by DF, F is the test statistics, and P is the significance probability.
Table 5 and Table 6 provide the results of the ANOVA calculations. It can be seen that the regression equation composed of the design variables selected in this study can have significant effects on the value of Wv because the P values of all regression terms relating to Wv were less than 0.05. In addition, in the case of Ws, the p-value of the square and the interaction term is slightly larger than 0.05, but since it is close to the significance level, it was included in the regression equation without pooling them into the error term.
To evaluate the accuracy of the regression equation, the coefficient of determination (R2), which represents the ratio of the variation explained by the regression equation to the total variation, was calculated using Equation (8).
| (8) |
Here, the total variance (SST) is divided into a regression sum of squares (SSR) and a residual sum of squares (SSE), which are respectively expressed as follows.
| (9) |
| (10) |
where y is the actual response, is the mean of the actual responses, and is the response estimated by the regression model.
The coefficient of determination has a value between 0 and 1, and the closer it is to 1, the better the approximation. The coefficients of determination for Wv and Ws were 96.4% and 95.9%, respectively, which shows that the regression model explains well the relationship between design variables and response values.
4. Verification of regression model
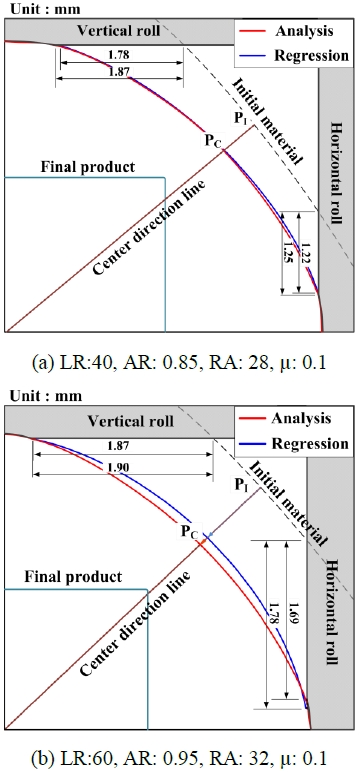
To verify the free-surface prediction model of roll die drawing, finite element analysis was performed in addition to the previous analysis cases using the Box-Behnken design. Additional analysis conditions were determined within the set range of independent variables, and the comparison between the responses predicted by the regression model and the finite element analysis results is presented in Figure 7 and Table 7. As shown in Figure 7, despite small differences due to the free surface being assumed to be arc shaped, the reduced width of contact area between the roll die and the initial material is very accurately predicted. In addition, Table 7 shows that the maximum error between the predicted amount of the quadratic regression model and the analysis result was 5.65%, and the error rate was mostly within the 5% range. This demonstrates that the free-surface profile prediction model based on the response surface method is valid.
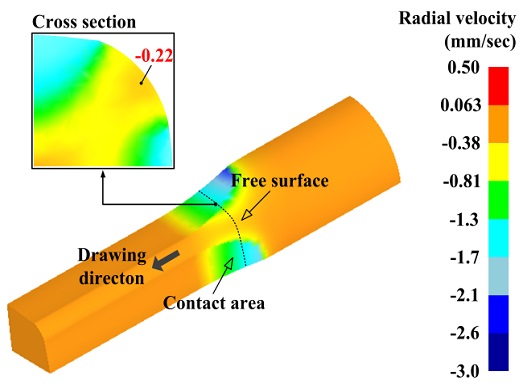
To confirm the width reduction phenomenon assumed in this study, the radial velocity distribution of the free-surface portion was investigated from the finite element analysis results. Figure 8 shows the radial velocity distribution of a workpiece during roll die drawing. The negative value means the metal flow is in the direction toward the center of the material. As in the previous assumptions, within the deformation zone, material flow in the center direction occurs across the cross section, and in particular, also in the free-surface. The causes for this phenomenon can be explained as follows. First, as mentioned previously, the deformation occurs in the direction in which the cross-sectional area of the material decreases due to the tensile force acting at the die outlet during the drawing process. The difference in radial velocity distribution of the material due to the non-uniform deformation across the cross-sectional area can also be considered [12]. That is, in the contact region between the material and the roll dies, a high radial velocity distribution is exhibited due to the high local reduction ratio. Since the material is a continuum, the free-surface portion, which was not initially deformed, is affected by the deformation in the surrounding contact region, so that the material flow in the free-surface portion has a radial velocity component. This can be deduced from the fact that the radial velocity distribution in the free-surface increases as the position on the free-surface moves toward the deformation region as shown in Figure 8. Therefore, it was confirmed that the assumptions made in this study were valid based on the results of these finite element analysis.
5. Conclusion
In this study, we proposed a free-surface profile prediction model for roll die drawing using the response surface method in a multi-pass drawing process using four shape roll dies for the production of highly clean stainless-steel square rods. The conclusions from the investigation are summarized as follows:
- (1) The pass schedule and intermediate shape of the roll die drawing process were designed. For this purpose, the number of passes was set based on the average reduction in area and final product shape information. In addition, two-dimensional electric field analysis was performed for the intermediate shape design of the multi-pass drawing, and the design variables to apply to the response surface method were derived from the roll groove design process.
- (2) In addition to the geometric parameters obtained from the roll groove design process, reduction in area and friction coefficients were selected as process parameters from previous studies on the rolling and roll die drawing processes, and the Box-Behnken design was performed based on the selected parameters. A total of 27 finite element analyses were performed, and from the results of the analyses, the width reductions in the vertical and horizontal rolls were measured to derive a second-order regression model between the process parameters and response values.
- (3) Additional finite element analysis was performed to verify the free-surface regression model derived from the response surface method. The verification analysis results showed that the free-surface profiles predicted by the theoretical model and those obtained by the finite element analysis agree well. It was also demonstrated that the assumption of the width reduction phenomenon was reasonable based on the analysis results. Therefore, the free-surface profile prediction model based on the response surface analysis presented in this study may have useful application for the design of various rectangular-shaped roll die drawing processes.
Acknowledgments
This work was supported by the National Research Foundation of Korea (NRF) grant funded by the Korea government (MSIP; Ministry of Science, ICT & Future Planning) (No. 2017R1C1B5017016).
Author Contributions
Conceptualization, S. C. Park, S. K. Hong, and K. H. Lee; Methodology, S. C. Park and K. H. Lee; Software, S. C. Park and I. J. Cheon; Investigation, S. C. Park, I. J. Cheon, and H. Park; Writing-Original Draft Preparation, S. C. Park and I. J. Cheon; Writing-Review & Editing, S. C. Park and K. H. Lee; Supervision, K. H. Lee; Funding Acquisition, K. H. Lee.
References
-
J. W. Pilarczyk, H. Dyja, B. Golis, and E. Tabuda, “Effect of roller die drawing on structure, texture, and other properties of high carbon steel wires,” Metals and Materials, vol. 4, no. 4, pp. 727-731, 1998.
[https://doi.org/10.1007/BF03026388]

-
L. S. Bayoumi, “Round-to-square section drawing through flat idle rolls,” International Journal of Mechanical Sciences, vol. 41, no. 11, pp. 1323-1338, 1999.
[https://doi.org/10.1016/S0020-7403(98)00100-3]

-
F. Lambiase and A. D. Ilio. “A parametric study on residual stresses and loads in drawing process with idle rolls,” Materials & Design, vol. 32, no. 10, pp. 4832-4838, 2011.
[https://doi.org/10.1016/j.matdes.2011.06.019]

-
M. Durante, A. Formisano, and A. Langella. “Evaluation of the maximum spread and the force for a drawing process through flat rolls,” Journal of Materials Processing Technology, vol. 212, no. 1, pp. 220-226, 2012.
[https://doi.org/10.1016/j.jmatprotec.2011.09.007]

-
T. Shinokura and K. Takai, “A new method for calculating spread in rod rolling,” Journal of Applied Metalworking, vol. 2, no. 2, pp. 94-99, 1982.
[https://doi.org/10.1007/BF02834206]

-
S. H. Kim, J. H. Kim, and B. M. Kim. “Process design for multi roll-die drawing of GDI fuel rail,” Transactions of Materials Processing, vol. 25, no. 6, pp. 390-395, 2016 (in Korean).
[https://doi.org/10.5228/KSTP.2016.25.6.390]

-
J. H. Kim, D. C. Ko, and B. M. Kim, “New tandem drawing process through non-driven four roll-die and converging die,” Journal of Materials Processing Technology, vol. 263, pp. 470-478, 2019.
[https://doi.org/10.1016/j.jmatprotec.2018.08.016]

-
K. E. Amine, J. Larsson, and L. Pejryd, “Experimental comparison of roller die and conventional wire drawing,” Journal of Materials Processing Technology, vol. 257, pp. 7-14, 2018.
[https://doi.org/10.1016/j.jmatprotec.2018.02.012]

-
I. J. Cheon, S. C. Park, H. Park, S. K. Hong, and K. H. Lee, “Intermediate die profile design for high-precision production of rectangular stainless-steel bars via new tandem drawing process,” Journal of Advanced Marine Engineering and Technology, vol. 44, no. 3, pp. 223-229, 2020.
[https://doi.org/10.5916/jamet.2020.44.3.223]

-
S. K. Lee, J. E. Lee, S. M. Kim, and B. M. Kim, “Design of intermediate die shape of multistage profile drawing for linear motion guide,” Journal of Mechanical Science and Technology, vol. 24, no. 12, pp. 2539-2544, 2010.
[https://doi.org/10.1007/s12206-010-0922-2]

-
S. R. Lee, Y. K. Lee, C. H. Park, and D. Y. Yang, “A new method of preform design in hot forging by using electric field theory,” International Journal of Mechanical Sciences, vol. 44, no. 4, pp. 773-792, 2002.
[https://doi.org/10.1016/S0020-7403(02)00003-6]

-
J. H. Park, K. H. Lee, S. M. Kim, H. J. Kim, S. J. Kim, and B. M. Kim, “Die design for shape drawing to improve the dimensional accuracy of a hollow LM-guide rail,” Transactions of Materials Processing, vol. 24, no. 5, pp. 340-347, 2015 (in Korean).
[https://doi.org/10.5228/KSTP.24.5.340]

-
M. Kazeminezhad and A. Karimi Taheri, “An experimental investigation on the deformation behavior during wire flat rolling process,” Journal of Materials Processing Technology, vol. 160, no. 3, pp. 313-320, 2005.
[https://doi.org/10.1016/j.jmatprotec.2004.06.020]

-
J. H. Min, H. C. Kwon, Y. Lee, J. S. Woo, and Y. T. Im, “Analytical model for prediction of deformed shape in three-roll rolling process,” Journal of Materials Processing Technology, vol. 140, no. 1-3, pp. 471-477, 2003.
[https://doi.org/10.1016/S0924-0136(03)00717-9]


