Polymorphs and morphological changes during dissolution in aging of CaCO3
Copyright ⓒ The Korean Society of Marine Engineering
This is an Open Access article distributed under the terms of the Creative Commons Attribution Non-Commercial License (http://creativecommons.org/licenses/by-nc/3.0), which permits unrestricted non-commercial use, distribution, and reproduction in any medium, provided the original work is properly cited.
Abstract
In this study, an experimental setup was designed to achieve accelerated aging of CaCO3 crystals in the laboratory to simulate the aging of calcite precipitates and biominerals caused by ocean acidification. CaCO3 was formed in the calcium aqueous solution through the inflow of CO2 from the atmosphere, and CaCO3 aging was conducted in the absence and presence of polyacrylic acid (PAA). When PAA increased, the maximum amount of deposited CaCO3 reduced, and the time to reach the maximum CaCO3 deposition was longer. However, there was a late onset of dissolution during aging. In the absence of PAA, typical rhombohedra eroded in the form of a plate or irregular sheet, but in the presence of PAA, some calcite nanofibers broke into nanoparticles. During aging, the calcite polymorph was not changed, but the relative intensity of the (104) plane to other peaks became weaker. This observation implied that the crack in the calcite crystals propagated mainly in the (104) plane during aging. This experimental setup demonstrated that CaCO3 aging caused by ocean acidification can be simulated in the laboratory.
Keywords:
CaCO3, Calcite, Precipitation, Aging, Morphology, Polymorphs, Biomineralization1. Introduction
CO2 concentrations have been increasing in the atmosphere over the past century and are one of the root causes of global warming. The sea is an important reservoir of CO2 absorption, and CO2 absorption causes ocean acidification [1]. The formation of inorganic calcium carbonate (ICC) [2] and the deposition of biological CaCO3 (BCC) are methods of CO2 capture and deposition in the ocean [3]-[5]. BCC is a component of the shell and outer skeleton of shellfish and corals. A decrease in the pH and acidification of the seawater lowers the concentration of carbonate ions, CO32-, and the supersaturation ratio of CaCO3. A decrease in the supersaturation ratio lowers the formation of ICC and BCC [1],[3]-[5].
Laboratory synthesis of ICC [6] and the biomimetic deposition of CaCO3 have been widely studied. Calcium carbonate has three polymorphs, i.e., calcite, aragonite, and vaterite. The polymorphs and morphologies of ICC are influenced by the solution pH, solution temperature, supersaturation ratio, and the added additives. In the formation of BCC, apart from the aforementioned factors, acidic biomolecules are known to be involved in the polymorphs and morphologies at the crystal growth stage [7]-[10].
Thus far, few studies have been conducted regarding the change in ICC and the dissolution in BCC during aging [11]. It has been reported that the calcification rate of corals and seashells is decreasing due to ocean acidification [1][2]. The decrease in the net calcification is reported to cause the reduction in the number seashells and corals [3]-[5].
In this study, we devised an experimental setup to achieve accelerated aging when dissolving calcite crystals due to solution acidification in the laboratory. CaCO3 synthesis was carried out in a Petri dish, and the formed CaCO3 was aged for several days in the solution, causing it to be acidic during aging. We observed the pH values of the solutions and polymorphs, and the morphological changes during aging in the absence and presence of polyacrylic acid (PAA).
2. Experimental Setting
The experimental setup was designed to simulate the dissolution of ICC and BCC due to ocean acidification in the laboratory. First, the calcification of CaCO3 was conducted in an aqueous 50 mL 10 mM CaCl2 solution with magnetic stirring at 400 rpm. The formed CaCO3 was aged in the solution. 100 mM tris (tris (hydroxy methyl) amino methane) was added to increase the pH of the solution for the synthesis of CaCO3. The morphology was controlled using polyacrylic acid (PAA; molecular weight of 2,000 g/mol). The samples were referred to as PAA50 (50 μg/mL = 2.5 × 10⁻⁵ M PAA added) and PAA100 (100 μg/mL = 5 × 10⁻⁵ M PAA added), depending on the amount of PAA added. After calcification, the solution was kept in aging condition. Aging was performed at room temperature while stirring at 400 rpm. The concentration change in the calcium ions in the solution was checked using the ethylenediaminetetraacetic acid (EDTA) titration method. The aging time was evaluated by stirring the solution with a magnetic stirrer. At each stage of calcification and aging, the precipitates were dried and characterized. The morphologies of CaCO3 were examined using scanning electron microscopy (SEM, Hitachi S-4800) and transmission electron microscopy (TEM, Tecnai20). The crystal structure of CaCO3 was investigated using X-ray diffraction (XRD) with 0.154 nm Cu Kα radiation (D/max 2500, Rigaku).
3. Results and Discussion
3. 1 Precipitation and Dissolution in the Aging of CaCO3
This study was conducted to evaluate the accelerated aging of ICC sediment and deposited BCC caused by ocean acidification. As shown in Figure 1 a, the pH of the solution suddenly decreased after one day and then decreased gradually, which was attributed to the absorbance of CO2 from the atmosphere. The dissolved CO2 was converted into bicarbonate (HCO3-) and carbonate (CO32-) ions. During calcification, calcium ions and carbonates reacted to form CaCO3, which was deposited on a plate. The addition of the acidic polymeric additive resulted in a slightly lower pH than that in the absence of PAA. Figure 1 b shows the amounts of EDTA titration in the presence and absence of PAA. The titrated EDTA amounts were converted to concentration of calcium ions in the solution, and Figure 1 c shows the concentration change of the measured calcium ions in the solution at different aging times. It is assumed that calcium, excluding the amount of titrated calcium ions, is used to produce calcium carbonate (See Figure 1 d). PAA is usually used as an acidic polymer as it is capable of playing the role of acidic biomolecules in biomimetic mineralization studies in the laboratory. In the absence of PAA, the amount of calcium ions in the solution reached the minimum value after aging for one day. In the presence of PAA, the concentration of calcium ions reached a minimum on the third day of aging, which was slightly higher than that in the absence of PAA. This implies that the formation of calcium carbonate was slowed by the addition of PAA. In addition, the deposition amount of calcium carbonate was less than that without PAA. This implies that the PAA addition reduced the deprotonation of bicarbonate, which is needed for the formation of carbonate ions. This phenomenon slowed the formation of CaCO3 and finally reduced the amount.
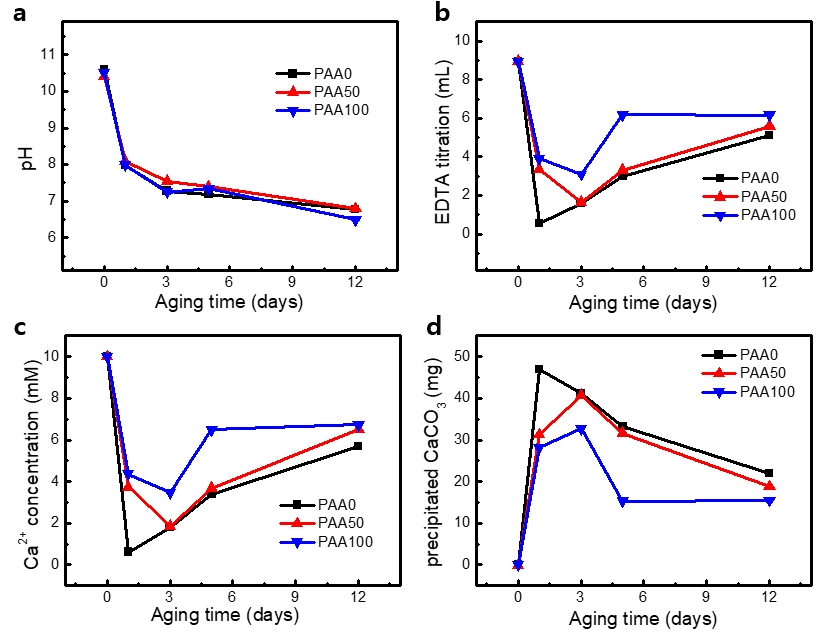
pH values and the precipitated CaCO3 in the solution at different aging times. a) pH, b) EDTA titration volume, c) Ca2+ concentration, d) the precipitated CaCO3
The dissolution of CaCO3 rapidly progressed up to five days but slowed down afterwards. For the solutions with PAA, the amount of CaCO3 was the maximum after only three days of aging. However, the maximum amounts of the synthesized CaCO3 were lesser than that of the solution without PAA. The dissolution of the synthesized CaCO3 was initiated after only three days and then the deposited CaCO3 amounts decreased. Compared to the condition without PAA, the dissolution of CaCO3 was slower in the presence of PAA. This implies that the added PAA functioned as a buffering component in the solution.
For the case of 100 μg/mL PAA addition, the amount of CaCO3 decreased rapidly up to 5 days but remained constant until 12 days. The minimum amount of CaCO3 was ~15 mg and the pH of the solution was in the range of 6.5 to 7 after aging for 12 days. This was due to the dissolved CO2. Without the addition of the basic component, the concentrations of the carbonate and bicarbonate ions remained relatively unchanged, and chemical equilibrium of the system was achieved. Therefore, there was no longer any noticeable difference in the precipitated amount of CaCO3.
3. 2 Morphological Change in the Aging of CaCO3 Formed in the Absence of PAA
Figure 2 shows the morphological changes of CaCO3 at different aging times in the solution without PAA. As shown in the figure, rhombohedron calcite was dominant at room temperature and atmospheric pressure [12]. The rhombohedron polymorph of calcite was unchanged during aging. However, the cubes began to erode after two days, as observed in Figure 2 b.
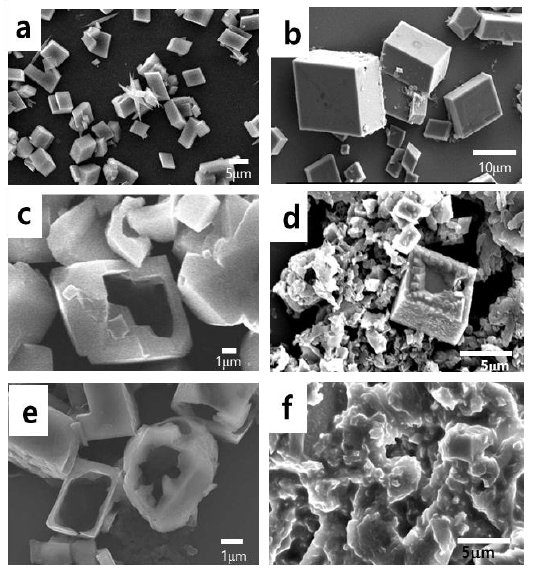
SEM images of CaCO3 in the absence of PAA at different aging times. a) 1 day, b) 2 days, c) 5 days, d) 7 days, e) 9 days, and f) 12 days
When aged for five days, some cubes were eroded inside the cube, and the hole inside enlarged progressively (Figure 2 c). Some appeared to degrade into smaller pieces. When aging had progressed for seven and nine days, erosion had occurred such that the facet was smoothened, and many fragments were found around the flattened crystals, as observed in Figure 2 d and 2 e. This implies that the cleavage of the crystals had majorly progressed in the specific direction [8][9]. On the 12th day, the facets of the crystals had disappeared significantly, and the shape of the sheet appeared as observed in Figure 2 f. It can be inferred that this sheet was formed by the overlapping of several eroded crystal plates.
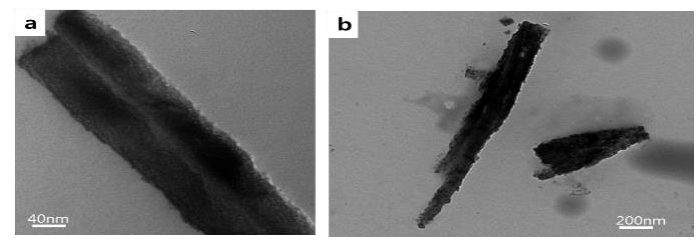
The TEM image in Figure 3 a shows that the crystals cracked when aged for five days, and there was some debris around the mother crystal. On the seventh day, the facets had eroded, and some sheet forms appeared (Figure 3 b). Thin, irregularly shaped lumps overlapped, the crystal face disappeared, and some holes were observed inside the lump when aged for 12 days, as shown in Figure 3 c.
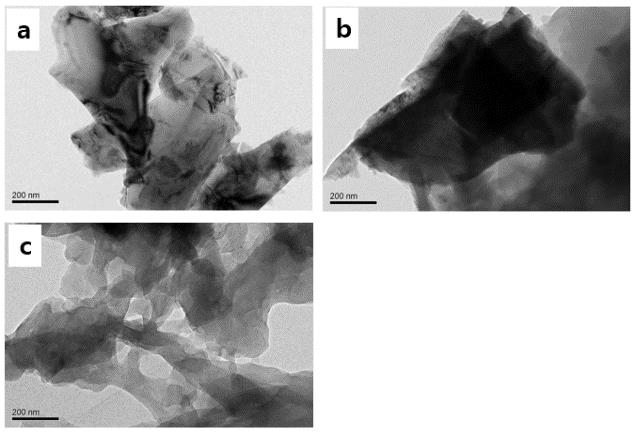
TEM images of CaCO3 in the absence of PAA at different aging times. a) 5 days, b) 7 days, and c) 12 days
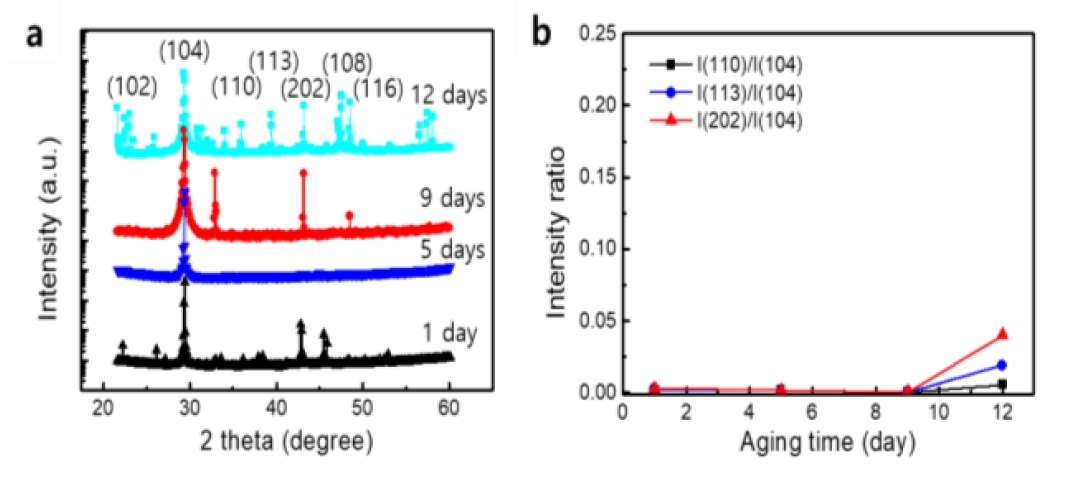
Figure 4 a shows the XRD patterns in the absence of PAA at different aging times. After one day, the calcite pattern was dominant. As the diffraction peaks appeared at the same position of two theta degrees, this implies that the polymorph was not altered by aging. The intensities at each peak are shown to be changed at different aging times. The (104) plane corresponded with the peak 2θ = 29.4 in the XRD diffractogram and was dominant in the calcite crystal. The relative peak intensity of the (104) plane to other planes became stronger gradually with aging time. In particular, the intensity ratios significantly increased after 12 days of aging, as observed in Figure 4 b. This implies that the (104) plane of the calcite was worn out and removed by aging. It can be explained that these calcite crystals tended to crack mainly on the (104) plane. This result is in accordance with the SEM observations of the dissolved calcites. Lardge and Wang suggested that Ca2+ and CO32- ionic bonds form across the (104) plane, and this bond can be cleavaged through this crystal plane by external stress [13][14].
3. 3 Morphological Change in Aging of CaCO3 Formed in the Presence of PAA
Only the calcite polymorph was found from the solution in the presence of PAA. As shown in Figure 5, cone structures were dominant. The cone structures developed in two days. They were configured with stacks of nanofibers. In previous studies, researchers have reported mesoscale assembly processes for the development of the cone structures of CaCO3 and BaSO4[15][16]. In such studies, nanospheres were formed and assembled into nanofibers, and finally, cone structures were formed [12],[17]-[19]. The nanostructures are believed to be formed first, and then they are assembled into a conical structure. An acidic polymer PAA reacts with the specific face of the growing CaCO3, and this action controls the direction of growth and the nanostructured fibers of CaCO3.
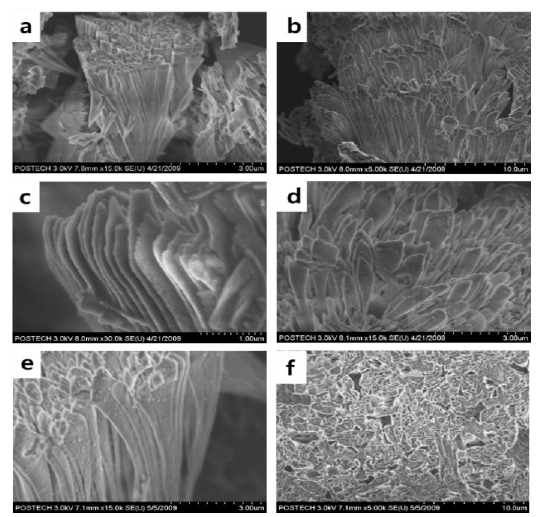
SEM images of CaCO3 in the presence of PAA at different aging times. a) 1 day, b) and c) 2 days, d) 5 days, e) 9 days, and f) 12 days
During the dissolution process of CaCO3 grown in the presence of PAA, the decomposition of the cone structure and the destruction of nanofibers were not observed macroscopically, despite aging for 9 and 12 days, as can be observed in the SEM images of Figures 5 e and 5 f.
For aging for one day, nanofibers with clean surfaces appeared, as shown in the TEM image (Figure 6 a). Figure 6 b displays a disrupted nanofiber and a couple of fragmented nanoparticles scattered around the fibers after aging for nine days. The nanofibers fragmented into nanoparticles, indicating that the specific cleavage did not develop well. Such crack development behavior differed from that in the absence of PAA. An acidic biomolecule involved in biomineralization is known to control the polymorphs and crystal growth of biominerals [7]-[10]. It has been reported that the involved acidic biomolecule influences the enhancement of the mechanical properties of biominerals [9]-[10],[20]. The added biomolecule causes the biomineralized structures to follow a distorted fracture path when a crack develops, which causes retardation of fracture propagation. In this study, the acidic polymer PAA seems to control not only the crystal growth, but also the dissolution rate and fracture behavior of the biominerals.
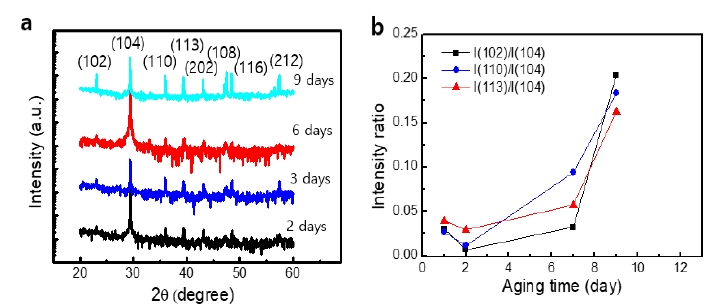
Figure 7 a shows the XRD patterns of CaCO3 grown in the presence of PAA. The typical XRD pattern of calcite was maintained irrespective of the aging time. The relative intensity of each peak to the (104) plane was significantly higher than that of calcite grown in the absence of PAA. As shown in Figure 7 b, the ratio increased with aging and exhibited a significant increase after nine days. This trend was similar to that in the absence of PAA.
4. Conclusions
The dissolution of CaCO3 crystals at different aging times were observed in the presence and absence of acidic polymer PAA. In the absence of PAA, the dissolution of CaCO3 was rapid and definite during aging. The cracks seemed to propagate in the (104) plane leaving large sheet-like debris. In the presence of PAA, cone-structured assembled nanofibers developed. With aging, the nanofibers broke into nanoparticles and showed a complicated crack path. It is considered that the addition of PAA in the CaCO3 dissolution experiment imparted the resistance to the crack.
This study shows that the aging study of calcium carbonate by ocean acidification can be reproduced in the laboratory. We designed this experimental setup to evaluate the dissolution of ICC and examine the role of acidic biomolecules in biomineralized structures when aging is conducted for a long-time duration.
Author Contributions
Conceptualization, H. C. Lee and S. Lee; Methodology, H. C. Lee and S. Lee; Software, S. Lee; Validation, H. C. Lee and S. Lee; Formal Analysis, H. C. Lee and S. Lee; Investigation, H. C. Lee and S. Lee; Resources, H. C. Lee and S. Lee; Data Curation, S. Lee; Writing—Original Draft Preparation, H. C. Lee and S. Lee; Writing—Review & Editing, H. C. Lee and S. Lee; Visualization, H. C. Lee and S. Lee; Supervision, S. Lee; Project Administration, S. Lee; Funding Acquisition, S. Lee.
References
- B. Metz, O. Davidson, H. Coninck, M. Loos, and L. Meyer, The IPCC Special Report on Carbon Dioxide Capture and Storage, IPCC 2005, UK, Cambridge University Press, 2005.
-
V. J. Fabry, B. A. Seibel, R. A. Feely, and J. C. Orr, “Impacts of ocean acidification on marine fauna and ecosystem processes,” ICES Journal of Marine Science, vol. 65, no. 3, pp. 414-432, 2008.
[https://doi.org/10.1093/icesjms/fsn048]

-
F. Gazeau, C. Quiblier, J. M. Jansen, J. -P. Gattuso, J. J. Middelburg, and C. H. R. Heip, “Impact of elevated CO2 on shellfish calcification,” Geophysical Research Letters, vol. 34, no. 7, L07603, 2007.
[https://doi.org/10.1029/2006GL028554]

-
S. Comeau, G. Gorsky, R. Jeffree, J. -L. Teyssie, and J. -P. Gattuso, “Impact of ocean acidification on a key arctic pelagic mollusc (Limacina helicina),” Biogeosciences, vol. 6, no. 9, pp. 1877-1882, 2009.
[https://doi.org/10.5194/bg-6-1877-2009]

-
M. A. Green, M. E. Jones, C. L. Boudreau, R. L. Moore, and B. A. Westman, “Dissolution mortality of juvenile bivalves in coastal marine deposits,” Limnology Oceanography, vol. 49, no. 3, pp. 727-734, 2004.
[https://doi.org/10.4319/lo.2004.49.3.0727]

-
C. Y. Tai and F. -B. Chen, “Polymorphism of CaCO3, precipitated in a constant‐composition environment,” AIChE Journal, vol. 44, no. 8, pp. 1790-1798, 2004.
[https://doi.org/10.1002/aic.690440810]

-
T. Kato, A. Sugawara, and N. Hosoda, “Calcium carbonate-organic hybrid materials,” Advanced Materials, vol. 14, no. 12, pp. 869-877, 2002.
[https://doi.org/10.1002/1521-4095(20020618)14:12<869::AID-ADMA869>3.0.CO;2-E]

-
H. Cölfen and S. Mann, “Higher-order organization by mesoscale self-assembly and transformation of hybrid nanostructures,” Angewante Chemie International Edition, vol. 42, no. 21, pp. 2350-2365, 2003.
[https://doi.org/10.1002/anie.200200562]

-
A. Aizenberg, J. Hanson, T. F. Koetzle, S. Weiner, and L. Addadi, “Control of macromolecule distribution within synthetic and biogenic single calcite crystals,” Journal of the American Chemical Society, vol. 119, no. 5, pp. 881-886, 1997.
[https://doi.org/10.1021/ja9628821]

-
H. -B. Yao, J. Ge, L. -B. Mao, Y. -X. Yan, and S. -H. Yu, “25th anniversary article: Artificial carbonate nanocrystals and layered structural nanocomposite inspired by nacre: synthesis, fabrication and applications,” Advanced Materials, vol. 26, no. 1, pp. 163-188, 2014.
[https://doi.org/10.1002/adma.201303470]

-
H. Yoon, A. J. Valocchi, C. J. Werth, and T. Dewers, “Pore-scale simulation of mixing-induced calcium carbonate precipitation and dissolution in a microfluidic pore network,” Water Resources Research, vol. 48, no. 2, pp. W02504, 2012.
[https://doi.org/10.1029/2011WR011192]

-
S. C. Lee, S. G. Lee, M. S. Sim, D. H. Kwak, J. -H. Park, and K. W. Cho, “Control over the vertical growth of single calcitic crystals in biomineralized structures,” Crystal Growth & Design, vol. 11, no. 11, pp. 4920-4926, 2011.
[https://doi.org/10.1021/cg200773x]

- J. S. Lardge, Investigation of the Interaction of Water with the Calcite {1014} Surface Using Ab-initio Simulation, Ph. D. Dissertation, Department of Physics and Astronomy, University College London, 2009.
- Q. Wang, A Computational Study of Calcium Carbonate, Ph. D. Dissertation, Department of Chemistry, University College London, 2011.
-
L. Qi, H. Cölfen, M. Antonietti, M. Li, J. D. Hopwood, A. J. Ashley, and S. Mann, “Formation of BaSO4 fibres with morphological complexity in aqueous polymer solutions,” Chemistry A European Journal, vol. 7, no. 16, pp. 3526-3532, 2001.
[https://doi.org/10.1002/1521-3765(20010817)7:16<3526::AID-CHEM3526>3.0.CO;2-Z]

-
S. -H. Yu, H. Cölfen, and M. Antonietti, “Control of the morphogenesis of barium chromate by using double-hydrophilic block copolymers (DHBCs) as crystal growth modifiers,” Chemistry A European Journal, vol. 8, no. 13, pp. 2937-2945, 2002.
[https://doi.org/10.1002/1521-3765(20020703)8:13<2937::AID-CHEM2937>3.0.CO;2-I]

-
S. Lee, J. -H. Park, D. Kwak, and K. Cho, “Coral mineralization inspired CaCO3 deposition via CO2 sequestration form the atmosphere,” Crystal Growth & Design, vol. 10, no. 2, pp. 851-855, 2010.
[https://doi.org/10.1021/cg9012075]

-
A. Berman, L. Addadi, Å. Kvick, L. Leiserowitz, M. Nelson, and S. Weiner, “Intercalation of sea urchin proteins in calcite: Study of a crystalline composite material,” Science, vol. 250, no. 4981, pp. 664-667, 1990.
[https://doi.org/10.1126/science.250.4981.664]

-
R. K. Pai and S. Pillai, “Water-soluble terpolymer directs the hollow triangular cones of packed calcite needles,” Crystal Growth & Design, vol. 7, no.2, pp. 215-217, 2007.
[https://doi.org/10.1021/cg0604780]

-
B. L. Smith, T. E. Schäffer, M. Viani, J. B. Thompson, N. A. Frederick, J. Kindt, A. Belcher, G. D. Stucky, D. E. Morse, and P. K. Hansma, “Molecular mechanistic origin of the toughness of natural adhesives, fibres and composites,” Nature, vol. 399, pp. 761-763, 1999.
[https://doi.org/10.1038/21607]


