A study of battery operational optimization with data-driven clustering
Copyright ⓒ The Korean Society of Marine Engineering
This is an Open Access article distributed under the terms of the Creative Commons Attribution Non-Commercial License (http://creativecommons.org/licenses/by-nc/3.0), which permits unrestricted non-commercial use, distribution, and reproduction in any medium, provided the original work is properly cited.
Abstract
Environmental problems have led to continuing efforts to reduce fossil fuel consumption around the world. As a result, interest in battery-based hybrid systems is increasing in the shipbuilding and offshore industries. In particular, battery applications are more efficient for offshore vessels with frequent load variations and high peak power consumption. Propulsion systems are generally classified as direct or electric propulsion. For some vessels, both direct and electric propulsion are used. The electrical power system of a vessel consists of one or multiple grids depending on the status (open/closed) of the bus tie. Owing to the complexity of propulsion and electrical power systems, designing the operation method and specifications of the battery onboard the vessel remains a challenge. Therefore, this paper categorizes and analyzes the data according to the condition of the bus tie. Principal component analysis clustering is applied to define the ship operation mode. The entire profile of a hybrid vessel with the hybrid propulsion system from a data point of view is analyzed, and an optimized battery operation method is proposed.
Keywords:
Marine operation, Offshore, Battery, Data mining, Machine learning, Clustering1. Introduction
In the shipbuilding and offshore industries, concerns for environmental issues and efforts to develop ways to prevent of marine pollution from ships are increasing [1][2]. The International Maritime Organization (IMO) has gradually strengthened the criteria for gas emissions by new ships according to the Energy Efficiency Design Index. Furthermore, shipping industries begin to concern the air pollution on sea routes as well as pollutants on the existing ports and nearby seas. As a result, the Emission Control Area was established with the approval of the IMO and relevant countries for stricter emissions control [3].
One of the effective measures for these regulations is the conversion of the conventional propulsion system into a hybrid system by installing batteries onboard. Batteries can compensate for load fluctuations of onboard electric power sources, such as diesel engines (D/G), to enable their operation under a more stable and optimal operation point. In addition, it is possible to stabilize the system by compensating the peak power frequently generated in offshore vessels. The operational strategy of these batteries can change according to the overall situation of vessels.
Conventional research on battery operation methods has been conducted using theoretical formulas or simulations [4]. In this study, data mining was carried out with data collected from a real offshore vessel to propose an optimal battery operation method that is one step ahead of the conventional method.
2. Vessel specification
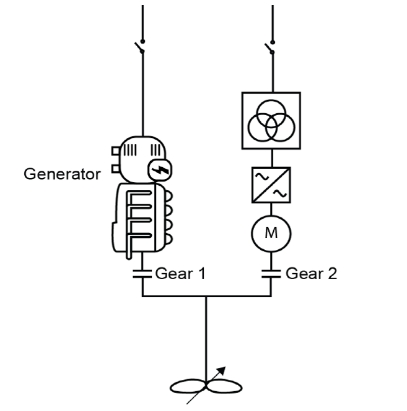
The offshore construction vessel, whose specifications are listed in Table 1, has a main diesel engine (M/E) and a propulsion motor (P/M) for the onboard propulsion system, as shown in Figure 1.
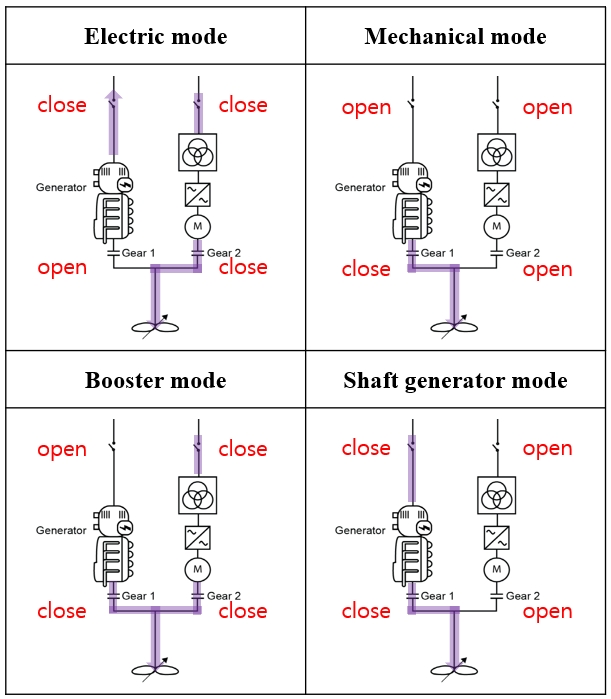
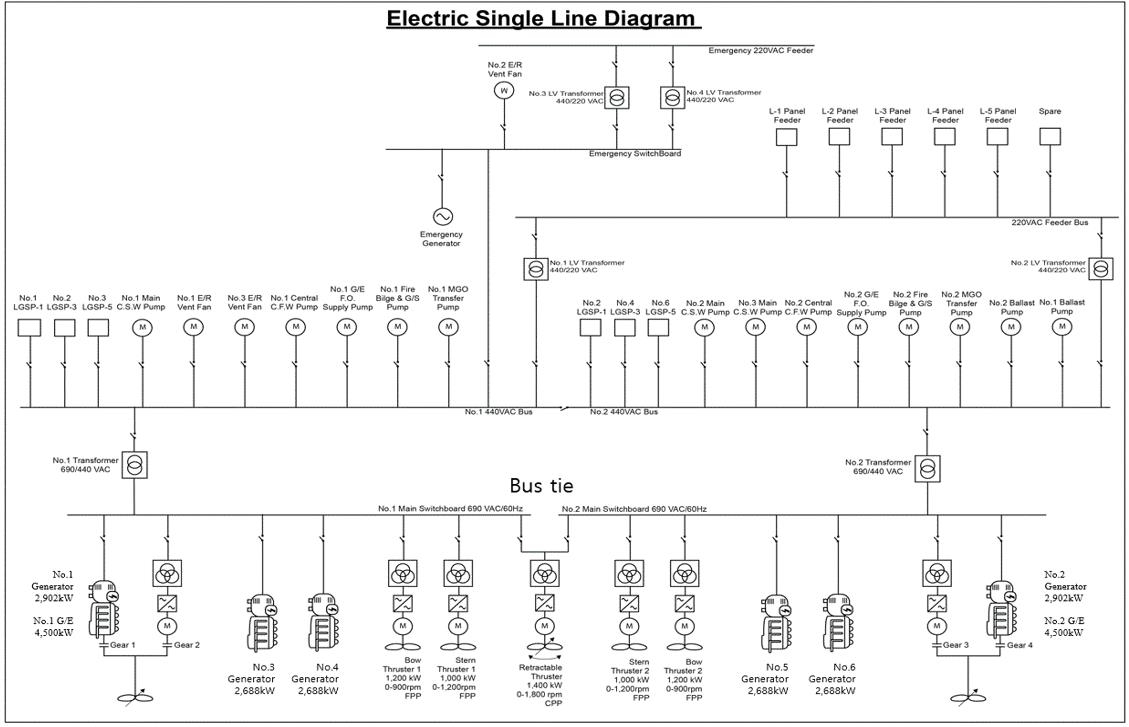
The propeller is connected directly to one side of the M/E, whereas the shaft generator (S/G) is connected to the other side. The propulsion system structure enables four different propulsion modes, as shown in Figure 2. In the electric mode, the propulsion output of the vessel is determined by the propulsion motor and M/E used for S/G, and Gear 1 is disengaged. In the mechanical mode, the propeller rotates in accordance with the operation of the M/E, and only Gear 1 is engaged. The booster mode is used when the vessel requires the largest propulsion torque and is operated by the M/E and P/M in a synchronized manner. In the shaft generator mode, the M/E is responsible for both the propeller and S/G load, where the S/G runs in parallel with other D/G as a source of electric power for the vessels’ consumers. The electrical single-line diagram (ESLD) is shown in Figure 3.
The configuration of the electrical power system depends on the status of the bus tie, which is in the middle of the ESLD. Both sides consist of the same propulsion system and D/G. A retractable thrust is installed on the same line as the bus tie. The retractable thrust is an azimuth propeller capable of all directional control and plays an important role in the dynamic positioning (DP) mode to keep the vessel at a fixed position and heading for operations.
3. Data analytics
3. 1 Data description
The data was collected from the Integrated Automatic System and measured at intervals of 5 s. The data consists of 1,045,535 rows × 15 columns, which were collected for two months. The variables are shown in Table 2. For output data, only electrical outputs are shown; mechanical outputs are excluded. The bus-tie status is categorized into open bus-tie (0) and closed bus-tie (1).
3. 2 Data explore
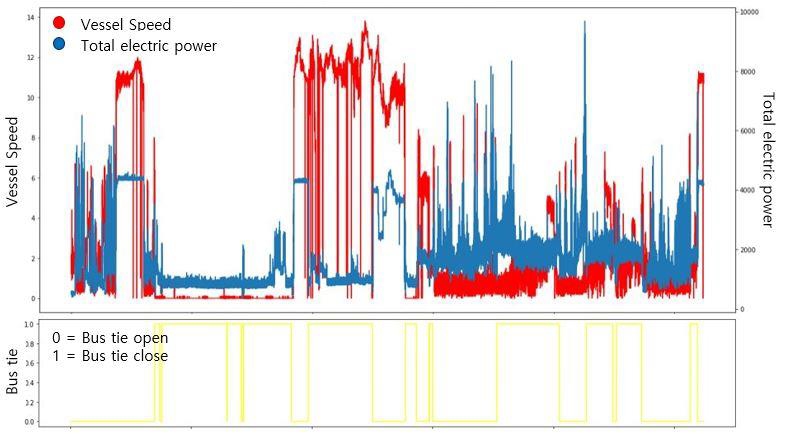
The data was recorded for about two months. Figure 4 shows a part of the total dataset, which was recorded for about two weeks. The red plot represents the speed of the vessel, the blue plot illustrates the total electric power of the vessel, and the yellow plot indicates the status of the bus ties (0: open/1: closed). The total electric power fluctuates more severely when the bus tie is open. In the process of data analysis, the data characteristics and trends were identified.
3. 3 Preprocessing
The operational characteristics of the vessel varied greatly depending on the status of the bus tie (open/closed). Dimension reduction is required because the data tends to be similar in each category in Table 1.
3. 4 Modeling
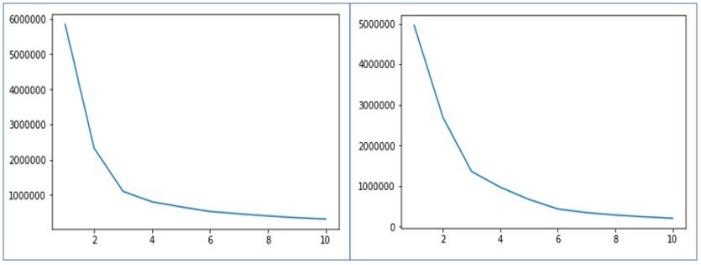
In this study, the K-means cluster algorithm was applied. The K-means algorithm identifies the k number of centroids, and then allocates each data point to the nearest cluster while keeping the centroids as small as possible. It is also efficient to consider the model calculation costs. The elbow method was used to determine the number of K in the modeling [5]. The variations in the distribution score by K are shown Figure 5. The number of K was selected based on the point where the distribution score falls below 1,000,000. The K was 4 when the bus tie was open, and 5 when closed.
3. 5 Analytics
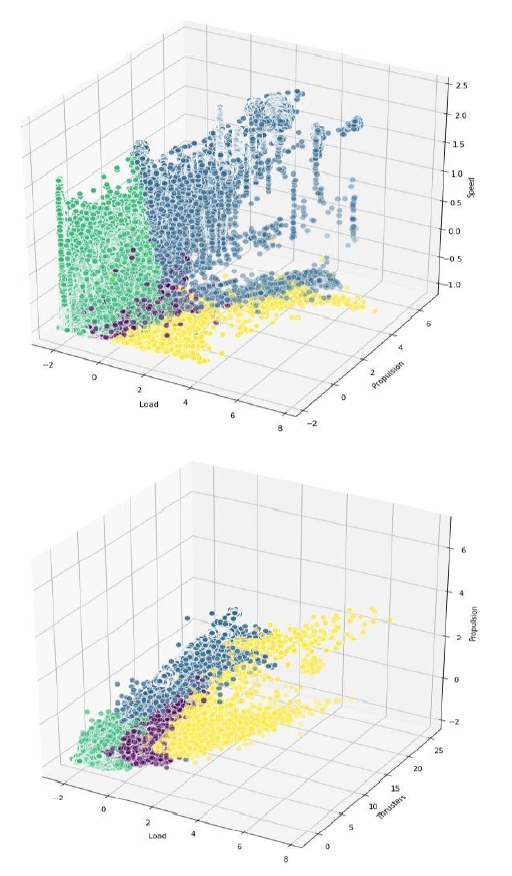
The results of principal component analysis (PCA) clustering in the open bus-tie condition are shown in Figure 6 and Table 3.
Cluster 0-0 shows low values of the load, propulsion, and speed. However, it shows slightly higher values in the thruster. Cluster 0-1 had the highest speed and electrical load of the vessel when the ship was in the electric mode and open bus-tie condition. The output of the thruster was close to zero. Cluster 0-2 had low values of the load, thrusters, and propulsion; however, the speed values distributed higher compared with the other variables. The largest portion of data belongs to Cluster 0-2.Cluster 0-3 is the section where the thruster output appears tobe highest in the DP mode, whereas the speed of the vessel was very low.
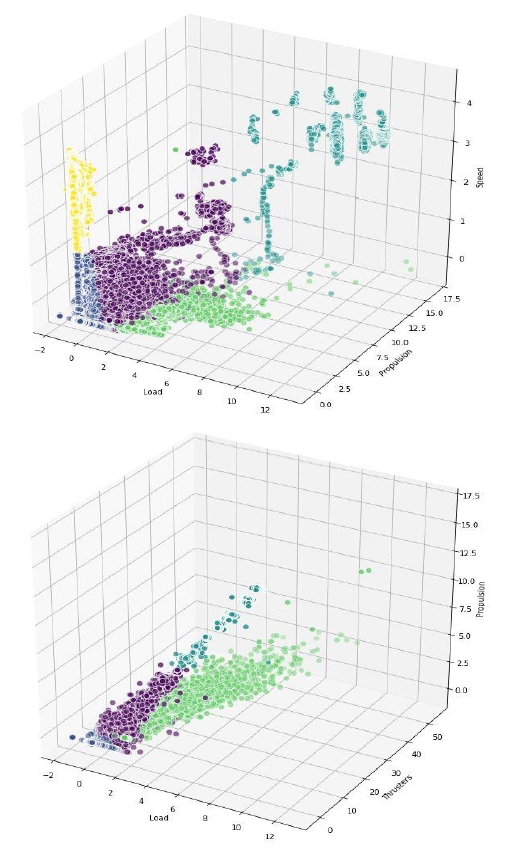
The result of PCA clustering at closed bus-tie is shown in Figure 7 and Table 4. The average electrical load values for Bus 1 and Bus 2 are shown, respectively, when the electrical grids were separated in the open bus-tie condition. On the other hand, only one electrical load value is shown at closed bus-tie, and the electrical grids were connected together. The values of Cluster 1-0 are mainly distributed in the middle area including the load, thrusters, and speed. Cluster 1-1 is in anchor mode and all the values, such as M/E, P/M, and thruster output, gathers to zero, and the vessel consumed the minimum amount of power (approximately 500 kW). Cluster 1-2 is in a state of propulsion in the electric mode.
M/E and P/M have linear distribution characteristics with high output states, and the average power of the vessel was the highest in this condition. The average speed of the vessel was approximately 11 knots. Cluster 1-3 is where the ship is near the port for in and out. The speed of vessel was low, and the thruster output was the highest. Cluster 1-4 is in the mechanical mode. The average speed of the vessel was approximately 11 knots, but the output of the M/E, P/M, and thrusters were all zero. In the mechanical mode, the electrical load of the vessel is similar to that of Cluster 1-1.
4. Battery mode
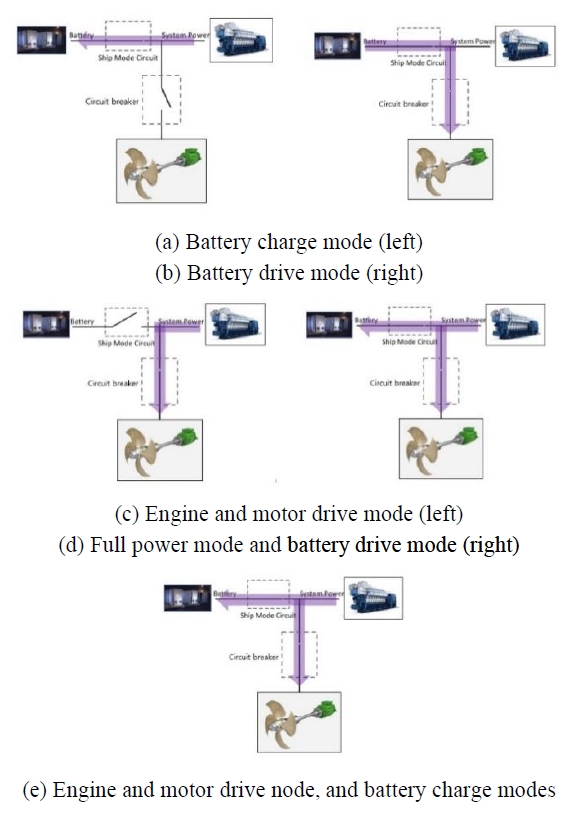
When batteries are installed onboard, power conversion systems can charge and discharge the battery depending on the operating environment; therefore, the battery can also be a source of propulsion power [6][7].
“Battery charge” mode is the mode in which the power generated by the M/E or D/G flows into the battery using an AC/DC converter. If the engine load level is low, then we can make the engine operate close to the rated power by charging the battery. This method can reduce fuel consumption and emissions. “Battery drive” mode is the mode in which the power discharged from the battery is supplied to the propulsion motor or vessel using a DC/AC converter. This mode is eco-friendly and does not use engines. “Engine and motor drive” mode is the mode in which the P/M is powered by the generators without charging or discharging the battery. “Full power and battery drive” mode is the mode in which the P/M is operated by combining power from the engines and battery.
5. Optimal battery application
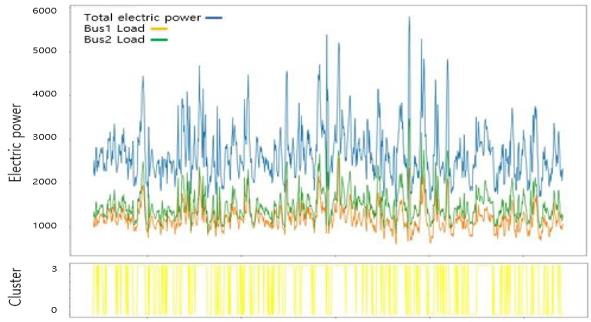
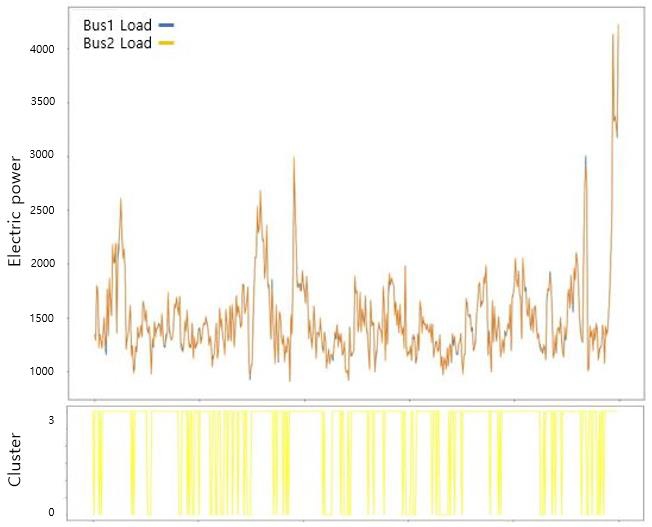
Two battery applications are proposed considering that the electrical grids are divided for the open bus-tie condition, such as the DP mode. Based on the features of each cluster and the battery modes discussed earlier, the optimal battery application is proposed. The variations in the electric power of the vessel in the open bus-tie condition can change by more than 4,000 kW quickly and frequently, as shown in Figure 9. At this point, the operational characteristics of the vessel repeatedly shift between Cluster 0-0 and Cluster 0-3.
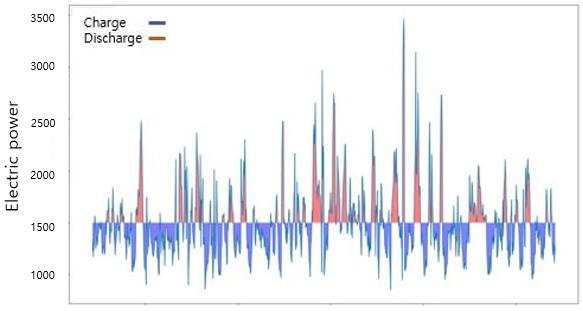
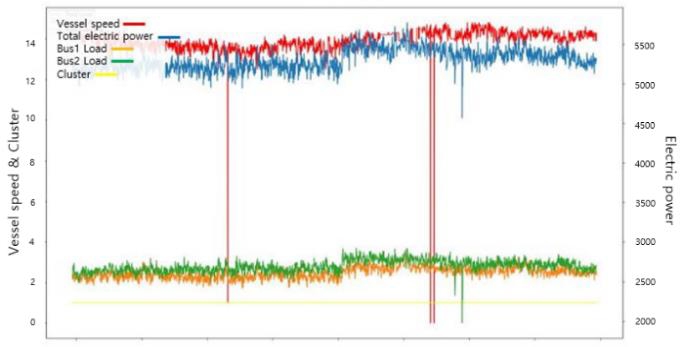
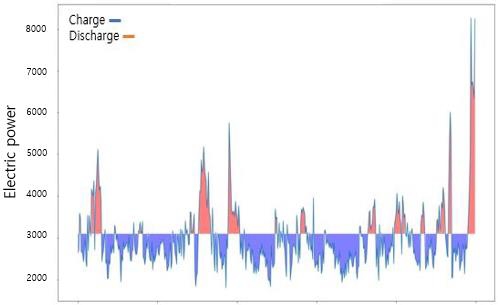
The electric power fluctuated a lot and peak power was frequently reached; therefore, the battery, as shown in Figure 10, can be used to improve the reliability of the D/G operation under the optimal load condition. It is recommended that the battery be discharged when the vessel's power consumption is higher than the specific set point, and charged when low power consumption is expected. Figure 11 shows the operating parts of Cluster 1-0, which were pushed in the electric mode in the open bus-tie condition. The speed and power consumption of vessel were both high, and the power fluctuation range was not large but stable. No batteries were used in this section, and power was produced by a combination of M/E and D/G. The section where the vessel speed suddenly decreased because of noise did not affect clustering.
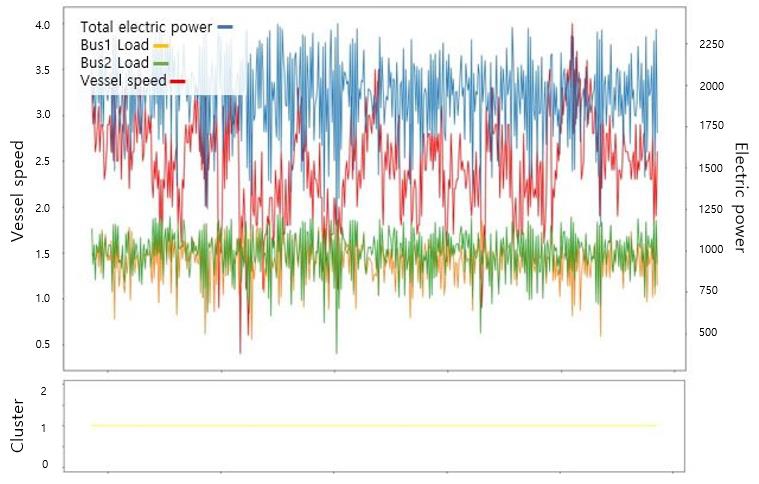
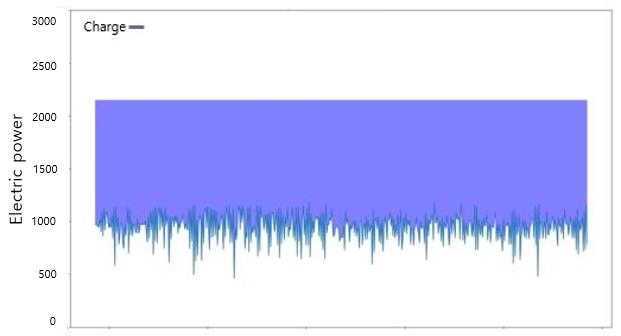
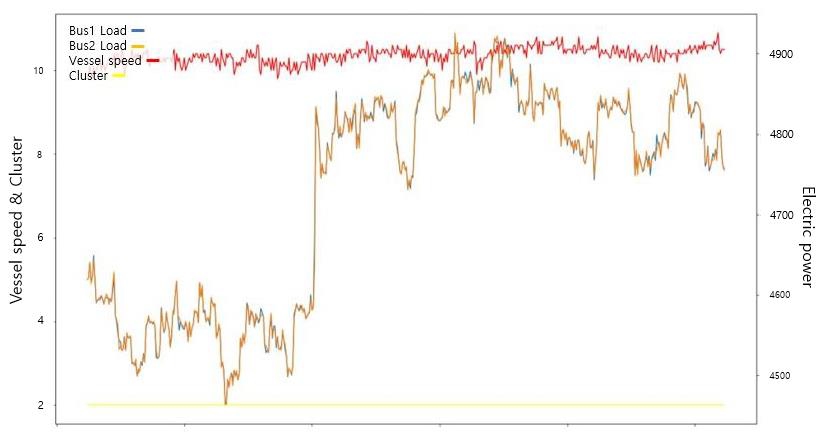
Cluster 0-2 is considered to be either in maneuver mode or stand-by mode. As seen in Figure 12, both the speed (1–5 knots) and power consumption of the vessel were low because the low power of the thrusters. In this case, battery charging allows the load of the D/G to operate in the optimization area. Thus, the charged batteries can be the only power source of the vessel when the required power is low. Figure 13 shows that remaining electrical energy being used to charge the battery except for the power consumed (approximately 1,000 kW).
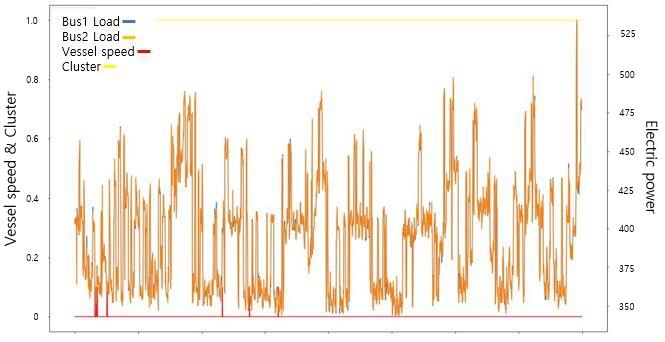
Unlike the open bus-tie condition, there is no distinction between Bus 1 and Bus 2 for the closed bus-tie operation. Figure 14 appears as a combination of Cluster 1-0 and Cluster 1-3. The power of the vessel varied according to the power of the thrusters. The fluctuating power can operate the D/G more reliably and compensate for the peak power by charging and discharging of the battery, as shown in Figure 15. Cluster 1-1 corresponds to the anchorage mode. As shown in Figure 16, the vessel speed appeared to be zero, and the electric power of the vessel was kept below 500 kW. As shown in Figure 17, the battery could be charged by increasing the D/G load, and power was supplied using only the battery. Cluster 1-2 is the section operated in the electric mode. The thruster output appeared to be zero, and the electrical outputs of the M/E and P/M were high, as shown in Figure 18. The batteries were not used for Cluster 1-2 because the vessel’s power fluctuations were not large, and the operation time was short. Cluster 1-3 is the mechanical mode. All outputs from M/E, P/M, and thrusters appeared to be zero. The power of the vessel was similar to that of Cluster 1-1; hence, the battery operation is equally applicable.
The cluster characteristics presented in Table 3 and Table 4, and the characteristics of the operation data within each cluster can be identified to analyze how much the vessel is operating in what mode. The analysis results confirm that the optimal operation method for the battery and engine can be derived.
6. Conclusion
This paper proposed a data clustering method for optimized battery operation of an offshore vessel. Although the battery application methods using theory or simulation were previously discussed, the data analysis method was applied using actual vessel data. The features of the entire vessel profile have been identified by separating them into clusters, and the vessel operation modes were defined as the anchor mode, stand-by mode, propulsion mode, and DP mode without additional information, such as engaged/disengaged clutch. In addition, the operation section was divided into the electric mode and mechanical mode in the propulsion mode. On the basis of this, the battery operation application was proposed by considering the electric power features.
If various vessels continue to accumulate data in the future, Big Data will continue to derive improved battery operation methods by considering the type of vessels and operating areas. This is expected to allow more efficient battery applications when building new or retrofitting existing vessels.
Author Contributions
Conceptualization, M. S. Shin; Methodology, M. S. Shin and C. H. Jeon; Software, S. W. Nam; Formal Analysis, S. W. Nam; Investigation, C. H. Jeon; Resources, C. H. Jeon; Data curation, M. S. Shin; Writing-Original Draft Preparation, M. S. Shin; Writing-Review & Editing, C. H. Jeon and S. W. Nam; Visualization, M. S. Shin; Supervision, H. G. Woo; Project Administration, H. G. Woo; Funding Acquisition, M. S. Shin.
References
-
M. Granovskii, I. Dincer, and M. A. Rosen, “Greenhouse gas emissions reduction by use of wind and solar energies for hydrogen and electricity production: Economic factors,” International Journal of Hydrogen Energy, vol. 32, no. 8, pp. 927-931, 2007.
[https://doi.org/10.1016/j.ijhydene.2006.09.029]

-
M. Ehsani, K. M. Rahman, and H. A. Toliyat, “Propulsion system design of electric and hybrid vehicles,” IEEE transaction on Industrial Electronics, vol. 44, no. 1, pp. 19-27, 1997.
[https://doi.org/10.1109/41.557495]

-
K. Cullinane and R. Bergqvist, “Emission control areas and their impact on maritime transport,” Trasportation Research Part D: Transport and Environment, vol. 28, pp. 1-5, 2014.
[https://doi.org/10.1016/j.trd.2013.12.004]

-
S. J. Kim, M. H. Kwon, S. W. Choi, S. M. Paik, and M. S. Kim, “A PCS control strategy for hybrid ESS with function of emergency power supply,” The Transactions of the Korean Institute of Power Electronics, vol. 21, no. 4, pp. 302-311, 2016 (in Korean).
[https://doi.org/10.6113/TKPE.2016.21.4.302]

- Elbow method (clustering), https://en.wikipedia.org/wiki/Elbow_method_(clustering), , Accessed June 3, 2020.
-
H. E. Lindstad, G. S. Eskeland, A. Rialland, “Batteries in offshore support vessels – Pollution, climate impact and economics,” Transportation Research Part D: Transport and Environment, vol. 50, pp. 409~417, 2017.
[https://doi.org/10.1016/j.trd.2016.11.023]

-
J. S. Kim, H. M. Jeon and D. K. Kim, “A study on characteristics of each operation mode for hybrid electric propulsion ship by operation circumstances,” Journal of the Korean Society of Marine Engineering, vol. 41, no. 3, pp. 245-250, 2017 (in Korean).
[https://doi.org/10.5916/jkosme.2017.41.3.245]


