Thermal radiation assessment of flaring gas in floating LNG bunkering terminal
Copyright ⓒ The Korean Society of Marine Engineering
This is an Open Access article distributed under the terms of the Creative Commons Attribution Non-Commercial License (http://creativecommons.org/licenses/by-nc/3.0), which permits unrestricted non-commercial use, distribution, and reproduction in any medium, provided the original work is properly cited.
Abstract
A floating LNG bunkering terminal (FLBT) is a marine unit capable of receiving LNG through an LNG carrier and storing LNG and bunkering fuel into LNG-fueled vessels using an LNG bunkering shuttle. The FLBT is accompanied by LNG bunkering-related processes, such as loading/unloading, reliquefaction, and gas flare, within a limited space on the vessel. The heat radiated from the flaring gases causes the personnel working on the FLBT platform to be frequently exposed to risks that may be lethal. Therefore, for safety purposes, a quantitative evaluation of the thermal radiation of the ignited flare gas ejected from a flare tower is required to understand the hazards that the personnel, assets, and environment on the FLBT platform may be exposed to. In this study, the worst scenario that occurs in an emergency flaring was selected to assess the thermal radiation effect when the highest release of boil-off gas was ignited. Additionally, the acceptance of the thermal radiation level of the flaring gas was numerically analyzed and verified based on practical guidelines.
Keywords:
Floating LNG Bunkering Terminal (FLBT), Liquefied Natural Gas (LNG), Flaring gas, Thermal radiation, Computational fluid dynamics (CFD)1. Introduction
The International Maritime Organization has issued the “Global Sulfur Cap 2020” as the limit for the permissible amount of sulfur to be used in fuel oil for oceangoing ships [1]. To respond to the tightened marine emission regulations, eco-friendly LNG-fueled vessels and LNG bunkering systems for fuel supply are being actively developed [2][3]. Among the various bunkering methods for supplying LNG to LNG-fueled vessels, the Floating LNG Bunkering Terminal (FLBT) is a new concept proposed for delivering LNG fuel to ships anchored on a dock using an LNG Bunkering Shuttle (LNGBS) [4]. Owing to the function of the FLBT platform, which comprises chemical processes required for the loading/unloading and storage of LNG, a performance that reflects safety designs and reliability analysis through risk assessment is regarded as one of the most important issues, similar to those of other offshore oil and gas plants [5].
As a major safety device, flares are often used at chemical plants and petroleum refineries to control the regulated vent streams and manage nonroutine emissions [6]. These gases and liquids are typically flammable and toxic, and corrosive gases may be released from process plants during startup, shut down, normal operation, and emergency conditions [7]. During the flaring process, in which combustion techniques are used for converting the venting materials into less harmful compounds, a main hazard is the thermal radiation emitted by the flares, which can severely impact both the personnel and equipment [8]. The consequence analysis of thermal radiation from flares has been widely conducted using a jet fire model in PHAST software v6.5 [9]. Additionally, the combustion noise of a flare gas system has been calculated using a sound pressure level in Flaresim software [10][11], which typically evaluates whether the thermal radiation and noise levels on the target platform are lower than the acceptable values.
This gas flaring system has also been applied in the operation process of the FLBT; however, several parameters, such as the tip diameter and number, have not yet been considered according to the current phase in the basic design of the flare system. This paper reports the effect of thermal radiation on the topside area of an FLBT platform evaluated to ensure safety, using Fire Dynamics Simulator (FDS) software v6.7.
2. General Description
The FLBT was designed with a storage tank of volume 220,000 m3, which can manage a loading rate of 14,000 m3/h for an LNG carrier and an unloading rate of 1,500 m3/h for each of the two bunkering shuttles. The FLBT offshore plant is acceptable for medium- and large-scale LNG bunkering. It is not necessary to change the existing port facilities and reduce risks from the port. The principal dimensions of the FLBT are summarized in Table 1.
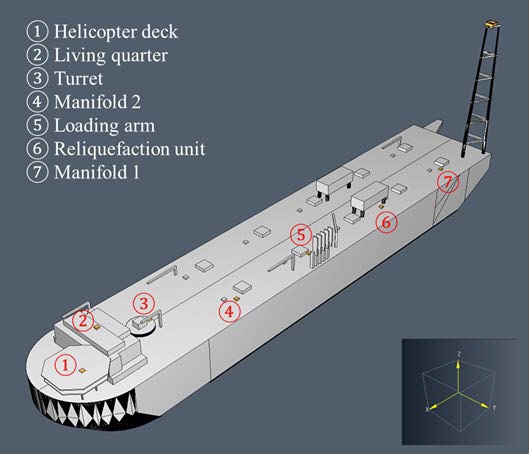
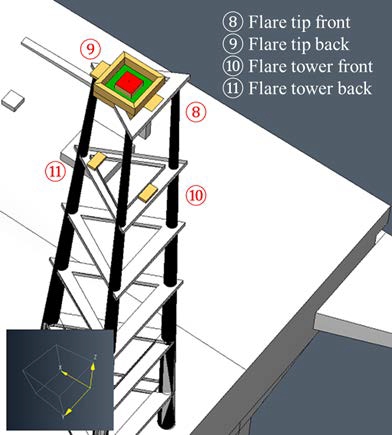
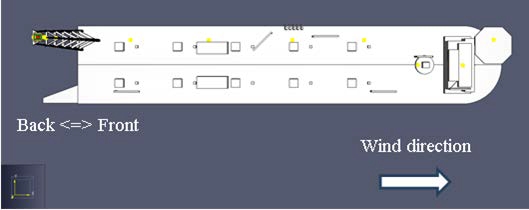
The FLBT geometry has a hull measuring approximately 350 m × 60 m × 32 m, as shown in Figure 1. The CAD model of the FLBT platform is imported using PyroSim [9]. Monitoring devices are located on the ① helicopter deck, ② living quarter, ③turret, ④ manifold 2, ⑤ loading arm, ⑥ reliquefaction unit,and ⑦ manifold 1. The flare tower is approximately 90 m high. As shown in Figure 2, additional monitoring devices for the flare tower are located on the ⑧ flare tip front, ⑨ flare tip back, ⑩flare tower front, and ⑪ flare tower back. All monitoringdevices are mounted on the center of the top surface of the rectangular obstruction (yellow color), modeled as a specific boundary condition with thermal properties of steel and 0.01 m thickness for heat-transfer calculation.
3. Methodology
3. 1 Combustion and Radiation Models
The flare radiation simulations were conducted using FDS software [13] and the results were visualized using Smokeview [14], which is a product of an international collaborative effort led by the National Institute of Standards and Technology and the VTT Technical Research Centre of Finland. The software package is widely used in the fire engineering community and provides comprehensive verification and validation [15].
Based on the largeeddy simulation technique in FDS, the Favrefiltered transport equations of mass, momentum, energy, and species, combined with the equation of state for an ideal gas, have been summarized in a previous dispersion study [16]. To model combustion and radiation for the flare radiation study, the source terms of and were activated in the energy transport equation. More details regarding the model are described in [15][16]. A brief background of the model is summarized below.
For a one-step global mechanism, the stoichiometric oxidation of methane fuel, assumed as a flaring gas, can be expressed as
| (1) |
Here, the chemical species are grouped by the mole fraction into lumped species, Z, such as fuel (F, CH4), air (A, composed of 21% O2 and 79% N2 by volume), and products (P, composed of 9.5% CO2, 19% H2O, and 71.5% N2 by volume).
| (2) |
Based on the mixing-limited, infinitely fast reaction of lumped species, the combustion model determines the mass production rate of species i per unit volume, , in the species transport equation. When the fuel and oxidizer are initially non-premixed, the mean chemical source term for the fuel is modeled using the eddy dissipation concept, where the rate of fuel consumption is proportional to both the local limiting reactant concentration and local rate of mixing [15].
| (3) |
Here, YF and YA indicate the lumped mass fractions of fuel and air, respectively, and stoi indicates the mass stoichiometric ratio of air. The characteristic time scale for mixing, 𝜏mix, is generally assumed as the fastest of the three time scales for diffusion, subgrid-scale advection, and buoyant acceleration specific to the cell size (filter width) [15].
Once for species i has been determined, the heat release rate per unit volume, , is calculated by summing the mass production rates for each species times their respective heats of formation.
| (4) |
where Δℎf,i is the heat of formation of species i. This indicates that the faster the reactants are mixed, the more heat is released.
Meanwhile, the gas-phase thermal radiation is contained in the divergence of the heat flux vector, , in the energy equation [15][16]. The radiative source term is defined by the net contribution to the radiative loss term, as follows:
| (5) |
where is the radiant heat flux vector.
3. 2 Heat Flux Model
The net heat flux is the sum of the radiative and convective heat fluxes at a solid surface, without considering the heat source generated by the pyrolysis at the surface boundary [15].
| (6) |
The radiative heat flux is the net radiative heat flux, composed of incoming and outgoing heat fluxes.
| (7) |
The incoming radiative heat flux is a component absorbed within an infinitely thin layer at the solid surface from the surrounding gases, where 𝜀 indicates emissivity and indicates the incident radiative heat flux based on the integrated radiation intensity at a measuring device. The outgoing radiative heat flux is the component emitted at the solid surface, where 𝑇s is the surface temperature. The convective heat flux is calculated as follows:
| (8) |
where h is the convective heat-transfer coefficient and 𝑇g is the gas temperature in the vicinity of the wall. In the present study, the wall was modeled as a 0.01-m-thick steel surface. A constant value of h = 10 W/m2∙K was used to calculate the wall-surface temperature. The thermal properties of the steel were fixed as follows: density of 7,500 kg/m3, specific heat of 0.5 kJ/kg∙K, conductivity of 50 W/m∙K, emissivity of 0.9, and mean absorption coefficient of 5 × 10⁴ 1/m.
When the net heat flux was zero, the adiabatic surface temperature was calculated using an analytical solution.
| (9) |
where 𝑇AST is the adiabatic surface temperature.
3. 3 Wind Model
The atmospheric boundary layer in FDS was modeled using the Monin–Obukhov similarity theory [15]. The wind profile, u, and potential temperature are functions of height, z:
| (10) |
| (11) |
where 𝑢∗ is the friction velocity; k = 0.41 is the Von Kármán constant; and Z0 = 0.03 m is the aerodynamic roughness length for an open space, based on the Davenport–Wieringa classification. In addition, 𝜃∗ is the scaling potential temperature; 𝜃0 is the ground-level potential temperature; and L is the Obukhov length, which characterizes the thermal stability of the atmosphere. Furthermore, the similarity functions proposed by Dyer are used in 𝜓m and 𝜓h. Note that a neutrally stratified atmosphere has an infinite Obukhov length; however, unstable atmospheres are considerably affected by buoyancy-induced turbulence, resulting in enhanced mixing because of a decrease in temperature with height. In contrast, the stable atmospheres suppress the turbulence mixing because of an increase in temperature with height.
4. Flare Modeling
4. 1 Flaring Condition and Modeling
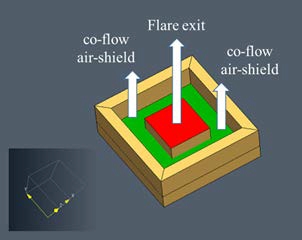
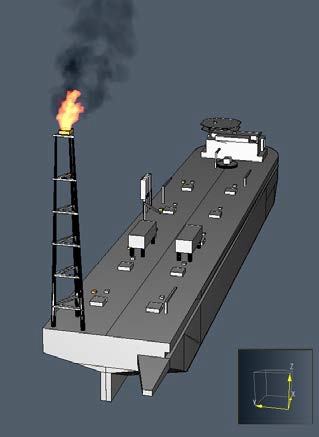
The mass flow rate of the flare gas was determined as the maximum release rate considering the Boil-Off Gas (BOG) rates, according to the loading condition presented in Table 2. As shown in Figure 3, the flare gas replaced with methane gas was assumed to be injected vertically upward on a 2 m × 2 m surface. The flare exit was positioned 123 m above the tip of the flare tower. The volume flow rate was set to 5.63 m3/s by assuming a releasing methane temperature of −160 ℃. An air flow with a specific velocity of 15 m/s, which is similar value to that of the exit velocity of the fuel, was supplied around the flare exit to shield the initial methane from flowing across the ambient wind flow. The initial velocity profiles of the central fuel and co-flow air were used as a top hat. From the flare burner modeling, a flare image with heat release and smoke emission was obtained, as shown in Figure 4.
For comparison, the intensity of solar radiation ranged 0.79–1.04 kW/m2 depending on the geographical location and time of year. Solar radiation can be a factor for some locations; however, its effect added to flare radiation imposes only a minor effect on the acceptable exposure time. In this study, a solar radiation of 1.0 kW/m2 was considered for the radiation calculations.
4. 2 Grid Refinement
A three-dimensional 400 m × 140 m × 200 m domain was established in multisized meshes with the smallest finite volume of 0.5 m × 0.5 m × 0.5 m. A total of 11,861,500 cells were used after a grid independence analysis, and the cell size ratio was unified to 1 in the Cartesian coordinate system. The grid cell size affects the run time and result accuracy. The FDS software [13] suggests performing a mesh sensitivity study in which a model is first executed with a relatively coarse mesh, followed by gradually decreasing the cell size until the difference in the results becomes insignificant. To select an appropriate grid resolution, FDS recommends calculating the following sion expression:
| (12) |
which should range between 4 and 16 according to the validation study sponsored by the U.S. Nuclear Regulatory Commission [15]. 𝛿x is the nominal size of a mesh cell and 𝐷∗ is the characteristic flare diameter:
| (13) |
where is the total heat-release rate of the flare [kW/m2], 𝜌∞ is the air density (=1.2 kg/m3), Cp is the air thermal capacity (=1.0 kJ/kgK), T∞ is the ambient air temperature (=293 K), and g is the gravitational acceleration (=9.81 m/s2). According to the selected flaring condition, the grid resolution around the flare tip location was determined as 0.05 m. Here, the nondimensional value was calculated as , specific tothe heat release rate of 49.75 kW for pure methane.
4. 3 Ambient Condition
Assuming that realistic meteorological conditions were disregarded, the initial wind profiles were artificially generated using the reference velocity of uref = 5, 10, 20, and 30 m/s at 𝑧ref = 122.0 m and the neutral Obukhov length (L = 1000000). The initial wind was set to a direction of 270° and blew toward the positive direction of the x-axis, as shown in Figure 5. The initial temperature of the ambient air was set at 20 °C, with a relative humidity of 40%. An adiabatic property was generated at the bottom-surface boundary condition, and the other boundary conditions were set to open, which enabled a typical inflow/outflow condition.
5. Results and Discussion
5. 1 Acceptance of Radiative Heat Flux
Equation 14 expresses the exposure times required for reaching the pain threshold, tth, as a function of the radiation intensity, Irad. The data were derived from tests conducted on people who were radiated on the forearm at room temperature. The data indicate that burns follow the pain threshold fairly quickly [17].
| (14) |
Because the allowable radiation level is a function of exposure length, factors involving reaction time and human mobility should be considered. In emergency releases, a reaction time of 3–5 s may be assumed. If 5 s have elapsed before an average individual seeks cover or departs from the area, then the total exposure period will range from 8 to 10 s. In evaluating the emergency procedures, an exposed individual becoming incapacitated during an attempt to exit the area may be considered.
Based on API 521 [17], the flare owner or operator shall determine the need for a solar-radiation-contribution adjustment to the values listed in Table 3. In this context, the maximum permissible design levels of radiation for the exposure of personnel at the maximum emergency flaring were assigned as follows:
- ● Continuous full-shift exposure: 1.6 kW/m2
- ● Operational blowdown (maximum 30 min): 3.2 kW/m2
- ● 60 s peak exposure: 4.7 kW/m2
- ● 29 s peak exposure: 6.3 kW/m2
This recommended practice is a more stringent requirement than API 521. In an emergency blowdown, 3.2 kW/m2 will be applied as the radiation criterion, which is expected to occur with a maximum exposure duration of 30 min. The operators are assumed to be equipped with at least single-layer whole-body working clothing and a hard hat. The peak exposure times correspond to the time required to escape to a safe location.
5. 2 Simulation Results
Figure 6 shows the representative velocity and temperature fields on the x–z plane at y = 19 m, which is the center location of the flare tower for the wind velocities of 5, 10, 20, and 30 m/s when the emergency releasing gas is flaring. The chemically reacting flow of methane gas was calculated under all crosswind conditions, which blew identically toward the FLBT platform in the x-direction. Consequently, the radiation levels reaching the platform were investigated and the results were described based on specific locations.
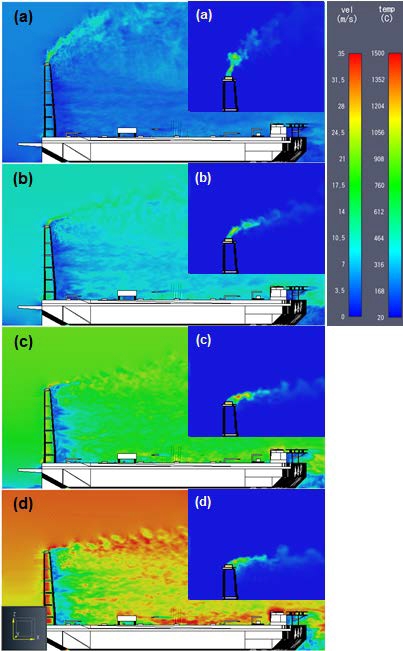
Representative velocity (left) and temperature (right) fields for wind velocities of (a) 5, (b) 10, (c) 20, and (d) 30 m/s
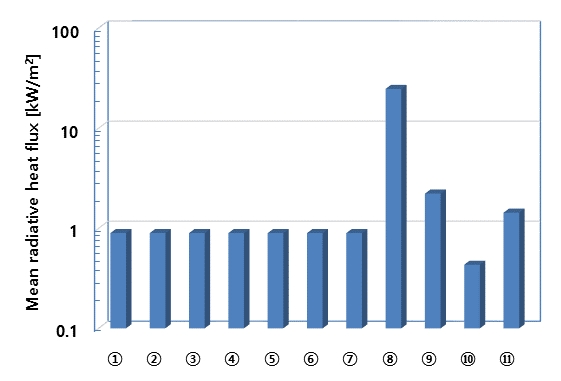
At a wind velocity of 5 m/s, the mean radiative heat flux was presented for the major facilities shown in Figure 7. The results are listed, with the standard deviations of the monitoring devices, in Table 4. The statistical values were obtained from the time average of 100 s after an unsteady period.
The maximum radiative heat flux did not exceed 0.9 kW/m2 for the ① helicopter deck, ② living quarter, ③ turret, ④ manifold 2, ⑤ loading arm, ⑥ reliquefaction unit, and ⑦ manifold 1.Considering an initial solar radiation of 1.0 kW/m2 with asurface emissivity of 0.9, it is reasonable to state that the effect of the radiative heat flux emitted from the heat release rate by the flaring was negligible. These results were similar to those obtained under other wind conditions. Hence, the radiative heat flux originating from the flaring system will not affect the personnel on the FLBT platform.
For the flare tower, however, the locations around the flaring gas exit, such as the ⑧ flare tip front and ⑨ flare tip back, can be significantly affected by the mean radiative heat flux of approximately 24–58 kW/m2 in the steady state with respect to variations in the wind velocity of 5–30 m/s, as listed in Table 5. At the monitoring devices approximately 20 m below the flare tip, such as at the ⑩ flare tower front and ⑪ flare tower back, the maximum radiative heat flux on the beam surface reached up to approximately 1.6 kW/m2. Hence, the detailed design of the flaring nozzle and beam structure around the flaring nozzle must protect the flaring assets.
6. Conclusion
In this study, a flare radiation assessment was conducted for the conceptual design of the FLBT. A flaring gas burner was modeled using FDS software under the emergency blowdown condition. Radiative heat fluxes were estimated in various target areas to confirm the safety criteria adopted in this study. The safety acceptance for the monitoring devices is summarized in Table 6, which was specific to the flaring gas when the highest release of BOG was ignited. No hazardous effects were imposed on the personnel on the open deck under emergency flaring scenarios with a flaring height of 122 m, because the maximum radiation intensities on the monitoring devices were below 1.6 kW/m2. In the next design phase of the FLBT project, to further develop the flaring system and its operation, a final radiation calculation based on the detailed conditions will be performed by safety engineers after confirming the flare tower height.
Acknowledgments
This work is part of the Development of Technology for Floating Offshore LNG Bunkering System project funded by the Ministry of Ocean and Fisheries. We are grateful for the support from the project of the Development of Basic Design Technology for ARC7 Class Arctic Offshore Structures funded by the Ministry of Trade, Industry, and Energy.
Author Contributions
Conceptualization, B. C. Choi; methodology, B. C. Choi; Software, B. C. Choi; Formal Analysis, B. C. Choi; Investigation, I. C. Jung and H. Y. Lee; Resources, I. C. Jung and H. Y. Lee; Data curation, I. C. Jung and H. Y. Lee; Writing-Original Draft Preparation, I. C. Jung, H. J. Jo, and B. C. Choi; Writing-Review & Editing, I. C. Jung, H. J. Jo, and B. C. Choi; Visualization, B. C. Choi; Supervision, I. C. Jung, H. J. Jo, and B. C. Choi; Project Administration, D. H. Jung and H. G. Sung; Funding Acquisition, D. H. Jung and H. G. Sung.
References
- The Secretariat of the IMO, IMO Official Web Site, http://www.imo.org/en/OurWork/Environment/PollutionPrevention/AirPollution/Pages/Sulphur-oxides-(SOx)-–-Regulation-14.aspx, , Accessed October 25th, 2017.
-
J. H. Kim, D. H. Doh, and B. C. Choi, “Evaluation of the ventilation safety requirements for the fuel gas supply system room of a gas-fueled vessel: Simulated leaks of methane and propane,” Journal of Mechanical Science and Technology, vol. 32, no. 11, pp. 5521-5532, 2018.
[https://doi.org/10.1007/s12206-018-1050-7]

-
D. H. Doh, K. W. Chun, N. Ninomiya, and B. C. Choi, “A swirl static mixer with diluent for reducing the flammable extent of venting gases in a low-flashpoint fueled vessel,” Journal of Mechanical Science and Technology, vol. 33, no. 7, pp. 3311-3321, 2019.
[https://doi.org/10.1007/s12206-019-0626-1]

- Korean Register (KR), Floating LNG Bunkering Terminal HAZID Workshop Report, KR-HSE-HAZD-RPT-008B, Republic of Korea, 2015.
-
A. Brandsæter, “Risk assessment in the offshore industry,” Safety Science, vol. 40, no. 1-4, pp. 231–269, 2002.
[https://doi.org/10.1016/S0925-7535(01)00048-0]

- U. S. EPA Office of Air Quality Planning and Standards (OAQPS), “Parameters for Properly Designed and Operated Flares,” Report for Flare Review Panel, U. S., April 2012.
-
C. M. Kim and B. C. Choi, “Dispersion analysis of the unignited flare gas in an LNG-FPSO vessel,” Journal of the Korean Society of Marine Engineering, vol. 41, no. 8, pp. 753-759, 2017.
[https://doi.org/10.5916/jkosme.2017.41.8.753]

- L. Xuejiang, H. Li, and Y. Yi, “Thermal radiation and noise safety assessment of an offshore platform flare stack as sudden emergency relief takes place,” International Journal of Mechanical and Mechatronics Engineering, vol. 10, no. 11, pp. 1847-1850, 2016.
-
H. S. Lee, B. S. Ko, J. M. Yang, C. J. Lee, J. H. Yoo, D. I. Shin, C. H. Park, and J. W. Ko, “Reduction of thermal radiation by steam in flare stack system,” Korean Journal of Chemical Engineering, vol. 29, no. 10, pp. 1310-1320, 2012.
[https://doi.org/10.1007/s11814-012-0005-4]

- L. Xuejiang, H. Li, and Y. Yi, “Thermal radiation and noise safety assessment of an offshore platform flare stack as sudden emergency relief takes place,” International Journal of Mechanical and Mechatronics Engineering, vol. 10, no. 11, pp. 1847-1850, 2016.
- A. Soni, and N. Parmar, “Flare radiation mitigation analysis of onshore oil & gas production & refining facility for a low cost be-bottlenecking using computer aided techniques,” International Journal of Scientific & Engineering Research, vol. 9, no. 2, pp. 975-982, 2018.
- Thunderhead Engineering, Pyrosim user manual, https://support.thunderheadeng.com/docs/pyrosim/, , Accessed October 1st 2018.
- K. McGrattan, S. Hostikka, R. McDermott, J. Floyd, and M. Vanella, Fire dynamic simulator user’s guide, NIST special publication 1019, 6th ed., https://pages.nist.gov/fds-smv/manuals.html, , Accessed October 1st 2017.
- G. P. Forney, Smokeview, a tool for visualizing fire dynamics simulation data vol. I: user’s guide, NIST special publication 1017-1, 6th ed., https://pages.nist.gov/fds-smv/manuals.html, , Accessed October 1st 2018.
- K. McGrattan, S. Hostikka, R. McDermott, J. Floyd, and M. Vanella, FDS Technical reference guide vol. 1: mathematical model, vol. 2: verification, vol. 3: validation, 6th ed., https://pages.nist.gov/fds-smv/manuals.html, , Accessed October 1st 2018.
-
B. C. Choi, K. H. Park, and D. H. Doh, “Impacts of cold gas temperature and cylindrical obstacles on the dispersing flammable limits of accidental methane releases in an LNG bunkering terminal,” Journal of Hazardous Materials, vol. 355, pp. 104-110, 2018.
[https://doi.org/10.1016/j.jhazmat.2018.05.021]

- American Petroleum Institute, “Pressure-relieving and depressuring systems 6th ed.,” API Standard 521, January, 2014.


