Experimental investigation of ice production using a static ice-on-coil ice-making approach
Copyright ⓒ The Korean Society of Marine Engineering
This is an Open Access article distributed under the terms of the Creative Commons Attribution Non-Commercial License (http://creativecommons.org/licenses/by-nc/3.0), which permits unrestricted non-commercial use, distribution, and reproduction in any medium, provided the original work is properly cited.
Abstract
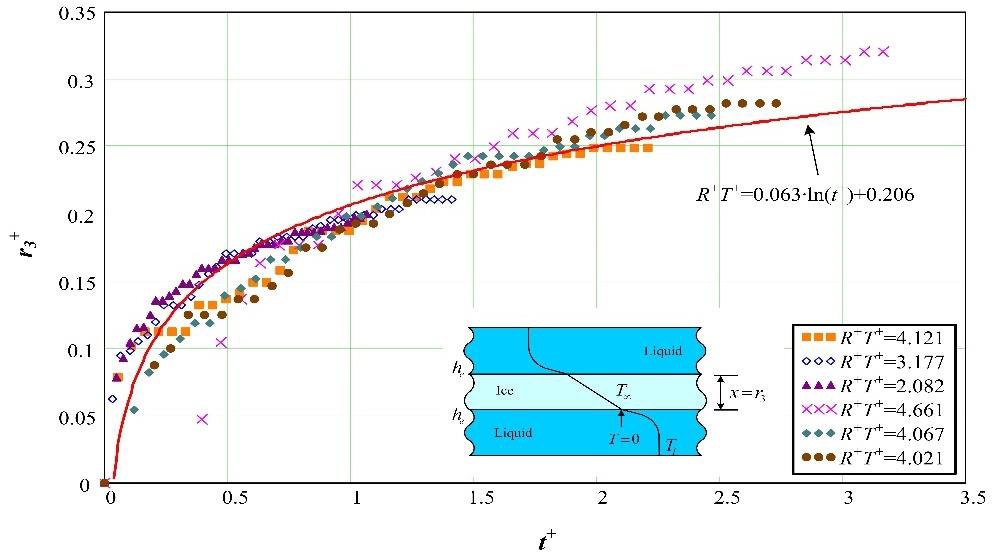
The ice-making characteristics of a coil-type ice maker are experimentally investigated. The experiment was conducted under the following conditions: coolant temperatures of −10, −8, and −6 °C, coolant flow velocities of 1.0, 1.4, and 1.8 m/s, and initial water temperatures of 6, 9, and 12 °C. The relationship between the nondimensional ice thickness and the nondimensional freezing time was examined experimentally. The nondimensional correlation equations for coolant temperature, water temperature, coolant flow velocity, initial water temperature, and copper tube size were derived as r3+ = 0.063ln(t+) + 0.206 in the range of R+T+ = 2.1–4.7.
Keywords:
Ice-on-coil type ice maker, Nondimensional ice thickness, Nondimensional freezing time, Thermal resistance model1. Introduction
In recent years, as part of the focus on reducing the electric power consumption differential between day and night, considerable research on heat saving has been conducted. In particular, there has been extensive research on heat saving for ice production (latent heat saving) for the use of surplus electric power during the night. Consequently, latent heat saving technology has witnessed rapid development [1].
Over the past few years, several studies have been conducted on ice heat-saving technology, but these have been limited to static ice-making types of production in which ice is made on a heat transfer area. This static-type ice-making system has a serious weakness in that the increasing ice creates thermal resistance, thereby decreasing the coefficient of performance of the refrigerator over time.
Studies in this field include those by Kang [2], who studied the cooling coil model, Min [3], who studied the handling method of cooling load, and Lee [4], who investigated the phenomena of ice production around the cooling coil. In addition, Ahn [5] and Park [6] conducted research on the operating characteristics of ice-on-coil-type refrigeration. Furthermore, Jekel [7], Vick [8], and Nelson [9] developed theoretical models for the internal melting of ice-on-coil tanks. They modeled the ice cylinder as growing over the tube at the same speed in different directions during the charging process, while the water cylinder grew concentrically within the ice cylinder during discharge. Finally, Zhu [10] reported a dynamic simulation model for the internal melting of ice-on-coil tanks with built-in horizontal tubes.
In the present study, to support the development of ice-making systems that can exploit surplus electric power at night, the ice-making characteristics were experimentally investigated under various conditions; in particular, nondimensional analysis was conducted.
2. Experimental description
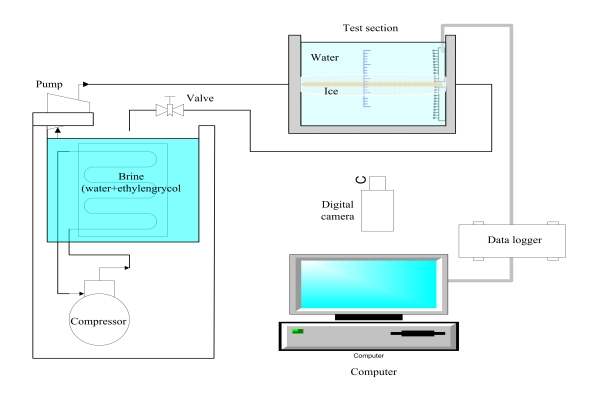
Following the experimental method of the conventional research of an author [11], in the present study, the coolant temperature was controlled in a constant temperature bath (volume = 22 L and T = −20–99 °C) and was pumped around the circulation pipe. A copper tube, which was attached to the center of a water bath (180 mm × 140 mm × 130 mm), was maintained at a constant temperature. Figure 1 shows the experimental apparatus used in the present study. The setup consists of a constant-temperature bath to ensure that the coolant remains at a constant temperature (30%vol solution of ethylene glycol, with a melting temperature of −12 °C), a coolant circulation pipe, a water bath made of acrylic resin, and a copper tube in the water bath as the test section.
The experimental conditions are listed in Table 1. The parameters are coolant temperature, initial water temperature, coolant flow rate, and the dimensions of the copper tube.
A scale for measuring the thickness of the produced ice was attached to the front panel of the water bath, and Vernier calipers were used to measure the ice thickness. Additionally, to minimize reading error, digital photography was used.
To measure the flow rate of the coolant, a flow meter was installed at the outlet of the coolant circulation pipe and T-type thermocouples (uncertainty = ±0.1 K) were installed at the inlet and outlet of the test section copper tube. In addition, the temperature of water in the water bath was measured by T-type thermocouples installed at 2-mm intervals in upward and downward directions.
The coolant temperature was controlled in the constant-temperature bath with refrigeration, and coolant was pumped through the circulation pipe in a closed loop. As a result, the temperature of the copper tube, which was attached to the center of the water bath, was maintained at a near-constant temperature.
3. Results and discussion
3. 1 Effect of the coolant temperature
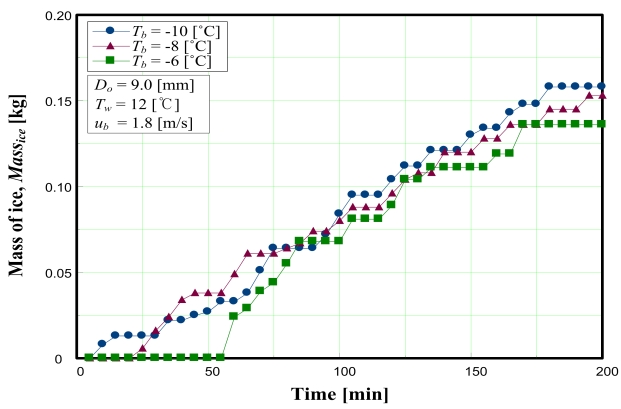
Figure 2 indicates that the mass of ice produced increases with lower coolant temperatures. This is caused by the increase in heat flux through the copper. For the same reason, the onset points of freezing were delayed according to the strength of the heat flux from the coolant temperature.
3. 2 Effect of cooling tube diameter
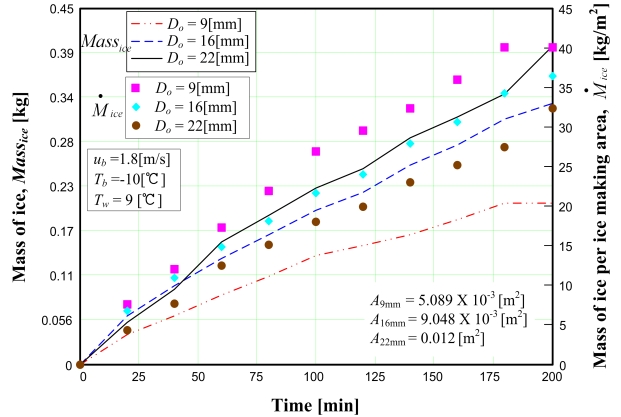
The influence of copper tube size (i.e., the heat transfer area) on the amount of ice produced is indicated in Figure 3, which depicts the plots of the amounts of ice produced for different experimental diameters. The lines represent the total mass of ice produced, and the solid symbols represent the mass of ice produced per unit area of the copper tubes. Because increasing the cooling tube diameter causes the heat transfer area to increase, the mass of ice also increases. However, the mass of ice per unit area exhibits a different tendency, caused by the thermal boundary layer. A smaller tube diameter reduces the development of this boundary layer; hence, heat transfer increases as the tube diameter decreases.
3. 3 Effect of initial water temperature
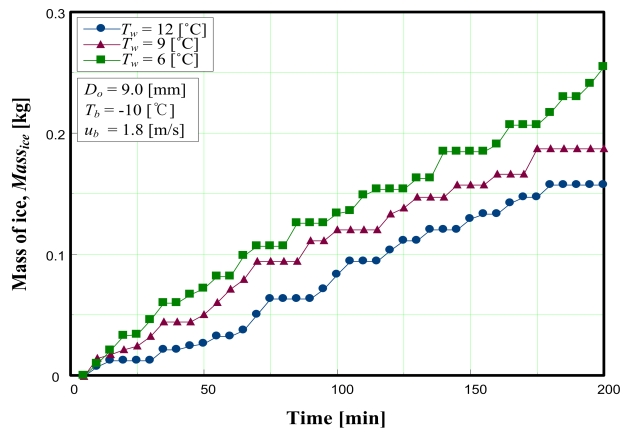
Figure 4 shows the variation in the mass of ice produced according to initial water temperature. The initial water temperatures were 6, 9, and 12 °C. From Figure 4, it is clear that ice production was higher when the initial water temperature was lower. This results from the fact that the thermal boundary layer is thinner with lower initial water temperatures.
3. 4 Effect of coolant velocity
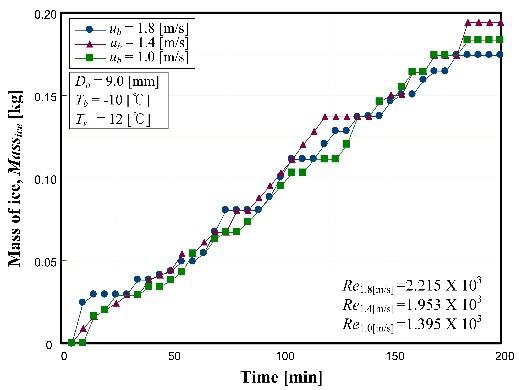
Figure 5 shows the effect of coolant flow velocity on the production of ice. For the range of this experiment, there were no significant differences. Although the flow velocity of coolant was changed from 1.0 to 1.8 m/s, the Reynolds numbers remained in the laminar region. Consequently, the forced convection of coolant did not lead to a notable effect.
3. 5 Freezing behavior and measured amount of ice making
Generally, for an ice-on-coil-type ice maker, ice is formed on the outside surface of a copper tube.
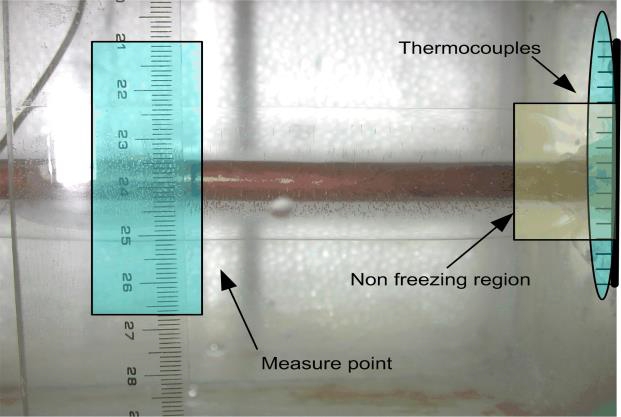
Figure 6 shows that, as a result of heat transfer from the external environment, nonfreezing regions arose at the inlet and outlet sides of the copper tube. Because the horizontal and vertical ice thicknesses on the outside surface of the copper tube varied over time, the total amount of ice produced was calculated as follows:
1. The thickness of ice was measured horizontally and vertically at fixed time intervals. The heat resistance of the copper tube was assumed to be negligible.
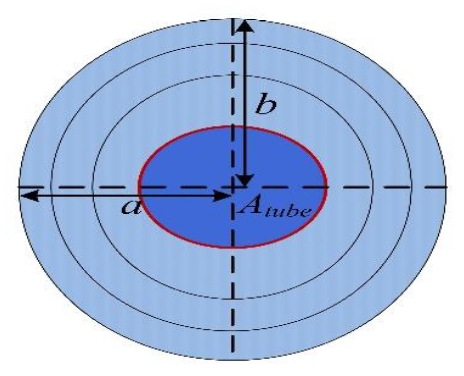
2. Because the growth of ice differed horizontally and vertically, a cross section of ice was calculated by using
| (1) |
and the volume of ice as visualized in Figure 7 was calculated by using
| (2) |
3. The apparent mass of the ice was calculated by multiplying the density of the ice at 0 °C and the volume of the ice obtained from Equation (2):
| (3) |
4. By referring to digital photographs of the freezing process,nonfreezing regions were calculated (measuring 5% on average).
5. The value of Mice from Equation (3) was reduced according to the nonfreezing region, resulting in the amount of ice produced: Massice (in kg).
Table 2 lists the ice thickness measurements taken using a ruler and Vernier calipers.
4. Analysis of nondimensional parameters
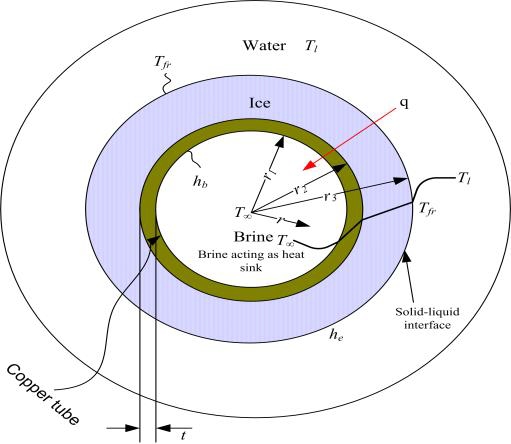
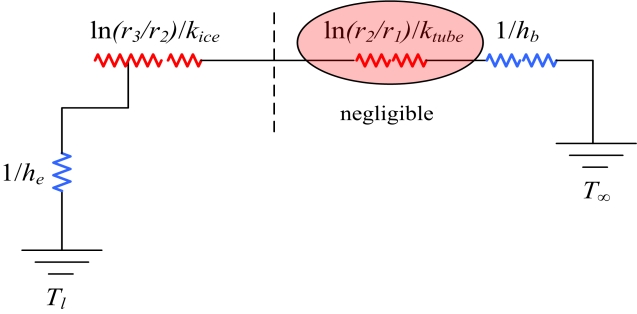
Analysis of the thermal flow within the phase-change material is very difficult and complex. In this study, for nondimensional analysis, the temperature distribution in Figure 8 was assumed for the freezing phenomena of the material.
In Figure 8, the temperature of the flowing coolant at the center of the copper tube is below freezing. Around the copper tube, ice had grown, and it is assumed that water surrounds the ice. The direction of thermal flow runs from the water to the coolant. Figure 9 indicates this mechanism as a thermal resistance model.
For nondimensional analysis in this study, it is used reference about the freezing of water [12].
Based on these assumptions, the governing equations for the cylindrical system are
| (4) |
where αdenotes the thermal diffusivity.
The boundary conditions are
i)Case, r = r2
| (5) |
ii)Case, r = r3
| (6) |
where kice denotes the thermal conductivity of ice, ρice is the density of ice, Lf is latent heat of the fusion of ice, and hb is the convective heat transfer coefficient of the coolant.
The primary assumptions of the model are as follows:
- ⚫ Heat resistance of the copper tube is negligible.
- ⚫ The physical properties are constant.
- ⚫ At the freezing point of 0 °C, the liquid condition is Tl = Tfr, and 1/he = 0.
- ⚫ The coolant temperature T∞ and the convective heat transfer coefficient hb are constants.
When the potential temperature is Tfr − T∞, the thermal flow rate per unit area is calculated as follows:
| (7) |
For freezing at r = r3, the thermal flow rate serves to remove the latent heat of solidification:
| (8) |
where dr3/dt is the volume flow per unit area (in m3/hr∙m2 at the growth surface), and ρiceLf is the latent heat per unit area (in J/m3). Combining Equations (7) and (8) gives
| (9) |
The following equation describes the ice thickness and the freezing time, with variables r3 and t taken from Equation (9):
| (10) |
The dimensionless parameters are defined as
| (11) |
| (12) |
Substituting these nondimensional parameters into Equation (10) gives
| (13) |
If the freezing process continues from t = t+ = 0 to time t, Equation (13) can be differentiated to give
| (14) |
or,
| (15) |
If the temperature of the liquid, Tl, is higher than the melting point and the convective heat transfer coefficient is he at the solid–liquid interface of the system, Equation (13) may written as
| (16) |
When nondimensional parameters are adopted, Equation (16) can be cast in a nondimensional form whose nondimensional parameters are
where R+ is the nondimensional heat transfer rate, he is the convective heat transfer coefficient of the surrounding ice, hb is the convective heat transfer coefficient of the coolant, T+ is the nondimensional temperature, and the remaining nondimensional parameters are the same as in Equation (13).
Figure 10 shows the level of ice production calculated from the experimental results according to the nondimensional parameters. With the potential-resistance ratio as R+T+, Figure 10 indicates the variation of nondimensional ice thickness as a function of nondimensional time.
The resulting nondimensional equation from the nondimensional analysis was produced as Equation (17) with a margin of error of ±14%. The range of application is R+T+ = 2.1–4.7.
| (17) |
5. Conclusion
In this study, a nondimensional analysis of a comparatively simple ice-on-coil-type ice-making system was performed. From this study, the following conclusion may be drawn: By using the experimental results, the nondimensional amount of ice production was described, with a margin of error of ±14%, as follows:
𝑅+𝑇+=0.063∙ln(𝑡+)+0.206
[range of application: R+T+ = 2.1–4.7]
Author Contributions
Conceptualization, J. S. Yu and M. J. Kim; Methodology, J. S. Yu and M. J. Kim; Software, J. S. Yu; Validation, J. S. Yu and M. J. Kim; Formal Analysis, J. S. Yu and M. J. Kim; Investigation, J. S. Yu and M. J. Kim; Resources, J. S. Yu; Data Curation, J. S. Yu; Writing—Original Draft Preparation, J. S. Yu; Writing—Review & Editing, J. S. Yu and K. W. Park; Visualization, J. S. Yu; Supervision, M. J. Kim; Project Administration, M. J. Kim and K. W. Park; Funding Acquisition, M. J. Kim and K. W. Park.
References
- J. S. Yu, J. M. Park, M. J. Kim, and K. W. Park, “Ice making characteristics on ice-on-coil type ice maker,” Proceedings of the SAREK Conference, pp. 192, 2007 (in Korean).
- C. D. Kang, J. H. Paik, K. W. Park, and H. G. Hong, “Trends in supply of ice thermal storage system,” Proceeding of the SAREK summer annual conference, pp. 1-6, 2003 (in Korean).
- J. K. Min, A. G. Yoo, J. H. Kim, and S. Kim, “A study on real time model of transfer process in an ice-on-coil tank,” Proceedings of the SAREK winter annual conference, pp. 40-46, 1993 (in Korean).
- S. R. Lee, K. H. Lee, and B. Y. Choi, “Laboratory test of optimal control algorithm for ice storage system,” Proceedings of the SAREK wither annual conference, pp. 446-450, 2000 (in Korean).
- Y. K. Jang, C. K. Heo, and S. Kim, “An experimental study on the ice making characteristics of an ice-on-coil type ice storage system,” Proceedings of the SAREK summer annual conference, pp. 84-88, 2002 (in Korean).
- H. Inaba, A. Horibe, and K. W. Park, “Study on ice making behavior of water solution with surfactant,” Korean Journal of Air-Conditioning and Refrigeration Engineering, vol. 13, no. 12, pp. 1175-1183, 2001 (in Korean).
- T. B. Jekel, J. W. Mitchell, and S. A. Klein, “Modeling of ice-storage tanks,” ASHRAE Transactions, vol. 99, no. 1, pp. 1016-1024, 1993.
- B. Vick, D. J. Nelson, and X. Yu, “Model of an ice-on-pipe brine thermal storage component,” ASHRAE Transactions, vol. 102, no. 1, pp. 45-54, 1996.
- D. J. Nelson, B. Vick, and X. Yu, “Validation of the algorithm for ice-on –pipe thermal storage system,” ASHRAE Transactions, vol. 102, no. 1, pp. 55-62, 1996.
-
Y. Zhu and Y. Zhang, “Modeling of thermal processes for internal melt ice-on-coil tank including ice-water density difference,” Energy and Buildings, vol. 33, no. 4, pp. 363-370, 2001.
[https://doi.org/10.1016/S0378-7788(00)00118-3]

-
M. J. Kim, “A study on the ice-on-coil as a static ice making type”, Journal of the Korean Society of Marine Engineering, vol. 32, no. 2, pp. 292-298, 2008 (in Korean).
[https://doi.org/10.5916/jkosme.2008.32.2.292]

- F. Kreith, R. M. Manglik, and M. S. Bohn, Principles of Heat Transfer, 7th ed., Stamford, USA: Cengage Learning, Inc, pp. 683-685, 2011.

