A study on the improvement of explosion-proof inspection process using process mining

Copyright ⓒ The Korean Society of Marine Engineering
This is an Open Access article distributed under the terms of the Creative Commons Attribution Non-Commercial License (http://creativecommons.org/licenses/by-nc/3.0), which permits unrestricted non-commercial use, distribution, and reproduction in any medium, provided the original work is properly cited.
Abstract
Because the offshore plant production process is extremely complicated, there are many difficulties in quality control and delivery schedule compliance. In particular, to prevent catastrophic offshore plant explosion accidents, most offshore plants since 2010 have implemented explosion-proof inspections based on IEC 60079. However, there has been little research on the improvement of such processes, and there is also a lack of experience in explosion-proof inspection in Korea. Therefore, in this study, the explosion-proof inspection process was analyzed by process mining using data from a quality management system. The cause of process delay was determined, and the explosion-proof inspection process was improved through an improvement algorithm. In addition, it was found that cost savings, an increase in productivity, and progress improvement can be achieved throughout the entirety of the project.
Keywords:
Offshore plant, Explosion proof, Process mining, Inspection, IEC 600791. Introduction
Korea's offshore plant industry was awarded many offshore plant projects by major oil companies with high oil prices in the early 2010. However, the international offshore plant industry has had few orders for new projects from major oil companies because of the slow global economic recovery since oil prices fell to the $30-per-barrel level in 2016. Expectations for new projects have risen somewhat as the profitability of oil and gas companies and processing ability has improved in recent years.
The offshore plant is a concept of a petrochemical plant in the sea, and work is performed at sea, where the working environment is poor. An offshore platform should be capable of performing oil and gas resource processing previously performed onshore. Various types of facilities are installed on the top of offshore plants, such as collection facilities, impurity treatment facilities, refining facilities, and storage facilities for energy resources, such as oil and gas [1].
Offshore plants have different crude oil treatment processes depending on the characteristics of the mine, various risk factors exposed in the complex process, and the occurrence of many accidents [2]. The frequency of fire or explosion resulting from oil and gas leakage is less than that of other accidents, but fire or explosion has a greater impact on the facility, life, and property. To prevent such damage, risk assessment and safety regulations to protect against fire and explosion on offshore platforms and floating production storage and offloading units are becoming more important worldwide [3].
Figure 1 is a photograph of the Deepwater Horizon explosion on April 20, 2010, in the Gulf of Mexico off the coast of Louisiana, USA. This drilling facility was designed and built in a domestic shipyard and was a semi-submersible rig operated by British Petroleum. Eleven drilling workers were killed, and another eighteen workers received serious injuries because of the explosion. It is estimated that 4.9 million barrels of crude oil spilled into the sea, causing serious marine pollution.

Deepwater Horizon accident on April 20, 2010
Fire and explosion accidents caused by gas leakage, as in the case of the above accident, do not occur frequently, but when an accident occurs, it causes tremendous property damage and human injuries. In addition, it has a tremendous impact on the crude oil harvesting process, resulting in huge economic losses. Equipment for production and storage on new offshore plants increases the risk of direct system integration, because they are located in limited spaces in the ocean. Accordingly, oil and gas leakage from offshore facilities is steadily increasing despite measures, such as equipment upgrades and reinforced worker action [3].
As a result of recent standards, an area on an offshore plant is designated as hazardous when the frequency, characteristics, and properties of oil and gas leakage are considered based on IEC (International Electrotechnical Commission) 60079-10 or the standards of individual countries, such as NORSOK (Norway), PUE (Russia, Kazakhstan), and AS/NZS (Australia and New Zealand), and explosion-proof equipment installation is required according to IEC 60079-14. In addition, an inspection must be performed according to IEC 60079-17. Explosion-proof equipment selection is decided in the engineering stage, and installation and inspection are carried out at the production process. In general, the inspection of explosion-proof equipment is the last step before applying power to the equipment, and the inspection schedule has a great influence on the next stage, which is commissioning, and the entire process.
The importance of inspection and maintenance of explosion-proof equipment is increasing, and it is also required in detail in construction work. However, at present, the verified inspection of equipment to ensure that it meets the requirements for being explosion-proof is not systematically managed at the stage of construction through an integrated quality management system. Complying with these requirements increases construction time and cost, and this can create a huge burden for plant owners and construction contractors.
In the case of the facility in this study, multiple modules are processed simultaneously so that multiple modules are delivered sequentially. Not only should completion management be considered, but also environmental factors of sea transportation and the schedule of shipments according to the local process schedule. It is exceedingly difficult to follow the schedule for various reasons. Therefore, domestic shipyards are making great efforts to analyze the problem of delay in the delivery schedule. However, they still use Excel in data analysis and statistical techniques, and these are difficult to apply to projects, because it takes a long time to obtain the analysis results. Despite the cost and time-consuming efforts, there are no measurable results.
In this study, the process of inspection of explosion-proof equipment (hereinafter “explosion-proof inspection”) in the construction of a complex offshore plant was analyzed by using a process mining technique based on meaningful information from the data (event log) accumulated from the construction and quality management system. The purpose was to reduce the cost and increase the productivity of the entire project, as well as provide explosion-proof inspection by using the improved method of identifying the tag capability for explosion-proof inspection.
2. Reference Theories and Current Trends
2.1 Description of Process Mining
Process mining is a technology aimed at finding meaningful information by analyzing recorded event logs and is essential for corporate management in the big data era. Process log analysis can be used for a wide variety of purposes, such as insight into the process, identifying bottlenecks and predicting problems, examining violations of business practices, recommending countermeasures, and simplifying processes [4]. In other words, it is used to extract knowledge necessary for process improvement or design through accumulated records in the process activity execution process. The characteristics of the process performance are analyzed through the existing statistical techniques, artificial intelligence techniques, and social network techniques to derive the process model, such as the correlation of tasks and the relationships among workers [5].
Process mining can be represented as three main types, as shown in Figure 2. First, process discovery involves creating a process model based on event logs in the management system. Second, conformity checking of the process model involves checking the reliability of the process model by comparing the event log generated in the existing model with the newly derived process model. Third, the improvement of the process model (enhancement) is for evaluating and improving the process model by evaluating the process identified by the event log [5].

Principal concept of process mining
2.2 Process Mining Research Trends and Cases
Research related to process mining is being conducted most actively in Europe, and much research is also being conducted in the Republic of Korea, Australia, and China. In the case of the Republic of Korea, the interest of companies such as Samsung Electronics and Hyundai Heavy Industries is increasing, and considerable related research is being conducted by research institutes and universities.

Process mining application project
In the domestic shipbuilding industry, an event log analysis of big data recorded in a business processing system, such as an ERP (Enterprise Resource Planning) system, was conducted to identify where bottlenecks occurred in the process, and the process was improved to reduce costs significantly. In addition, research has been conducted on the manufacturing method of piping materials and improving the ship block assembly process. The focus in process mining is gradually shifting toward discovering and solving problems based on the discovered process model, and a methodology is being developed to predict the outcome and future of the process [6].
3. Explosion-Proof Inspection Process Analysis
3.1 Explosion-Proof Inspection Overview
The purpose of the offshore plant project in this study is to expand the existing oil refinery facility and to increase the daily output to 260,000 barrels. For the entire project, 81 modules are being constructed in South Korea and settled on site in Kazakhstan after being moved to the country of installation by barge. In transit, if it cannot pass through a canal because of the size of the module, it is de-stacked in Korea according to the specified standard and moved to the country. In Korea, the erection of structures and installation of equipment are the main task, and only the lighting and HVAC (Heat, Ventilation & Air Conditioning) systems are commissioned in Korea.
The facility is designed, manufactured, installed, and commissioned in accordance with international standards and the national laws of the country of installation. Electrical and instrumentation quality inspections are also conducted in accordance with the standards, regulations, and project requirements, as mentioned above. In the case of explosion-proof inspection, it is conducted separately from the inspection of electricity and instrumentation, and it is required for all electrical equipment installed in explosion hazardous areas according to IEC 60079.17 [7]. Regarding the inspection procedure, although it is not documented generally, most offshore plants should perform an explosion-proof inspection once all associated electrical/instrument inspections have been completed. Therefore, the explosion-proof inspection is considered the last step before powering the equipment.
According to the quality management process, a production team issues a NOI (Notification of Inspection) for equipment and cable inspection after equipment and cables associated with the equipment are installed according to the schedule of the production process. Then, quality inspectors verify that the installation has complied with the requirements by means of an individual QVD (Quality Verification Document), as defined in Table 2. The contractor calls for an explosion-proof inspection after all associated quality QVDs are complete. For example, if the device has four cables, the contractor confirms the cable inspection completion by using the quality management system and updates the result separately on blueprints or plans. After equipment inspection by the quality team is complete, the result is updated on the same blueprints or plans. Once the completion of all associated inspections is confirmed with the same blueprints or plans, the equipment is recognized as ready for explosion-proof inspection. An explosion-proof inspection is called for by the contractor through the quality management system.
QVD definition
The result of the explosion-proof inspection is updated in the quality management system by the explosion-proof QVD, which is a checklist for verification of compliance. The detailed information in the QVD is recorded to the Ex register. If a defect is found during the explosion-proof inspection, the result is determined as “Accept” or “Reject,” depending on the degree of seriousness. If the degree of defects has a significant impact on the operation of the equipment, the QVD is not complete, and the quality team or the relevant team is informed. The related QVDs completed by the quality team are reset in the system. The inspection is performed again from the beginning. Explosion-proof technology (Ex details), Hazardous Area Classification Grade, and various reference documents are recorded in ECS-064-A (QVD #14), and these are also saved in an electronic file (Ex register) to manage the information of Ex equipment once an inspection is complete.
As described above, all electrical equipment installed in the hazardous area requires an explosion-proof inspection according to IEC 60079-10. In this facility, there are two different cases: performed by the owner or performed by the contractor. In this study, only the explosion-proof inspection conducted by the contractor is analyzed because the scope of the owner was completed at the vendor factory. The scope of the contractor is also divided into two different cases depending on who supplies the equipment.
As a first step, the contractor checks whether equipment requires an explosion-proof inspection according to the Hazardous Area Classification and then confirms that ECS-064-A (QVD #14) is generated in the quality management system. The construction workers of the contractor monitor equipment installation in compliance with IEC 60079-14, and the quality team requests the inspection by means of an NOI when the explosion-proof inspection is ready when all associated QVDs are complete. Then, the explosion-proof inspection is carried out by a qualified inspector with an explosion-proof QVD.
In this case, equipment is supplied by the company, and the associated cable is installed by the contactor. In general, explosion-proof inspection is completed by the company prior to installation on the module, even if all cables connected to equipment are incomplete. The inspection is required again once the installation of all cables is complete. It is performed by the contractor. The inspection process is the same as the method mentioned in Section 3.1.1.
3.2 Data Collection and Analysis
In this study, event log data for process mining analysis was extracted from the project quality management system. The data preprocessing for use in the process mining step was performed by the QVDs that must be completed in advance to perform the explosion-proof inspection. Among the 4755 QVDs registered in the applied module, only 1362 QVDs were extracted as event logs. As an analysis tool to derive the process model, the Disco program developed by the Fluxicon process mining software company was used.
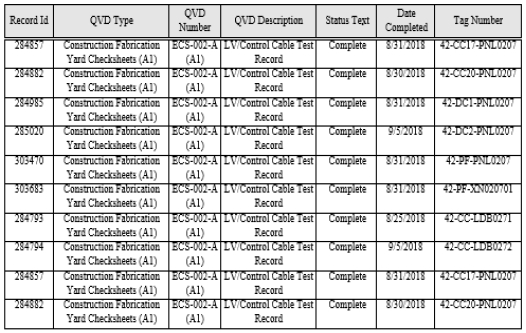
The event log is organized in Disco, a process mining analysis program, by classifying it with Case ID, Activity, and Time Stamp (Table 3).
Application to process mining analysis tool
Case ID is a unique tag number of each device. Activity shows the event in progress, and the separate QVD number is assigned to each activity. Time Stamp is the date when the QVD is completed and updated in the quality management system. This study analyzes the frequency of each case and the delay time of how long it takes for the ECS-064-A (QVD #14) to be executed after the previous QVD is finished, as a result of the process mining. In the case of delay time, a median duration value is selected for analysis because the median duration is less sensitive to extreme values than the mean. In Figure 3, which shows how often each case occurs, it is confirmed that there are nine cases as the prerequisite QVD for ECS-064-A (QVD #14). The median delay in days for each case is shown in Figure 4. A larger number of cases is indicated by darker lines. Table 4 shows the frequency and delay in days as a table for comparative analysis of individual cases. The relative frequency value confirms the importance of each case in the process. For the delay days, in addition to the median applied to the analysis, the mean duration and the maximum delay day are shown for reference.

Absolute frequency by type of QVD

Delay in days by QVD (median duration)
Activity statistics from DISCO (process mining tool)
After the ICS-016-A (QVD #13), 254 cases of the ECS-064-A (QVD #14) accounted for 37.3% of the total and the delay time until the explosion-proof inspection was confirmed to be four days based on the median duration. After ECS-002-A (QVD #12), 246 cases of explosion-proof QVD accounted for 36.1% of the total, which is the highest frequency after ICS-016-A (QVD #13), and the median duration has a relatively long delay of 13 days.
3.3 Analysis of Current Process
According to the results in Table 4, an unexpected delay in days was found for explosion-proof inspection from the time for confirmation of the prerequisite QVD and identification of explosion-proof inspection being ready as a result of “brainstorming” with the personnel in charge of the inspection of bottlenecks. In the general inspection application, individual departments apply for inspection based on the results of the production process management system. In the case of explosion-proof inspection, however, the system does not determine whether an inspection is possible. Currently, it is done in a manual manner managed by each separate spreadsheet. Therefore, it takes a time to determine whether explosion-proof inspection is ready to proceed because of the absence of an automated explosion-proof inspection confirmation program.
4. Proposal for Improvement
4.1 Proposed Method
To rectify this problem, it is necessary to improve process management through a new explosion-proof inspection notification algorithm instead of the existing manual method. Figure 5 is a flow chart from the electric and instrument quality inspection, which is the preliminary step of the explosion-proof inspection in the offshore plant to be analyzed in this study. It shows where the proposed algorithm is applied in the process. To apply the proposed explosion-proof inspection notification algorithm, the equipment for which explosion-proof inspection is required according to the hazardous area classification drawing is listed. The list of QVDs that must precede explosion-proof inspection of each piece of equipment is organized. As input value, the status of QVD from the quality management system is used (Table 5).

Ex inspection flow chart
Example of event log (status of QVD)
The daily explosion-proof inspection results are used as the input value of the algorithm as well as for the purpose of monitoring the re-inspection because of cancellation and rejection. The algorithm is designed as a flow chart, as shown in Figure 6, and it is triggered and shown as YES at the section of Ready for Ex by a tag in the system when all prerequisite QVDs for explosion-proof QVD are complete. Then, the recognized tag is input to the system to issue an NOI application.

Algorithm flow chart
4.2 Evaluation of Proposed Method
The algorithm proposed in this study has been applied to two modules. The first module is the result of 10 months (1736 activities) from July 9, 2018, to April 3, 2019, and the second module is from April 19, 2019, to July 3, 2019, for four months (834 activities).

Absolute frequency by QVD for A Module

Delay in days by QVD for A Module

Absolute frequency by QVD for B Module

Delay in days by QVD for B Module
After the proposed algorithm was applied, it was confirmed that most cases demonstrated a great improvement. As shown in Table 6, for case ECS-002-A (QVD #12), the largest frequency was more than 36% in both modules. The delay was shortened from 13 d at an unapplied module to two days at the A Module. For the B Module, it was reduced by eight days to five days.
Comparison of delay in days between un-applied and applied modules

Comparison delay in days by modules
Case ICL-004H (QVD #3), which had the longest delay of 15 d, also achieved a more than 11d reduction. Although ICS-016-A (QVD #13), which was the second most frequent, did not improve remarkably — from four days to three days for the A Module and two days for the B Module —the overall process was improved by a reduced delay time. However, for ECS-040-A (QVD #6), it was estimated that the days increased to three days from two days at the A Module, and the B Module had the same delay in days. In the case of ICS-013-A (QVD #5), there was no improvement for either module. It was found that the unpredicted delay was caused by an issue about the certificate of being explosion proof at the instrument junction box supplied with packages. ICL-014A (QVD #2) also did not show improvement, but this did not significantly affect the process because the percentage of the entire process was less than 1%. This will be researched again to identify whether there is an unidentified reason for the lack of enhancement.
As a result, the A Module had an improvement of 4.38 d, and that of the B module was 3.38 d compared with an unapplied module.
5. Conclusion
In this study, the problem of process delay was examined by applying process mining, which was previously used for the analysis of ship block movement and the piping system manufacturing process, to the offshore plant explosion-proof inspection process. When the proposed algorithm was applied, the average delay days, considering all cases, were reduced from 6.94 d to 2.56 d for the A Module and 3.56 d for the B Module — a 63% improvement for the A Module and a 48% improvement for the B Module. The highest reduction was 11 d.
This method is expected to save personnel costs and the materials needed for the manual method, as well as improve process delay.
This process analysis using process mining can be applied not only to explosion-proof inspection, but also to other disciplines. This can greatly improve the overall process of offshore plants. Based on the proposed algorithm, the next study planned will address the introduction of an electronic inspection system with ICT (Information and Communications Technologies) that can be checked in real time and without the need for paper inspection.
Author Contributions
Conceptualization, Z. M. Kim; methodology, D. E. Kim; Software, Z. M. Kim; Formal Analysis, Z. M. Kim; Investigation, D. E. Kim and Z. M. Kim; Resources, Z. M. Kim; Data cura-tion , D. E. Kim ; Writing-Original Draft Preparation, Z. M. Kim; Writing-Review & Editing, S. G. Lee & Y. S. Kim ; Visualization, Z. M. Kim; Supervision, Y. S. Kim ; Project Administration, Y. S. Kim ; Funding Acquisition, All Authors.
References
-
J. G. Park and J. H. Woo, “A study on process management method of offshore plant piping material,” Journal of the Society of Naval Architects of Korea, vol. 55, no. 2, pp. 124-135, 2018 (in Korean).
[https://doi.org/10.3744/SNAK.2018.55.2.124]

-
B. J. Kim, Y. C. Ha, and J. K. Seo, “A research on the verification test procedure for quantitative explosion risk assessment and management of offshore installations,” Journal of the Society of Naval Architects of Korea, vol. 55, no. 3, pp. 215-221, 2018 (in Korean).
[https://doi.org/10.3744/SNAK.2018.55.3.215]
- B. K. Oh, A Study on Fire Risk Assessment on Offshore Platform Topsides: Fire Frequency Analysis,” M. S. Thesis, Department of Naval Architecture and Ocean Engineering, Pusan National University, Korea, 2010 (in Korean).
- Trends in Process Mining Technology for Big Data Analysis, No.62, Korea Communications Agency, Korea, 2014 (in Korean).
- D. H. Lee, Analysis of Production Process in Shipbuilding Industry using Process Mining, Ph. D. Dissertation, Department of Industrial Engineering, Pusan National University, Korea, 2014 (in Korean).
- H. R. Bae, “Big Data Analysis Trends and Cases of Production Operations Using Process Mining,” Korean Institute of Industrial Engineers, Vol. 22, No. 2, pp. 36~42, 2015 (in Korean).
- “IEC 60079,” International Electrotechnical Commission, Switzerland, IEC 60079-17, 2013.11