Intermediate die profile design for high-precision production of rectangular stainless-steel bars via new tandem drawing process
1M. S., Precision Manufacturing Systems Division, Pusan National University, Tel: 070-5066-3760 dlawjd417@pusan.ac.kr2Researcher, Division of Marine Engineering, Korea Maritime & Ocean University, Tel: 051-410-4263 marin_tek@kmou.ac.kr
3Director, R&D Center, RHINOX CO., LTD., Tel: 070-5066-3760 parkh123@naver.com
4CEO, RHINOX CO., LTD., Tel: 070-5066-3760 seonkyu7@nate.com
Copyright ⓒ The Korean Society of Marine Engineering
This is an Open Access article distributed under the terms of the Creative Commons Attribution Non-Commercial License (http://creativecommons.org/licenses/by-nc/3.0), which permits unrestricted non-commercial use, distribution, and reproduction in any medium, provided the original work is properly cited.
Abstract
Metal bars with a rectangular cross-section are typically produced via a multi-stage drawing process involving only converging dies. Recently, a new tandem drawing process, in which an intermediate roll-die and a converging die are arranged in tandem, has gained attention owing to its lower production costs when compared to those of the conventional process. In this study, an optimized shape of intermediate roll-dies for the tandem drawing process is proposed to produce rectangular cross-section stainless steel bars with high precision. To decrease the unfilled space at the corners of the bars during the final converging die drawing process, the shapes of the intermediate roll-dies were designed on the basis of the virtual die method and the die offset for the corner filling method. Their corner filling performances and deformation behavior were compared using finite element analysis. The results show that a reverse local offset along the flat part of the intermediate roll-die facilitates better corner filling, more uniform plastic deformation, and lesser damage susceptibility during the final converging die drawing process.
Keywords:
Tandem Drawing Process, Intermediate Roll-die Profile, Cross-sectional Shape, Virtual Die Method, Die Offset for Corner Filling Method1. Introduction
In general, rectangular cross-section stainless steel bars are manufactured through multi-staged drawing processes. These processes include several drawing steps to produce the final product with the required shape and annealing between the drawing steps to recover the ductility of the workpiece for greater reduction in area. The annealing process is highly energy- and time-consuming; therefore, extensive efforts have been made to eliminate annealing during drawing processes.
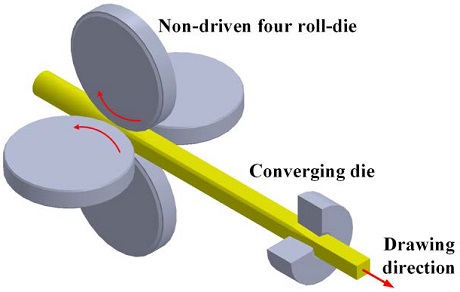
A new tandem drawing process has recently been introduced as an annealing-free drawing process for the production of metal bars with rectangular cross-sections [1][2]. The process involves a non-driven roll die and a tandemly arranged converging die, as shown in Figure 1. To begin with, the initially round bar passes through the die consisting of four non-driven rolls, which gives rise to a bar with a roughly rectangular cross-section. At this stage, and due to the lower force exerted by the non-driven roll-die, bars with lower cross-section reduction ratio can be achieved compared with those obtained by the converging die drawing process [1]. In addition, the back tension caused by the roll-die reduces the pressure and friction between the die and the workpiece during the second converging die drawing process. These effects of the drawing force reduction make it possible to omit annealing, which is indispensable for conventional multi-stage drawing processes.
Extensive scientific research has been performed to design a cost-effective and highly accurate multi-staged drawing process. For a rectangular-shape drawing process, Kim et al. [3] designed an intermediate die profile using the virtual die method connecting the shapes of the initial material and the final product. Ji et al. [4] applied the electric field analysis method to the multi-pass drawing of wire with the asymmetric trapezoid profiles and proposed a design method to reduce the local strain concentration by modifying the intermediate die profile. To prevent generation of unfilled defects after a shape drawing process, Park et al. [5] proposed the die offset for corner filling (DOCF) method for the design of the intermediate drawing-die shape, whereby the radial velocity distribution is controlled during the final drawing.
Although new tandem drawing process have been reported in the scientific literature, previous research focuses on the prediction of the drawing force. Kim et al. [1] compared the drawing forces of their new annealing-free tandem drawing process and a conventional multi-converging die drawing process using the modified A. Geleji’s equation [6][7] and the finite element (FE) method. The results thereof show that lower drawing forces can be achieved via the roll-die drawing process. Consequently, the new process guarantees a higher cross-section area reduction when compared with the conventional process. Cho [8] suggested a shape function of the upper bound analysis of a non-driven roll-die shape drawing process and verified its effectiveness to predict the drawing force using the FE method. To the best of the authors’ knowledge, research studies focused on the design of dies from shape accuracy of the final product standpoint are not available in the scientific literature.
This study focuses on the design methodology of the shape of the intermediate die used in the roll-die of the new tandem drawing process to improve the shape accuracy of the final product after the whole drawing process. Two types of the roll-die profiles were modeled via the virtual die and DOCF methods. Deformation, performance, and shape accuracy of the final bar were evaluated using FE analysis.
2. Materials and Design Methodology
2.1 Initial material and final product shape and dimensions
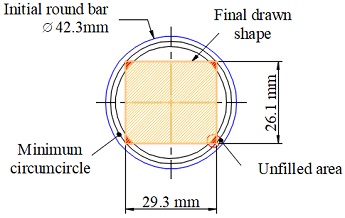
The shape and dimensions of the initial material and the final product used in this study are shown in Figure 2.
The required final product was a bar with rectangular cross-section of 29.3 × 26.1 mm. The initial material used was a 42.3 mm diameter bar, which was determined by offsetting 3 mm from the circumscribed circle by the final product to prevent unfilled corners. The total initial-area-to-final-area ratio (reduction ratio) was 45.6% and the reduction ratio by each roll-die and converging die pass were equal to 26.2%.
2.2 Design of intermediate roll-die profile
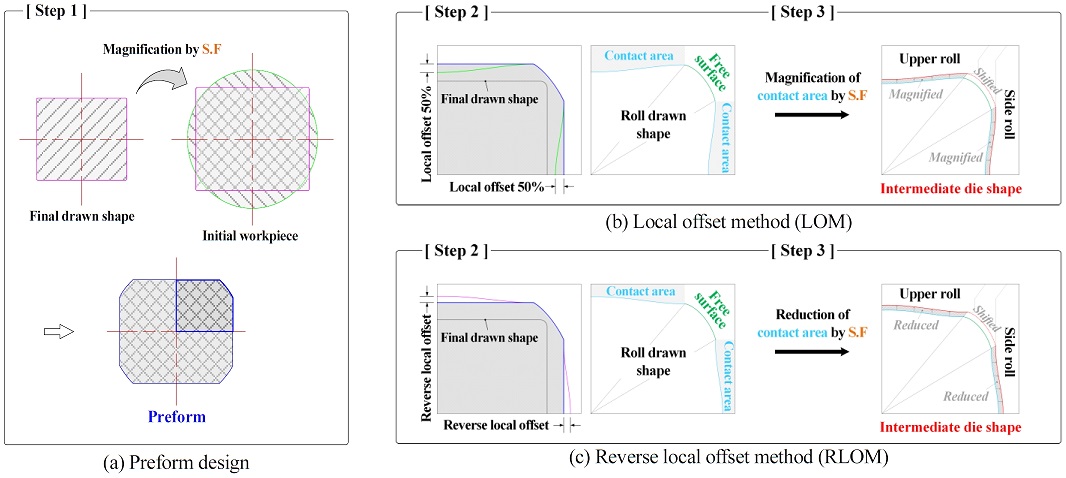
Our proposed method for the design of the intermediate die profile mainly involves two phases; the construction of a preform using the virtual die method and the application of a local offset to the preform on the basis of DOCF method. The following steps were involved:
-
 Step 1. The shape of the final product was enlarged using a scale factor to induce uniform deformation of the material. Then, the center of the enlarged final and the initial shapes were aligned, and the overlapped region was determined as the preform.
-
 Step 2. The shape of the preform was modified by applying a local offset to its flat parts to minimize the difference of the radial flow velocity and the plastic strain between the corners and at the flat parts of the workpiece.
-
 Step 3. Finally, the transformed shape was magnified using the scale factor to have an equal cross-section reduction ratio.
In general, the intermediate die shape should be similar to the final shape to make the local reduction ratio uniform and result in a decrease of the drawing force during the final drawing and an increase of the dimensional accuracy of the final product. In this study, the preform, whose shape was as similar to that of the final product as possible, was constructed as a basis of the intermediate die shape via the virtual die method, as shown in Figure 3 (a).
First, the enlarged shape of the final product was considered using a scale factor. The scale factor was a function of the areas of the initial material, and the final product calculated based on the schedule-pass of equal reduction area, as shown in Equation (1).
| (1) |
where, Ai is the area of i-th pass, and γ is the reduction ratio of the pass. Then, the center of the enlarged final shape by S.F. was aligned with that of the initial shape. Finally, the overlapped region was determined as the preform for the intermediate die shape of our process.
It was necessary to control the material flow to prevent unfilled regions at the corners of the rectangular cross-section of the final product, in particular, it was crucial to control the flow along the radial direction of the workpiece (i.e., the flow from the edge to the center) during the final drawing process. When the workpiece was in contact with the die, the direction of the material flow within the workpiece was determined by the deformation distance between the initial and the final points of the workpiece-die. Since the workpiece was a continuum, the flow velocity increased with increasing deformation distance. As a result, the likelihood of unfilled defects in the region where the smallest deformation distance occurs increased. In this study, unfilled defect was most likely to occur at the corner of the rectangular cross-section of the final product.
To improve the corner filling of the product, the preform needs to be modified by introducing a local offset so that more material can be involved to fill the corners during the 1st and 2nd drawing passes. Based on this idea, Park et al. [5] applied the DOCF method to design the shape of the intermediate die for a shape drawing process by expanding the corners of the workpiece.
Since the corners of the workpiece remain a free surface during the tandem roll-die drawing process, it is impossible to apply a local offset expanding the corner like the original DOCF method. Therefore, a modified method applying a local offset to the flat parts of the preform instead of the corners was introduced, leading to higher plastic deformation values at the corners during the 2nd converging die drawing. This design method was called as the local offset method (LOM).
By using the LOM, the flat parts of the preform were transformed into concavely curved parts, as shown in Figure 3 (b). The amount of local offset was 50% of the width between the flat parts of the preform and the final shape. Since the area of the transformed shape varies according to the amount of the local offset applied using the LOM, the reduction ratio varies from that of the initial preform. Therefore, the transformed shape was finally magnified using the scale factor to achieve the desired area reduction ratio.
Although the LOM was expected to reduce the difference in the radial-direction of metal flow between the flat parts and the corners of the workpiece during the converging die drawing, it can increase the free surface during the roll-die drawing process affecting shape accuracy by discontinuous deformation. Therefore, another intermediate shape was designed to minimize the free surface area and to increase uniform deformation during the roll-die drawing process. As shown in Figure 3 (c), the flat parts of the preform become convex-shaped once the local offset was set in the opposite direction to that of LOM method. This process was called the reverse local offset method (RLOM).
3. Validation of the intermediate roll-die profile design method
3.1 Conditions of the FE analysis
Three-dimensional (3D) FE analysis was performed to assess the effectiveness of the proposed intermediate die shape design methods for the new tandem drawing process using the commercial FE analysis software DEFORM-3D [9]-[11]. High-purity 316L stainless steel was considered as the workpiece in the FE analysis. The workpiece was manufactured through a two-step vacuum induction melting and vacuum arc re-melting process [12]. The flow stress-strain curves of the workpiece were obtained from a tensile test and were expressed by Equation (2).
| (2) |
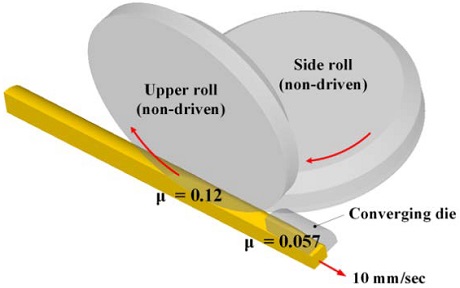
Figure 4 shows the 3D model used for the FE analysis of the new tandem drawing process. Only one-quarter of the entire structure was modeled due to the symmetry of the shape of the final product. The total number of the elements used in the analysis was 182,344. The workpiece was placed to pass through the roll-die, and the converging die continuously, and the length of the initial workpiece was 250 mm. Friction coefficients of 0.12 and 0.057 were applied to the roll-die and converging die, respectively [13]. The half-angle of the converging die was 9°, and the drawing speed was set to 10 mm/s.
3.2 Results of the FE analysis
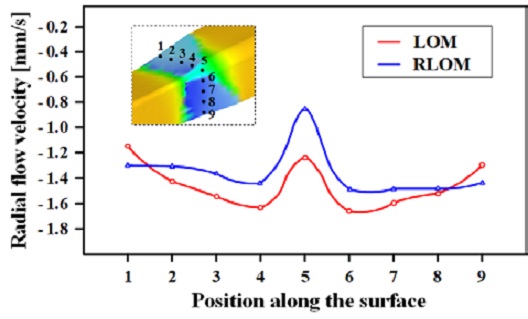
Figure 5 shows the distribution of the radial flow velocities on the cross-section of the workpiece during the 2nd converging die drawing process. Figure 6 shows the measured radial flow velocities along the outer surface. The unfilled corners after the 2nd converging die drawing were closely related to the metal flow along the radial direction, which is the direction from the center to the outer surface [5].
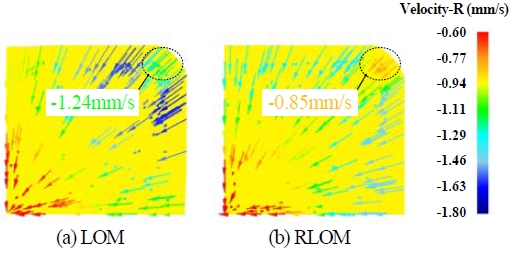
Distribution of radial flow velocity during 2nd converging drawing processes designed via (a) local offset method (LOM) and (b) reverse local offset method (RLOM)
If the radial flow velocity at a specific position of the outer surface is higher than in other positions, a material sink is likely to be formed at that point. In the process designed via the LOM, the difference between the minimum and maximum radial flow velocities was 0.52 mm/s, which indicated as expected that the radial velocity distribution observed by the LOM was more uniform than the one observed for the RLOM (0.64 mm/s). However, the radial flow velocity of the corners of the workpiece in the process designed via the LOM was approximately 45% higher (~ -0.85 mm/s) than that of the RLOM (~ -1.24 mm/s).
These results can be attributed to the difference of free surface area between the two processes during the 1st roll-die drawing. Since the region near the free surface is relatively soft due to little work-hardening during the roll-die drawing, the region has a relatively high radial flow velocity, and easily extends by the axial drawing force and the back tension. Therefore, the process designed via the LOM, where larger free surface area forms during the roll-die drawing, leads to higher radial flow velocity along the corner.
Before the two designed processes were compared in terms of corner filling, the behavior of plastic deformation was analyzed. Figure 7 shows the effective strain distributions during the processes designed via the two methods. The process designed via the RLOM showed a more uniform strain distribution than the LOM after the 1st roll-die drawing. The process designed via the LOM caused significant deformation at the flat parts. The effective strain distributions after 2nd converging die drawing showed a similar tendency compared to those after the 1st roll-die drawing. The process designed via the LOM led to higher plastic deformation at the flat parts than the one designed via the RLOM.
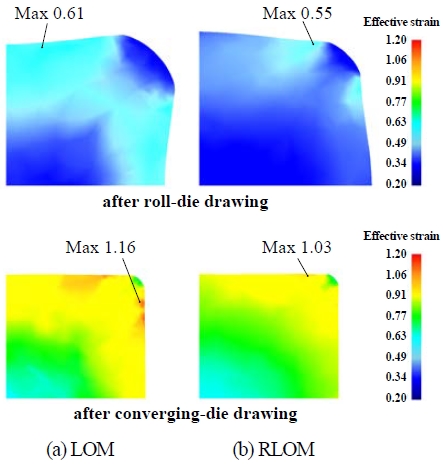
Effective strain distributions for the processes designed via (a) local offset method (LOM) and (b) reverse local offset method (RLOM
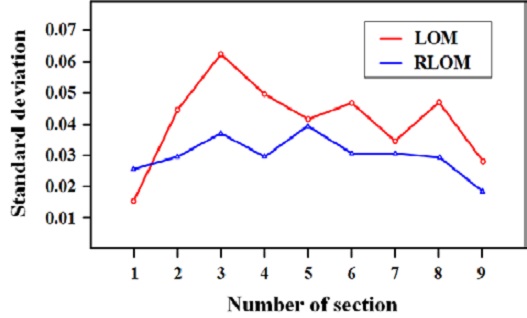
The standard deviations of plastic strain (SDP) were calculated using Equation (3) for the quantitative evaluation of the strain uniformity after the 2nd converging die drawing [4].
| (3) |
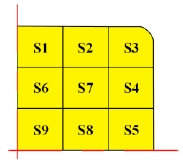
εi,S is the effective strain at node i in the FE analysis, εavg,S is the average effective strain of section S, and i and N are the node number and the total number of nodes in section S, respectively. In this study, the cross-section of the FE model was divided into nine sections (S= 1~9) and the average effective strain was calculated by extracting the strains of 50 nodes (i= 1~50, N= 50) after the final pass (Figure 8). As a result of the SDP analysis for the two processes, it was confirmed that the process designed via the RLOM resulted in a more homogeneous effective strain distribution within the final product, and the corner region (S3) for the process designed via the LOM had the highest SDP.
Figure 10 shows the changes of the cross-sectional shape of the workpiece during the two new tandem drawing process designed via the LOM and RLOM. The concave offset of the LOM increased the size of the free surface during the roll-die drawing because the transformed shape was magnified after applying the offset (Figure 3 (b)). On the other hand, the convex offset of the RLOM led to a smaller size of the free surface because the shape was reduced (Figure 3 (c)). Therefore, the free surface area of for the process designed via the LOM was larger than the one designed via the RLOM during the roll-die drawing.
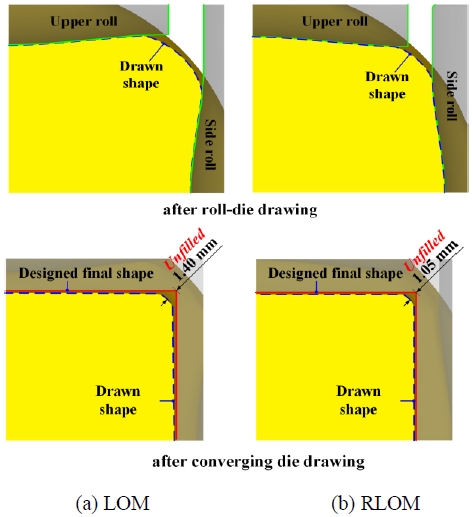
Cross-sectional shapes for the processes designed via (a) local offset method (LOM) and (b) reverse local offset method (RLOM)
After the final converging die drawing, the size of the unfilled region at the corner, i.e., the diagonal distance between the drawn shape, and the die shape at the corner, was 1.40 mm for the process designed via the LOM and 1.05mm for the process designed via the RLOM.
These results clearly show that the size of the free surface during roll-die drawing, which was determined by the design method (LOM/RLOM), plays an important role in the corner filling during converging die drawing in the new tandem drawing process. Smaller free surface area during roll-die drawing for the RLOM led to smaller unfilled areas. Larger free surface area during the roll-die drawing led to relatively easy plastic deformation, caused by less work-hardening and higher radial flow velocity toward the center at the corner during the converging die drawing. Consequently, a larger unfilled area in the final product was observed. Additionally, the uniformity of the plastic strain, as well as of the radial velocity, is thought to influence the characteristics of the corner filling.
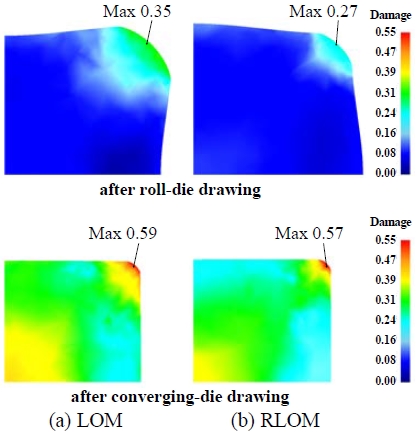
As an indicator of the reliability of the proposed processes, the damage factor was calculated on the basis of the normalized Cockroft–Latham model. As shown in Figure 11, the bar through the process designed via the LOM showed higher damage factor at the corner than the one designed via the RLOM, after both the intermediate roll-die drawing and the final converging die drawing. This is because the intermediate die shape by LOM gave rise to a wider free surface near the corner than the one designed via the RLOM. Since the free surface has no contact with the die, tensile stress dominantly exists near the free surface region during the process. Tensile stress plays a key role in the propagation of internal cracks of the material, and therefore the damage factor. Consequently, it is thought that the accumulated damage near the corner region within the free surface during the roll die drawing results in higher damage factor at the corner after the final drawing.
4. Conclusion
Design methods to optimize the intermediate roll-die shape were investigated to produce rectangular cross-section metal bars with highly accurate dimensions by a new tandem drawing process. The following conclusions were drawn from the results of this work.
- (1) The LOM and RLOM were devised by the construction of a preform using the virtual die method and the application of a local offset to the flat parts of the preform based on the DOCF method.
- (2) The process designed via the LOM, where larger free surface area forms during the roll-die drawing, led to higher radial flow velocity at the corner than the one designed via the RLOM. The process designed via the RLOM resulted in a more homogeneous effective strain distribution within the final product, while the corner area of the process designed via the LOM showed the highest standard deviation of plastic deformation.
- (3) The process designed via the RLOM shoed higher corner filling performance than the designed via the LOM. This is because the RLOM led to a more uniform effective strain and lower radial flow velocity at the corner than the LOM. These differences in the corner filling performance and deformation behavior between the two methods can be attributed to the difference in free surface size during the roll-die drawing.
Acknowledgments
This research is the result of the Technology Development Project through Collaboration of Industries, Universities and R&D Institutes conducted with the support of the Ministry of SMEs and Startups. This research was also conducted through the Civil-Military Technology Cooperation Program supported by the Institute of Civil Military Technology Cooperation.
Author Contributions
Conceptualization, All Authors; Methodology, K. H. Lee, I. J. Cheon and S. C. Park; Software, S. C. Park; Formal Analysis, I. J. Cheon, S. C. Park and H. Park; Investigation, I. J. Cheon and H. Park; Resources, All Authors; Data curation I. J. Cheon and S. C. Park; Writing-Original Draft Preparation, I. J. Cheon; Writing-Review & Editing, H. Park and K. H. Lee; Visualization, I. J. Cheon; Supervision, K. H. Lee; Project Administration, K. H. Lee and S. K. Hong; Funding Acquisition, K. H. Lee and S. K. Hong.
References
-
J. H. Kim, D. C. Ko, and B. M. Kim, “New tandem drawing process through non-driven four roll-die and converging die,” Journal of Materials Processing Technology, vol. 263, pp. 470-478, 2019.
[https://doi.org/10.1016/j.jmatprotec.2018.08.016]

- S. K. Hong, Study on Multi Shape Drawing Process for Drawing Force Reduction and Productivity Improvement, M. S. Thesis, Advanced Precision Engineering Cooperation Course, Pusan National University, Republic of Korea, 2017 (in Korean).
- Y. C. Kim, D. J. Kim, and B. M. Kim, “Intermediate die design system for the multi-stage drawing process,” Transactions of NAMRI/SME, vol. 28, pp. 69-74, 2000.
-
S. I. Ji, K. H. Lee, L. S. Hong, J. Y. Jung, J. S. Kim, and B. M. Kim, “Process design of multi-pass shape drawing of wire with asymmetric trapezoid profiles,” Transactions of Materials Processing, vol. 24, no. 3, pp. 187-193, 2015 (in Korean).
[https://doi.org/10.5228/KSTP.24.3.187]

-
J. H. Park, K. H. Lee, S. M. Kim, H. J. Kim, S. J. Kim, and B. M. Kim, “Die design for shape drawing to improve the dimensional accuracy of a hollow LM-guide rail,” Transactions of Materials Processing, vol. 24, no. 5, pp. 340-347, 2015 (in Korean).
[https://doi.org/10.5228/KSTP.24.5.340]

- A. S. Geleji, Bildsame Formgebung der Metalle, Berlin, Germany: Akademie-Verlag, 1967.
-
T. K. Lee, C. J. Lee, S. K. Lee, and B. M. Kim, “Prediction of drawing load in the shape drawing process,” Transactions of Materials Processing, vol. 18, no. 4, pp. 323-328, 2009 (in Korean).
[https://doi.org/10.5228/KSPP.2009.18.4.323]

- Y. H. Cho, Upper Bound Analysis of the Multi-roll Drawing Process Combined with the Undriven 4 Roll-dies, M. S. Thesis, Precision Processing System of Mechanical Engineering Department, Pusan National University, Republic of Korea, 2018.
-
S. J. Lee, K. H. Lee, and B. M. Kim, “Design of roll profile for LM-guide block in horizontal-vertical shape rolling by 3D-EFA,” International Journal of Precision Engineering and Manufacturing, vol. 16, no. 4, pp. 767-773, 2015.
[https://doi.org/10.1007/s12541-015-0101-6]

-
S. J. Lee, K. H. Lee, and B. M. Kim, “Design of roll profile for complex shape in shape rolling by combined 3D-EFA and BWT,” International Journal of Precision Engineering and Manufacturing, vol. 16, no. 2, pp. 281-286, 2015.
[https://doi.org/10.1007/s12541-015-0037-x]

-
H. S. Jung, Roll Design Method using Virtual Flow Line for Multi-Stage Profile Rolling Process, M. S. Thesis, Mechanical Engineering Department, Pusan National University, Republic of Korea, 2018 (in Korean).
[https://doi.org/10.1007/s12206-018-0928-8]

- G. Kienel, A. Chodhury, and H. Kemmer, “Vacuum Melting and remelting Processes,” ASM Handbook, vol. 15, pp. 393-425, 1988.
-
J. H. Kim and B. M. Kim, “A four-roll squeeze pointing machine for a shape-drawing process,” Metals, vol. 8, no. 6, pp. 427, 2018.
[https://doi.org/10.3390/met8060427]


