Evaluation of the pressure-resistance of the intersection of a Membrane-type primary barrier: part 1 experimental study
Copyright ⓒ The Korean Society of Marine Engineering
This is an Open Access article distributed under the terms of the Creative Commons Attribution Non-Commercial License (http://creativecommons.org/licenses/by-nc/3.0), which permits unrestricted non-commercial use, distribution, and reproduction in any medium, provided the original work is properly cited.
Abstract
With the recent trend towards large-sized liquefied natural gas (LNG) carriers, the increased cargo hold size is expected to increase the hydrodynamic load on the LNG and exert a very high compressive load on the outer wall of the primary barrier. In this study, a hydraulic pressure test apparatus was manufactured to simulate the compressive load environment caused by the hydrodynamic load and evaluate the pressure-resistance of the intersection of the corrugations of the primary barrier. The deformation history of the intersection and its cross-sectional geometry were investigated for different test pressures using a three-axis strain gauge and an optical 3D scanner, respectively. The results of the internal pressure test at the intersection confirmed that the region near the wide pressing indentation exhibited greater deformation than the region near the narrow pressing indentation, and that the two regions were deformed in opposite directions.
Keywords:
Liquefied natural gas, Primary barrier, 3-axis strain gauge, Hydraulic test, Optical 3D scanner1. Introduction
Natural gas (NG) is considered an environmentally friendly fuel that generates little pollution during combustion, as sulfur and nitrogen are removed during liquefaction. Liquefied natural gas (LNG), which is typically condensed at a pressure of 0.7 bar or less and a cryogenic temperature of -163 °C, is deemed a practical way to store and transport NG over long distances, as liquification reduces its volume ~600 times compared to the gas state [1]. However, LNG is affected by both translational and rotational ship movements and requires a special insulation system. The area in direct contact with LNG in such cryogenic insulation systems is sealed by a cryogenic metal sheet referred to as the primary barrier [2]. Corrugations are preformed on the primary barrier to address the structural issues associated with the high thermal shrinkage stress due to the absolute temperature difference of ~180 °C between the cryogenic and ambient environments. These corrugations effectively reduce the in-plane stiffness of the thin metal plate, as the corrugated sections deform under thermal shrinkage stress rather than the overall metal plate structure [3]. Recently, 266,000 m3 LNG carriers have been built in an attempt to secure the LNG transportation sector by increasing the cargo size. However, the hydrodynamic load increases with the cargo size, and large cargo holds thus induce very high compressive loads on the outer primary barrier wall [4]. When the compressive load exceeds the yield strength, permanent deformation resulting in structural damage and collapse occurs in the corrugated sections with low in-plane stiffness. Further research is thus needed to improve existing barrier designs.
Several studies have been conducted with the aim of improving the resistance of the primary barrier to compressive loads. Kim et al. [5] and Lee et al. [6] used a corrugated inner aluminum reinforcement structure (pressure resisting structure) and a glass fiber-epoxy composite reinforcement structure (anti-buckling structure), and demonstrated significant increases in pressure resistance in hydraulic pressure tests. However, these studies focused on reinforcement structures that excluded the intersections of the preformed corrugations. These intersections absorb the principal stress induced in the corrugations by thermal shrinkage stress and the dynamic LNG load, and the stress absorption performance depends on the intersection geometry [7].
The intersection-forming process consists principally of a pressing process and a clamping process; in the pressing process, the corrugations for the absorption of the principal stress are created, while the clamping process involves transferring and fixing each thin metal plate of the membrane to the storage tank wall [8]. It is therefore difficult to improve the pressure resistance at the intersection with reinforcing structures due to the geometric constraints imposed by the forming process [9]. In light of this, additional studies, such as geometric deformation studies, are needed to improve the pressure resistance at the intersection. In this study, a hydraulic pressure test apparatus was built to simulate the compressive load induced by the hydrodynamic load, and the pressure resistance of the primary barrier was evaluated in terms of its intersection geometry.
2. Experimental Setup
2.1 Test specimen
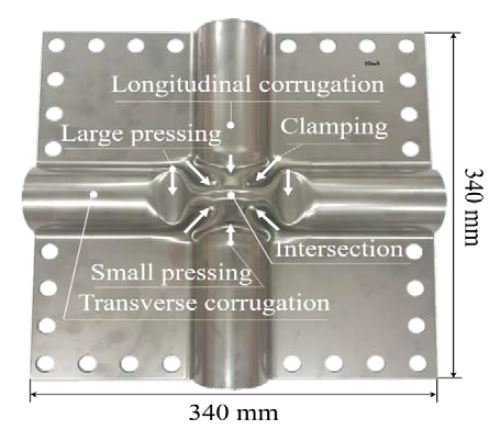
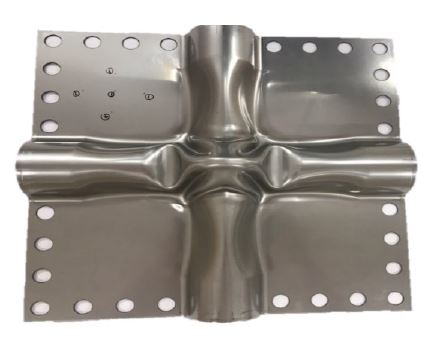
The length and width of the test specimen fabricated in this study were 340 mm (W) and 340 mm (B), respectively, with the intersecting corrugations centered on the specimen as shown in Figure 1. The specimen was fabricated from a cross-corrugated 304L stainless steel (STS304L) plate with a thickness of 1.2 mm (H). At the corrugation intersection, large and small pressing indentations were present along the transverse and longitudinal corrugations, respectively, along with clamping indentations with two lines of symmetry.
2.2 Hydraulic pressure test
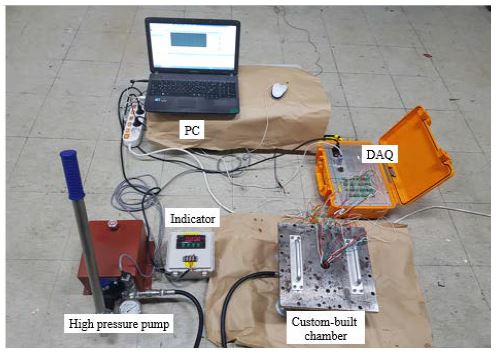
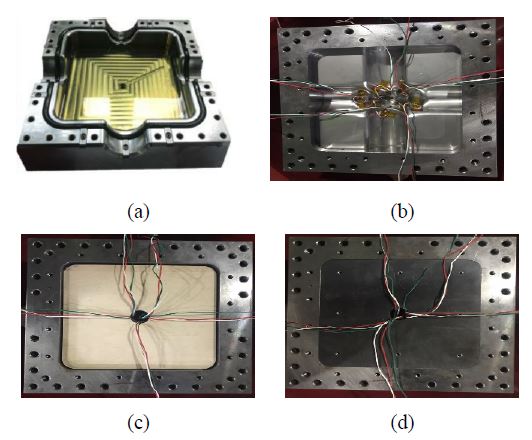
In this study, a hydraulic pressure test apparatus was built to simulate the compressive load induced by the hydrodynamic load during LNG transport. A custom-built chamber accommodated the test specimen. Hydraulic fluid was introduced via an inlet at the bottom of the chamber; the fluid applied a uniform pressure over the entire test specimen. The applied fluid pressure was measured in real time using an indicator. The primary barrier test specimen was placed directly above the chamber and came into direct contact with the hydraulic fluid; laminated plywood was placed between the primary barrier test specimen and the metal lid to simulate the layered structure of membrane-type barriers. Figure 2 depicts the hydraulic pressure apparatus used in this work, and Figure 3 (a)-(d) show the setup process for the hydraulic pressure tests.
2.3 Strain gauge
In this work, three-axis (0°, 45°, and 90°) rosette strain gauges were utilized to measure the principal strain with respect to the hydraulic pressure at the corrugation intersection.
| (1) |
| (2) |
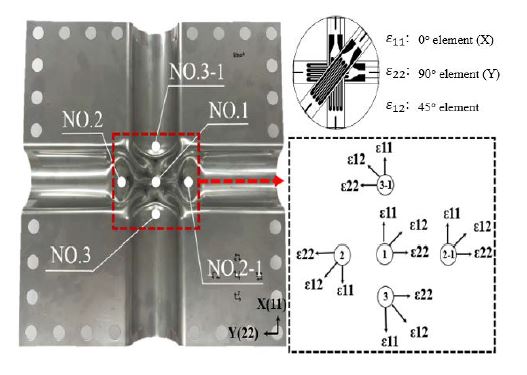
ε11, ε12, ε21 are the 0°, 45°, and 90° strain values calculated using Equation (1) [10], respectively. L is the gauge length in mm, which was 1 mm in this study. R indicates the gauge resistanceΩ , which was 119.6Ω . Δ R represents the change in resistance Δ Ω, and K is the gauge factor. The maximum principal strain was obtained from Equation (2), which was provided by Tokyo Measuring Instrument Laboratory (TML) [10]. The strain gauges were attached at five different locations on the test specimen, but the principal strains measured by the gauges placed symmetrically about the intersection were nearly identical. Therefore, three principal strains were analyzed herein. Figure 4 indicates the locations of the strain gauges on the test specimen.
2.4 Test scenario
The hydraulic pressure range was determined from preliminary experiments performed before the hydraulic pressure test. The initial hydraulic pressure in the preliminary experiments was selected based on the maximum attainable pressure that could be induced by the hydrodynamic load in membrane-type LNG tanks (3.0 MPa) [11]. The test specimens deformed rapidly during each experiment without fracture. Hydraulic fluid pressures of 1.8 MPa, 2.2 MPa, and 2.6 MPa were selected based on the rapid deformation observed at 3.0 MPa. Each case was tested three times to ensure repeatability and reliability, and the results are given as the average of the three test runs. The hydraulic pressure was applied to the test specimen at a constant speed, and the maximum pressure was retained for 3 min. The test specimen was disassembled 3 min after the pressure was relieved and its resilience was analyzed. Since the primary barrier test specimen was fabricated from a thin 304L stainless steel plate, its yield strength and tensile strength increased remarkably in the cryogenic environment [12]. As the structure did not crack under the tested hydraulic pressures, hydraulic pressure tests were also carried out in a roomtemperature environment to conduct a more conservative estimation of the material properties in the absence of the tensile strength enhancement resulting from the low temperature environment [13]. Table 1 lists the pre-test conditions for the primary barrier specimen, and Figure 5 shows a photograph of the specimen after the pre-test. Table 2 summarizes the test conditions for the primary barrier specimen.
3. Experimental Results
3.1 Evaluation of principal strain at the intersection
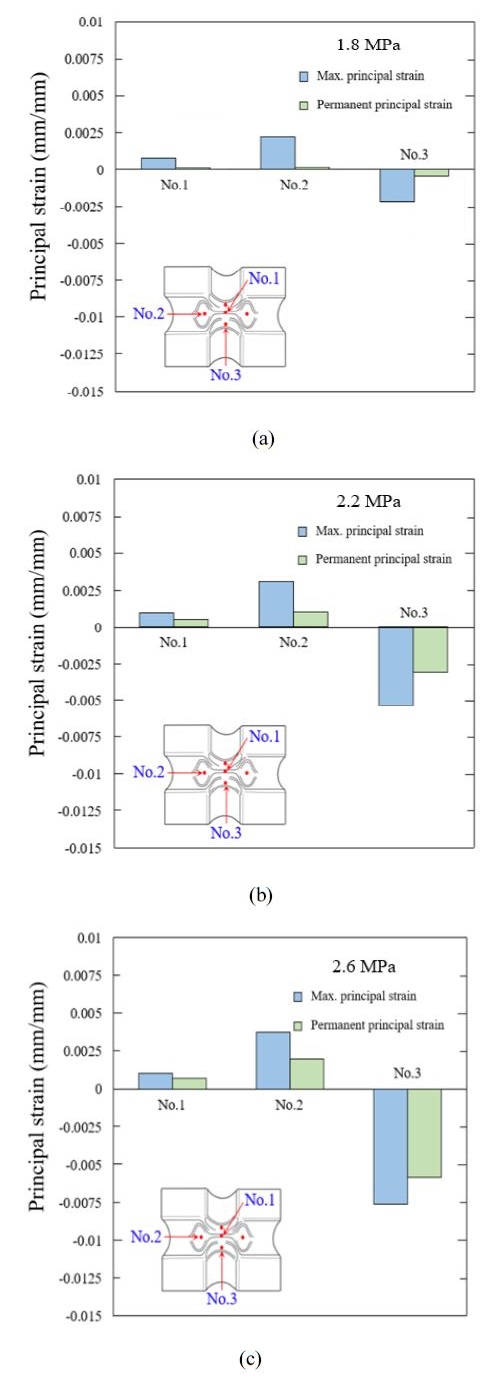
The bar plots in Figure 6 (a)-(c) illustrate the maximum principal strain at each attachment location under hydraulic pressure and the permanent principal strain after pressure relief. Among the principal strain measurement points, point No. 1 at the center of the intersection exhibited the lowest peak and permanent principal strains. Additionally, the strain at this location remained constant when the hydraulic pressure was increased. This behavior was attributed to strain hardening, in which the strength increases significantly due to the phase transition from austenite to martensite during plastic deformation in the initial forming process [8]. Location No. 2 at the large pressing indentation exhibited more deformation than No. 3 at the small pressing indentation. This was attributed to the geometries of the pressing indentations at the intersection. The large pressing indentation has an oblique load-bearing surface, while the load-bearing surface of the small pressing indentation is vertical relative to the hydraulic pressure [9]. Additionally, the principal strain at location No. 2 occurred outward with respect to the intersection (+), whereas that at No. 3 occurred inward (-) relative to the intersection. The large pressing indentation yielded outward, while the small pressing region was deflected inward by the pressure due to its Poisson’s ratio as a vertical support of the intersection [14].
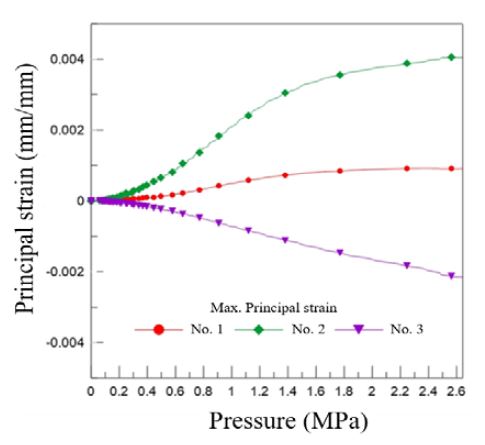
Figure 7 shows the maximum principal strain variation as a function of the hydraulic pressure for the primary barrier test specimen. As shown, location No. 1 at the intersection center experienced relatively little deformation under the tested pressure range. This was attributed to the increased yield strength due to strain hardening during the forming process [8].
The principal strain at the large pressing indentation (No. 2) increased non-linearly as the pressure was increased to 1.8 MPa, after which the slope flattened. The principal strain at the small pressing region (No. 3) increased constantly as the pressure was increased to 1.8 MPa, after which the rate decreased. The reduced rate of increase in the principal strain was attributed to strain hardening after reaching the yield point [5]. These results indicated that the tested corrugation intersection was subjected to a load higher than its yield strength at pressures above 1.8 MPa.
3.2 Analysis of cross-sectional deformation
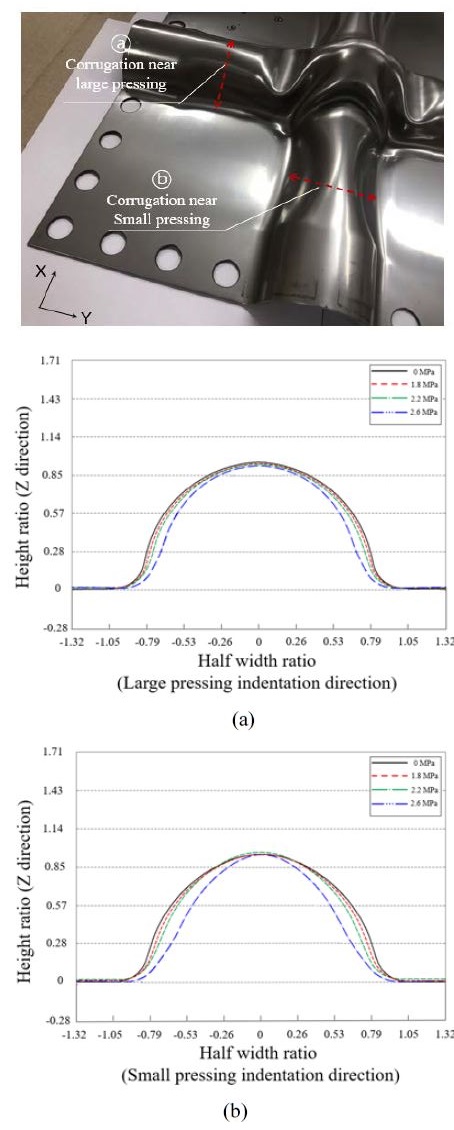
In this study, a 3D optical scanner was used to analyze the changes at various cross-sections of the intersection after the specimen was subjected to different hydraulic pressures. The cross-sections were measured along the centerline of each corrugation and across the corrugations at locations 85 mm away from the center of the symmetric primary barrier intersection.” or “Cross-sections were measured along the centerline of each of the two corrugations; the measurements extended 85 mm from each side of the center of the primary barrier intersection. Figure 8 shows the cross-sections along the primary barrier intersection in each direction with respect to the hydraulic pressure (1.8 MPa, 2.2 MPa, or 2.6 MPa). Figure 8 (a) depicts the cross-section including the large pressing indentation, while Figure 8 (b) represents the cross-section including the narrow pressing indentation. Comparison of the primary barrier intersection cross-sections revealed that structural deformation did not occur within the tested pressure range, but a sudden downward displacement occurred above 2.2 MPa. The rapid displacement without structural deformation was also attributed to strain hardening during the initial plastic deformation process [8].
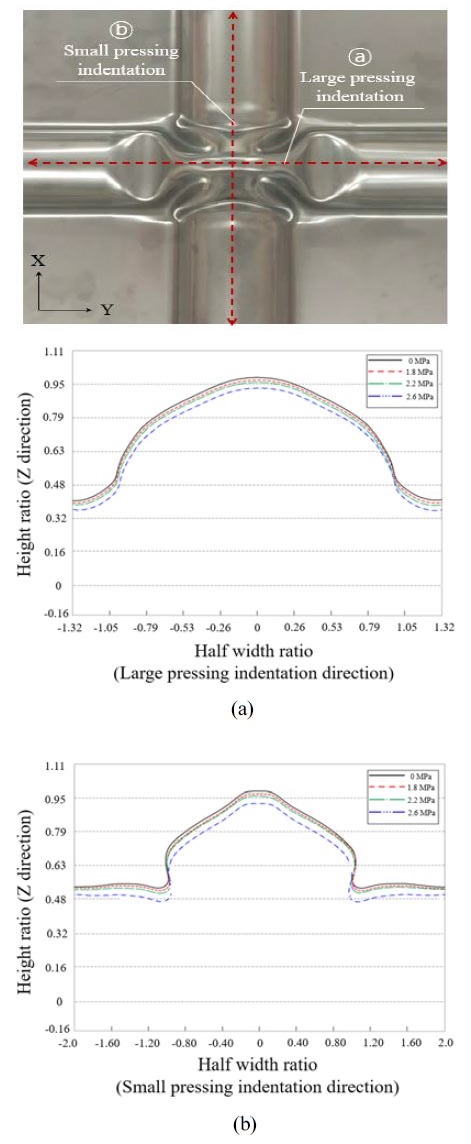
Cross-sections along the intersection showing the deformation of the specimens as a function of hydraulic pressure: (a) Large pressing indentation direction and (b) small pressing indentation direction
4. Conclusion
This study reported the manufacture of an experimental apparatus for hydraulic pressure testing to simulate the compressive load due to the hydrodynamic load at the intersection of the primary barrier. The deformation of the specimen under hydraulic pressure was measured using a three-axis strain gauge, and a 3D optical scanner was employed to analyze the deformation of cross-sections of the test specimen. The results are summarized as follows:
- • Measurements of the principal strain at the intersection under different hydraulic pressures indicated that almost no principal strain was observed at the center of the intersection (No. 1). The lack of strain was attributed to the strain hardening that occurs during plastic deformation in the initial forming process.
- • The gauge attached at the large pressing indentation (No. 2) experienced more deformation than that at the small pressing indentation (No. 3). This was attributed to their geometry; the large pressing indentation has an oblique load-bearing surface, while the small pressing indentation has a vertical load-bearing surface relative to the hydraulic pressure.
- • The principal strain at location No. 2 was oriented outward (+) from the intersection, whereas that at No. 3 was oriented inward (-). This was attributed to the Poisson’s ratio effect when the primary barrier was deflected inward at the small pressing indentation due to the compressive load, which caused deformation in opposite directions at locations No. 2 and No. 3.
- • The maximum principal strain–pressure curves confirmed that the principal strain at locations No. 2 and No. 3 increased non-linearly at pressures up to 1.8 MPa, above which the slope flattened. The rate of increase in the principal strain then decreased due to the strain hardening of the material above its yield point; thus, the tested specimen experienced a load higher than its yield strength above 1.8 MPa.
- • Comparison of the cross-sections obtained using a 3D optical scanner revealed rapid deflection and deformation after 2.2 MPa, indicating that the load-bearing capacity was lost between 2.2 MPa and 2.6 MPa.
Acknowledgments
This material is based upon research supported by, or supported in part by, the National Research Foundation of Korea through the Ministry of Science and ICT in 2018 (Grant No. 2018R1A2B6007403) and a Korea Evaluation Institute of Industrial Technology 2019 research grant (Grant No. 20006644).
Author Contributions
Conceptualization, Y. J. Jeong; Methodology, Y. J. Jeong and J. M. Choi; Software, Y. J. Jeong and J. M. Choi; Formal Analysis, Y. J. Jeong; Investigation, Y. J. Jeong and J. M. Choi; Resources, Y. J. Jeong; Data curation; Y. J. Jeong; Writing-Original Draft Preparation, Y. J. Jeong; Writing-Review & Editing, M. S. Kim; Visualization, Y. J. Jeong; Supervision, Y. T. Kim and W. S. Heo; Project Administration, J. M. Lee; Funding Acquisition, All Authors.
References
-
O. Schinas and M. Butler, “Feasibility and commercial considerations of LNG-fueled ships,” Ocean engineering, vol. 122, pp. 84-96, 2016.
[https://doi.org/10.1016/j.oceaneng.2016.04.031]

- J. H. Kim and K. W. Chun, “Technical Trends of LNG fueled ship and bunkering,” Korea Evaluation Institute of Industrial Technology PD Issue Report, vol. 14, no. 10, pp. 31-39, 2014.
-
J. H. Choe, K. H. Kim, D. Y. Lee, C. S. Bang, and D. G. Lee, “Glass composite vibration isolating structure for the LNG cargo containment system,” Composite Structures, vol. 107 pp. 469-475, 2014.
[https://doi.org/10.1016/j.compstruct.2013.08.013]

- J. H. Bae, J. G. Lee, H. M. Chae, and Y. H. Lee, “Reinforcing member fixing device for primary barrier of liquefied natural gas storage tank.” U.S. Patent no. 10054264, Aug. 21, 2018.
-
B. C. Kim, S. H. Yoon, and D. G. Lee, “Pressure resistance of the corrugated stainless steel membranes of LNG carriers,” Ocean Engineering, vol. 38, no. 4, pp. 592-608, 2011.
[https://doi.org/10.1016/j.oceaneng.2010.12.013]

-
D. Y. Lee, S. H. Yoon, K. H. Kim, I. B. Choi, D. G. Lee, “Composite anti-buckling structure for the corrugations of liquefied hydrogen containers,” Composite Structures, vol. 95, pp. 492-499, 2013.
[https://doi.org/10.1016/j.compstruct.2012.07.004]

- C. K. Kim, Y. S. Lee, B. S. Cha, Y. G. Kim, I. S. Yoon, and H. S. Hong, “Numerical analysis on the stress behaviours due to geometry effects of the membrane corrugation,” Journal of the Korean Institute of Gas, vol. 1, no. 1, pp. 21-26, 1997 (in Korean).
-
H. G. Noh, J. Y. Jung, T. W. Ku, B. S. Kang, “Numerical analysis and experimental evaluation on formability of membrane for LNG storage tank,” Transactions of Materials Processing, vol. 20, no. 6, pp. 409-419, 2011 (in Korean).
[https://doi.org/10.5228/KSTP.2011.20.6.409]

-
D. Y. Lee, K. H. Kim, I. B. Choi, and D. G. Lee, “Pressure-resisting capability of the knot area of the primary barrier for a LNG containment system,” Ocean Engineering, vol. 95, pp. 128-133, 2015.
[https://doi.org/10.1016/j.oceaneng.2014.11.021]

- Tokyo Sokki Kenkyujo, Strain Gauge Type (TML Pam E-101S) and Civil Engineering Transducers (TML Pam E-720R) manuals, Tokyo Sokki Kenkyujo, Tokyo, Japan, pp. 1–16, 2011.
-
H. C. Chen, “CFD simulation of compressible two-phase sloshing flow in a LNG tank,” Ocean Systems Engineering, vol. 1, no. 1, pp. 31-57, 2011.
[https://doi.org/10.12989/ose.2011.1.1.031]

-
Kim J. H, Kim S. K, Kim M. H, & Lee J. M, “Numerical model to predict deformation of corrugated austenitic stainless steel sheet under cryogenic temperatures for design of liquefied natural gas insulation system,” Materials & Design, vol. 57, pp. 26-39, 2014.
[https://doi.org/10.1016/j.matdes.2013.12.037]

-
M. S. Kim, J. H Kim, S. K. Kim, and J. M. Lee, “Experimental investigation of structural response of corrugated steel sheet subjected to repeated impact loading: performance of LNG cargo containment system,” Applied Sciences, vol. 9, no. 8, pp. 1558-1575, 2019.
[https://doi.org/10.3390/app9081558]

-
P. L. Schaefer, G. Chagnon, and A. Moreau-Gaudry, “3D small strain large deflection beam shape sensing including poisson effect,” Engineering Structures, vol. 209, 2020.
[https://doi.org/10.1016/j.engstruct.2019.109948]


