Hydrodynamics of top hinged OWSC wave energy device the “Pendulor” with a bottom gap
Copyright ⓒ The Korean Society of Marine Engineering
This is an Open Access article distributed under the terms of the Creative Commons Attribution Non-Commercial License (http://creativecommons.org/licenses/by-nc/3.0), which permits unrestricted non-commercial use, distribution, and reproduction in any medium, provided the original work is properly cited.
Abstract
“Pendulor” device is a top-hinged Oscillating Wave Surge Converter (OWSC) type device bounded by a caisson with one side open to the sea. When the flap of the OWSC has a bottom gap and placed at one-eighth of wavelength distance from the back wall of the caisson, it was identified that an additional resonance mode could trigger. That mode is identified as “pumping mode”, and this paper reports evidence of the occurrence of the pumping mode through numerical and PIV investigations. Initially, Computational Fluid Dynamics(CFD) based Numerical Wave Tank(NWT) was created using STAR CCM+ to be compatible with the experimental wave tank. Then the device ran on the NWT and compared with the wave tank experiments. Experimental and CFD comparisons of wavelengths, the rotational angle of the flap are closely matched and hence the CFD model is considered as reasonably accurate for further investigations. Then by using the validated CFD model, the flow pattern at the vicinity of the bottom gap was further investigated and compared with particle image velocimetry (PIV) data. Both CFD and PIV results are closely matched to each other. Therefore, it is revealed the occurrence of “pumping mode” and evanescence waves when the flap is placed 1/8th distance from the back wall with a bottom gap.
Keywords:
Wave energy, Hydrodynamics, Oscillating wave surge converter(OWSC), Evanescence waves, Particle image velocimetry(PIV), STAR-CCM+1. Introduction
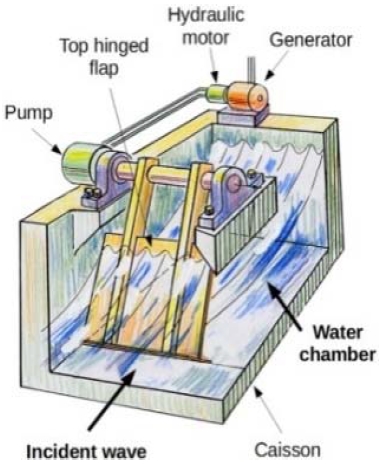
“Pendulor” wave energy device is a top-hinged OWSC device with a caisson (with one side open to the sea) drives by the action of standing waves generated inside the caisson (Figure 1). By placing the flap at the node of the standing wave, maximum energy capture could be obtained by tuning the device to resonate with the incoming waves. Pendulor device has been widely researched, assuming no gap with the caisson and experimented by minimizing the gaps to the least possible levels [1][2]. Although, a gap is almost certainly required when the flap is top-hinged due to the need to avoid the possibility of the flap jamming by trapping a boulder or other piece of benthic debris between the flap and the seabed. Recent numerical studies by the same authors found that transfer of water between the chamber and the open sea creates additional resonant mode to the dynamics of the flap and it is identified as the “pumping mode”. This paper discusses complete CFD modelling to verify the occurrence of this pumping mode and further validated by PIV testing. Since the wave tank testing and experimentation of wave energy converters need a lot of experimental resources, time and higher costs, Computational Fluid Dynamics (CFD) isa feasible and less demanding option. With the advancement of CFD packages, design engineers and researchers in marine renewable stream tend to model wave energy converters before work out with experiments. Therefore, using CFD, the difficulties in the experimentations could be managed reasonably. In this endeavour, CFD simulation has been carried out successfully for the top hinge Pendulor flap device inside a caisson.
However, most of OWSCs have been modelled in a semi-analytical way using the help of Boundary Element Method (BEM) codes such as NEMOH or WAMIT which are based on potential flow theories along with linear assumptions. Further, these codes are being used to estimate hydrodynamic coefficients such as added damping, added mass. According to this authors’ knowledge, all the OWSCs have been modelled using the finite volume method and only for bottom-hinged flap-type devices. P. Schmitt et al. [3] have successfully modelled a bottom-hinged flap-type OWSC using RANS CFD methods, and they performed a power optimization test series for an OWSC in monochromatic waves. S. Yeylaghi et al. [4] performed a fluid-structure interactions simulation for OWSC using smoothed particle hydrodynamic (SPH) and has obtained an agreement between the experimental and theoretical analysis. Y. Wei et al. [5] studied the wave loading on a bottom-hinged OWSC using the FLUENT CFD package using dynamic meshing techniques. A fully analytical model for an array of Pendulor devices [2] and semi-analytical models with WAMIT was developed to investigate hydrodynamic characteristics of the top-hinged devices by the work done by S. D. G. S. P. Gunawardane et al. [2][7]. Therefore, the speciality of this study is a full 3D model of a top-hinged Pendulor laboratory model using overset meshing and Dynamic Fluid Boundary Interaction (DFBI) techniques using commercially available STAR CCM+ CFD package. Moreover, the experimental and CFD results are compared to identify the bottom gap hydrodynamics of the “Pendulor” device.
At the end of this introduction, the paper begins with the establishment of NWT compatible with the experimental wave tank. Then it further elaborates the theoretical background and CFD techniques used in the modelling process, including mesh generation and dynamic fluid body interactions (DFBI). Then, the compatibility of NWT and full CDF model is verified with the wave tank testing results. Finally, the bottom gap hydrodynamic is investigated using both CFD and PIV results followed by a discussion.
2. Formulation of Computational Domain
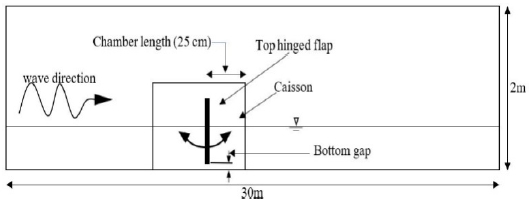
Since the flap oscillates in one degree of freedom, the CFD analysis could be simplified to a symmetrical analysis. A numerical wave tank (NWT) of 30 m long and 0.5 m width (half-width of the experimental tank due to symmetry) is considered for the CFD analysis. However, the experimented wave tank in Korea Maritime and Ocean University (KMOU) has a length of 7 m, a width of 1 m and height of 1.5 m. The length of the Numerical Wave Tank (NWT) is taken longer than the actual length in order to delay the back-wall reflection effects. The schematic of the Numerical Wave Tank (NWT) setup with the OWSC is shown in Figure 2.
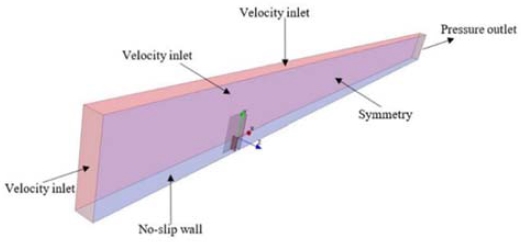
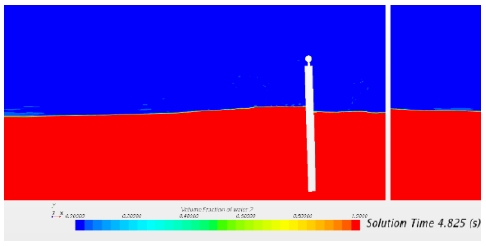
The physics of NWT has a direct impact on the boundary conditions. Therefore, suitable boundary conditions should be assigned to the NWT walls as elaborated in previous similar studies [10]. As shown in Figure 2, waves propagate from the left wall boundary are set as a fifth-order wave, and the wall is set as a velocity inlet boundary. The wall opposite to the left wall is set as a pressure outlet boundary. The remaining top wall and the wall opposite to the symmetrical plane are selected as the velocity inlets. The bottom wall is selected as a no-slip wall (see Figure 3).
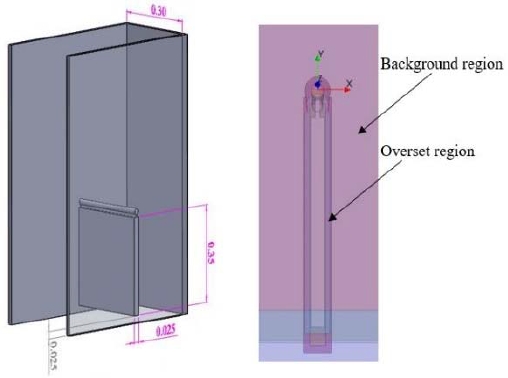
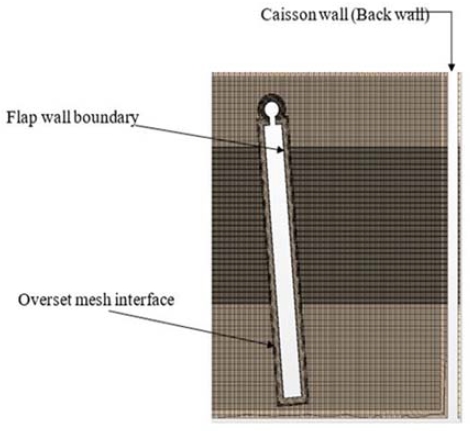
Since the dynamic fluid body interaction is modelled using the overset mesh methodology, the overset region was created according to the standards [8]. Figure4 illustrates the 3D geometry of the flap, caisson and the created overset region with key dimensions.
Most of the OWSCs that exist in the literature have been modelled using dynamic meshing techniques or remeshing techniques which increases the computational time [5]. Further, many were modelled considering the open sea states. However, the existence of the caisson makes it complex to apply dynamic meshing and remeshing techniques. Therefore, difficulties arise in conventional meshing techniques could be avoided by using the overset meshing, which will be discussed in section 3.2.
3. Theoretical Background and CFD Techniques
3.1 Wave physics
Most of the state of the art CFD packages include different wave libraries which can be used to deal with regular waves as well as irregular waves. In STAR CCM+, the wave library is based on the Volume of Fluid (VOF) method, which is commonly used for open channel flow modelling in CFD simulations. According to the STAR CCM+ user manual, there are two main theories for wave generation as the Stokes theory and the Conoidal theory. According to the dimensions of the experimental setup, the associated wave parameters are fallen in the Stokes wave region [12]. Therefore, to compatible with the wave tank generated waves, the fifth-order Stokes waves were used for the present analysis, which is based on the fifth-order approximation for the Stokes theory of waves. Fenton et al[9]. suggests that the fifth-order Stokes waves are valid only for Ursell numbers less than 30, where the Ursell number (UR) is defined as Equation 1.
| (1) |
Where H, λ and d represent the wave height, wavelength and water depth respectively. Therefore, for the present experimental setup, the non-dimensional value of UR does not exceed 30. Hence, the fifth-order Stokes wave is reasonable to use in this analysis. Wave forcing has been applied to the inlet boundary to perform a long-lasting simulation without having reflection disturbances at the inlet [8]. Wave forcing is a good alternative for wave damping, which helps to reduce the computational domain.
3.2 Mesh Generation
The conventional meshing techniques, such as remeshing and dynamic meshing techniques, contain only one type of mesh elements throughout the computational domain. However, the overset meshing can have different types of mesh elements inside the computational domain, where these mesh elements can overlap each other. Also, the computed data transferred through the overset mesh interface is efficient compared to the conventional method. By considering those facts, as shown in Figure 5, an overset region has been used around the oscillating flap, while the tank region considering as the background.
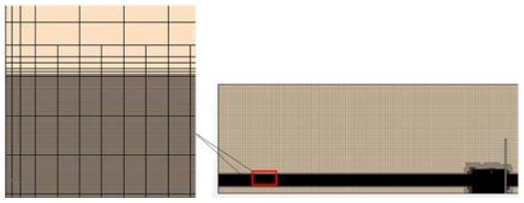
The computational domain was meshed by using standards [8] to capture the best VOF wave behaviour. When using the VOF wave model, the free surface plays an essential role in the wave tank. Therefore, around the free surface, the mesh has been divided accordingly so that the height of a mesh element is 1/20th of the wave height, length of a mesh element is 1/100th of the wavelength, and the width of a mesh element is 1/100th of the wavelength. A part of the mesh is shown in Figure 06.
The basic idea behind the DFBI is to predict the motion of a rigid object in response to force and moment calculated in the fluid region. STAR-CCM + calculates the forces and moments acting on a rigid body and solves the governing equation of motion necessary to determine the new position of the solid body [8]. Here, an external damping moment applied to the flap around the centre of mass according to Equation 2 where, nd; damping moment, an,d; angular damping constant an; angular velocity respectively.
| (2) |
Since the flap has one degree of rotational motion around the hinged axis, STAR CCM+ solves the following differential equation shown in Formula (3) to simulate the flap motion.
| (3) |
Where M is the mass moment of inertia tensor, ω is the angular velocity and n is the moment acting on the centre of gravity. Time step for the simulation has calculated according to the STAR CCM+ standards as per Equation 4.
| (4) |
Where P is the wave period, and n is the number of mesh elements along the free surface in X direction per wavelength (this case it is 100). Accordingly, 0.005 s time step was used for the simulation. By integrating methodologies mentioned above, essential parameters such as the rotating angle of the flap, wave height inside the NWT, velocity vectors focusing the bottom gap are studied using a series of CFD simulations. Next section discusses the analysis process of the study with the comparison between numerical and experimental data.
4. Results and Discussion
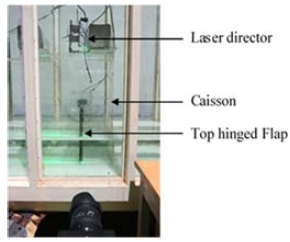
In this section, the experimental results and the simulated results are compared mainly focusing the rotational angle of the “Pendulor”, the Particle Image Velocimetry (PIV) results and the effect of the wave height for the simulated results. The comparison has been made visually for some cases rather than a quantitative manner. Figure 7 illustrates the experimental setup used in Korea Maritime and Ocean University (KMOU).
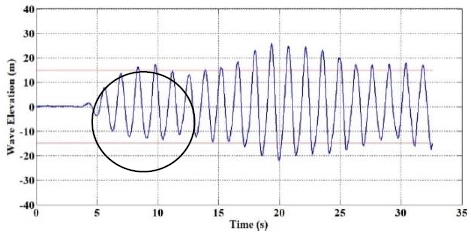
The wave characteristics inside the experimental wave tank change quickly (see Figure 8) mainly due to shortness of the wave tank (7 m). Therefore, the analysis has done for a data set which includes 1 to 2 wavelength run time, which is from 1 s up to the maximum of 5 s. Similarly, in the simulation, the wave inside the NWT is stabilized and propagated up to the flap, and then the results have been obtained from that point for each simulated wave time periods. In physical experiments, the holding torque was applied to the flap by varying the supplied current to a powder breaker (damper). According to the phenomena of the “Pumping Mode” (occurs when the distance between the flap and the back wall of the caisson is at 1/8th of the wavelength [7]), 1.4 s wave period is estimated to be created the “Pumping Mode” for the current model. Therefore 1.4 s wave period is selected for the current analysis. Then the hydrodynamics across the bottom gap should show different characteristics than other time periods.
4.1 Wave height
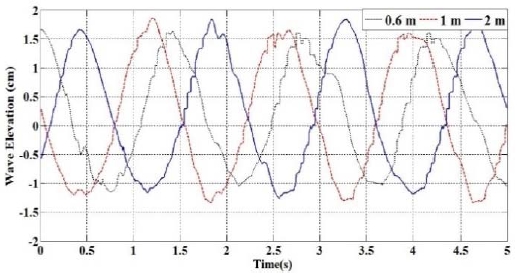
In the experimental setup, wave height has been obtained for two different locations from ultrasonic sensors placed towards the wave generator side at a distance 0.3 m and 1 m in front of the caisson. Figure 08 shows the experimental wave height for 1 m sensor data. Here, the highlighted area shows the selected waves for the analysis. However, in CFD simulation, wave height was monitored with time using mesh variation of the free surface. For that, the wave height was captured in three different locations on an isosurface. However, as shown in Figure 09, the CFD wave probe results show saw-tooth variations because of isosurface created by choice of 0.5 air and 0.5 water volume fractions. Those three-wave probes were created to capture the elevation on the free surface 0.6 m, 1 m and 2 m away from the caisson front. Figure 10 shows simulated wave probe results for 5 s run time.
The differences between theoretical wave amplitude and CFD wave amplitude were calculated by taking the RMS value of the simulated results. The percentage error of the CFD wave height is nearly 10% compared to the experimental data. Therefore, a small discrepancy of the wave height between CFD and experimental data are expected as reported in previous studies [11]. Hence, the wave height difference is quite practical when it is compared with the experimental wave height results. Considering the above facts, the NWT established for this study is considered to be reasonably accurate.
4.2 Flap Oscillatory angle
The oscillatory angle of the flap around the Z-axis has been monitored in real-time in the simulation and compared with the experimental data. Figure 11 shows the comparison of simulated angular variation for 1.4 s time period with 1.5 Nm power take-off torque at the flap shaft. The vertical axis and the horizontal axis of both figures represent the angle in degrees and the time in seconds, respectively.
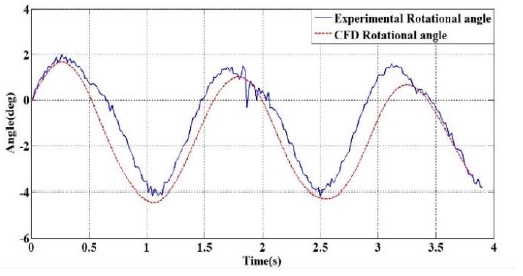
Comparison of simulated (dashed line) and experimental angular variation (solid line) for 1.4 s wave period with1.5 Nm shaft torque.
Further, for comparison, the difference between RMS values of the oscillatory angles was calculated for both cases. Accordingly, the percentage oscillatory angle difference between CFD and experimental results is 9% which is proportional to the wave height error. Hence, there is a reasonable agreement between simulated and experimental results, and hence the CFD model could be considered as reasonably accurate for further analysis.
4.3 Comparison of Experimental PIV Results
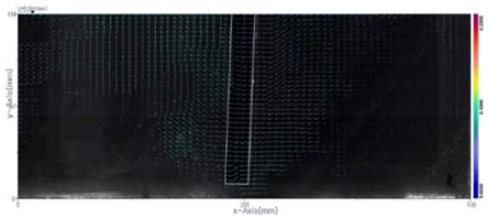
PIV experiment has been carried out to find the bottom gap hydrodynamics around the bottom gap of the flap. The aim of the experiment is to investigate the “pumping mode” inside the caisson for certain wave periods [7]. By analyzing the PIV results, velocity variation under the bottom gap can be observed. Therefore, velocity variation under the bottom gap has been visually represented after the PIV experimental analysis. All the PIV analysis for different wave periods reveals that there is a significant difference in the velocity profile when the wave period is at 1.4 s. Figure 12 shows the analyzed PIV experiment results for 0.7 s wave period (chamber length is 1/4th of the wavelength) and similar patterns have been observed for other wave periods except for 1.4 s.
Similarly, the magnitude of the velocity under the bottom gap was calculated for each time step in CFD simulation. By using these simulated data, a video has been created to visualize the bottom gap hydrodynamics. Figure 13 shows such obtained snapshots of CFD and PIV experimental results for 1.4 s wave period with 1.5 Nm applied shaft torque. Pumping mode occurs due to an elevated velocity through the bottom gap from the front side of the caisson to the caisson back wall side and vice versa. According to Figure 13, it is visible that vibrant velocity variation under the bottom gap occurs in comparison to figure 12, where the flap operates at 0.7 s wave period. This 0.7 s wave period corresponds to the camber length, which is at one-quarter of the wavelength. Therefore, compared to the PIV and CFD data, there is a tendency to happen pumping mode when the wave period is at 1.4 s, which corresponds to the chamber length of 1/8th wavelength. Therefore, the CFD and PIV video results provide strong evidence for pumping mode action across the bottom gap.
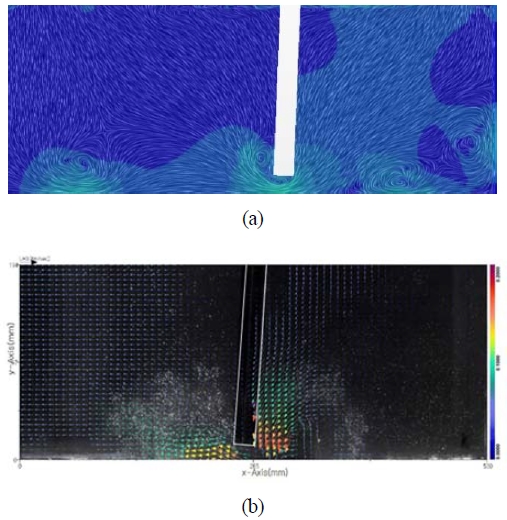
(a) CFD velocity variation under bottom gap and (b) PIV Experimental velocity variation under bottom gap, for 1.4 s wave period with 1.5 Nm shaft torque
Previous numerical investigations by the same authors have observed that the water in the chamber is excited in pumping or sloshing mode resulting in more significant fluid flows. It generates larger radiated waves producing larger added damping coefficients. It also suspected that all of these larger fluid flows do not result in radiated waves and hence significant proportions of the flows do not propagate and thus form evanescent waves [6]. The current observations provide strong evidence of evanescent wave generation around the flap bottom.
PIV and CFD velocity vector comparison provided a strong proof of the occurrence of a pumping mode when the flap is placed at 1/8th of wavelength distance from the back wall when the flap has a bottom gap. However, this comparison has been made qualitatively by using visual results. Due to the large computational domain and small-time step, solution time is quite high for the VOF wave simulation. Therefore, the next step is to find a method to decrease the computational time by reducing the computational domain while maintaining accuracy; thus, an extended analysis could be possible with minimal computing demand.
5. Conclusion
In this endeavour, complete CFD based NWT was modelled to investigate the bottom gap hydrodynamics of the "Pendulor" wave energy device. The wave heights of produced waves in the NWT are compared with the experimental wave tank wave heights as the first step of NWT model verification. According to the results, the reliability of NWT was confirmed.
Further, the CFD model is verified by using the experimental rotational angle of the flap. CFD and experimental rotational angles of the flap were matched to a reliable accuracy where the difference (9%) in the rotational angle is proportional to the wave height difference in respective cases.
The current analysis strongly reveals the occurrence of “Pumping mode” and evanescent waves around the flap bottom when the flap is placed 1/8th wavelength from the back wall with a bottom gap. This phenomenon should be further investigated to find the feasibility to capture more energy while reducing the effective chamber length of the device.
Acknowledgments
This work is partially related to the research activities undertaken through funding from the grant RG/AF 2013/30E, University of Peradeniya, Sri Lanka. The extra support and facilities given by the “flow informatics laboratory” at KMOU, South Korea is highly appreciated.
This paper is an extension of the 2nd International Conference on Advanced Convergence Engineering (ICACE2019).
Author Contributions
Conceptualization, S. D. G. S. P. Gunawardane; Methodology, S. D. G. S. P. Gunawardane and S. Rathnayake; Software, S. Rathnayake and B. H. Kim; Validation, S. D. G. S. P. Gunawardane and S. Rathnayake; Formal Analysis, S. D. G. S. P. Gunawardane and S. Rathnayake; Investigation, S. D. G. S. P. Gunawardane; Resources, S. D. G. S. P. Gunawardane and Y. H. Lee; Data Curation, S. D. G. S. P. Gunawardane; Writing—Original Draft Preparation, S. D. G. S. P. Gunawardane and S. Rathnayake; Writing—Review & Editing, S. D. G. S. P. Gunawardane and S. Rathnayake; Visualization, S. D. G. S. P. Gunawardane and B. H. Kim; Supervision, S. D. G. S. P. Gunawardane; Project Administration, S. D. G. S. P. Gunawardane and Y. H. Lee; Funding Acquisition, S. D. G. S. P. Gunawardane and Y. H. Lee.
References
- T. Watabe, Ocean Wave Energy Converter, Fuji Print Company Ltd., 2000.
-
S. P. Gunawardane, C. J. Kankanamge, and T. Watabe, “Study on the performance of the “Pendulor” wave energy converter in an array configuration,” Energies,vol. 9, no. 4,p. 282, 2016.
[https://doi.org/10.3390/en9040282]

-
P. Schmitt, H. Asmuth, and B. Elsäßer, “Optimizing power take-off of an oscillating wave surge converter using high fidelity numerical simulations,” International Journal of Marine Energy, vol. 16, pp. 196-208, 2016.
[https://doi.org/10.1016/j.ijome.2016.07.006]

-
S. Yeylaghi, B. Moa, P.Oshkai, B.Buckham, and C. Crawford, “ISPH modelling of an oscillating wave surge converter using an OpenMP-based parallel approach,” Journal of Ocean Engineering and Marine Energy, vol. 2, pp. 301-312, 2016.
[https://doi.org/10.1007/s40722-016-0053-7]

-
Y. Wei, A. Rafiee, B. Elsäßer, and F. Dias,“Numerical simulation of an oscillating wave surge converter,”Proceedings of the ASME 2013 International Conference on Ocean, Offshore and Arctic Engineering,2013.
[https://doi.org/10.1115/OMAE2013-10189]

-
A. Henry, M. Folley, and T. Whittaker, “A conceptual model of the hydrodynamics of an oscillating wave surge converter,” Renewable Energy,vol. 118, pp. 965-972, 2018.
[https://doi.org/10.1016/j.renene.2017.10.090]

-
S. D. G. S. P.Gunawardane, M. Folley, and C. J. Kankanamge, “Analysis of the hydrodynamics of four different oscillating wave surge converter concepts,” Renewable Energy, vol. 130, pp. 843-852, 2019.
[https://doi.org/10.1016/j.renene.2018.06.115]

- CD-adapco, STAR-CCM+ User Guide, v13.02.011, USA, CD-adapco Inc, 2018.
-
J. D. Fenton, 1985. “A Fifth-Order Stokes Theory for Steady Waves”, Journal of Waterway, Port, Coastal and Ocean Engineering, vol. 111, no. 2,pp. 216-234, 1985.
[https://doi.org/10.1061/(ASCE)0733-950X(1985)111:2(216)]


