Study of propane gas explosion experiment and numerical analysis of flame arrestor design for LPG ship exhaust system
Copyright ⓒ The Korean Society of Marine Engineering
This is an Open Access article distributed under the terms of the Creative Commons Attribution Non-Commercial License (http://creativecommons.org/licenses/by-nc/3.0), which permits unrestricted non-commercial use, distribution, and reproduction in any medium, provided the original work is properly cited.
Abstract
In this study, a capacity validation using computational fluid dynamics (CFD) is performed to predict the pressures and deflagrations acting on a flame arrestor when an explosion occurs in the exhaust system of a liquefied petroleum gas (LPG ship). The validation is intended to assess whether CFD can be used to verify the performance of a flame arrestor, which is difficult to determine in a large-scale exhaust system. In addition, results of an experiment in a 3 m3 chamber with those of CFD are compared. ANSYS CFX, which is a commercial software program, is used to predict the pressure fluctuations resulting from an explosion. The explosion analysis is compared with an explosion experiment of an air–propane mixture that considers a rupture disc. Results show maximum pressure values of 0.71 s to 0.5 bar and 0.7 s to 0.5 bar are derived from the explosion test and numerical analysis, respectively. In both cases, the rupture disc is opened and the internal pressure reached the atmospheric pressure rapidly. The results of the numerical analysis are nearly identical to the experimental results, and the explosion technique used in the numerical analysis could be applied to predict explosions with greater accuracy. In addition, the development of a flame arrestor and safety devices for the exhaust systems of small- and large-scale LPG ships will reduce the time and cost required for design.
Keywords:
Computational fluid dynamics (CFD), Explosion analysis, Propane, LPG ship, Flame arrestor1. Introduction
From the Korean Government statistics [1], 7,713 accidents on maritime vessels have occurred; among those, 15 (0.2%) were explosions and 301 (4%) were fire-related incidents from 2015–2017. Apart from vessel collisions, stranding, or oil-spilled incidents, major accidents related to fire or gas explosions have not been reported at domestic ports. However, as fire or explosive accidents on board a ship can spread through the entire ship, the risk of major casualties is extremely high. Owing to the high risk, fire and explosion prevention equipment must be installed on board a vessel.
Liquefied petroleum gas (LPG) is transported in its condensed liquid state through LPG tankers and piping equipment. To prevent unforeseen accidental explosions, LPG containers and connected piping must be installed with rupture discs as per Korean safety regulations [2]. Similar measures have been performed for piping in maritime/offshore plants and in ship engine rooms that require combustible gas transportation to prevent ignitions and accidental explosions. To prevent these types of explosions, a flame arrester is installed either at the middle or either ends of the piping to allow gases, fluids, internal pressure, etc. to pass through but prevent flames from passing through. The installation of the flame arrestor suppresses the spread of flames while allowing internal gases/liquids to be discharged rapidly, which prevents large fires or explosions from occurring and preventing damage to other equipment and infrastructure, as well as human causalities.
In this study, an explosion experiment was conducted using a propane gas and air mixture in a chamber. The flame size and pressure changes over time were recorded and presented. Subsequently, a numerical analysis of the explosion is performed under similar conditions to predict the pressures, velocity, and temperature in the container. The fluid characteristics of the gases in the experiment and the numerical analysis of the explosion were compared, analyzed, and presented. The aim of this comparative analysis is to verify that the numerical method used can assist in the design of the flame arrestor by predicting the pressures/deflagrations that will occur on a flame arrestor when an explosion occurs in an LPG ship exhaust system.
2. Explosion Experiment
2.1 Explosion Setup
An explosion test was conducted by FDC Co., Ltd. using an explosive test equipment of FDC Co., Ltd., and the analysis was performed based on the test data of FDC Co., Ltd.
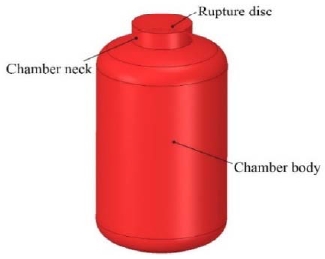
Figure 1 shows the model of the standard container used for the explosion experiment. The model was made of steel, with a volume of 3.07 m3. The container was designed to be sufficiently thick to contain strong explosions. When an explosion occurred during the experiment, the exhaust was discharged through an exhaust port located at the top of the container and covered by a rupture disc. A rupture disc is designed to rupture at a specific pressure; for this experiment, the rupture disc was designed to break at 0.5 bar. Once ruptured, the gases and pressure would be discharged outward.
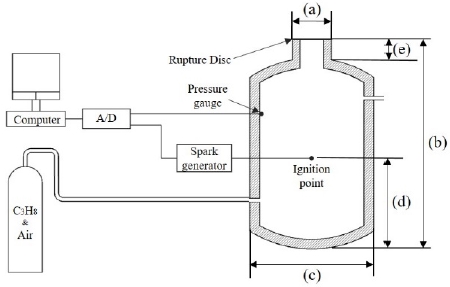
Figure 2 shows the layout of the experiment and the equipment used. Pressure sensors were installed near the top of the container. As propane is denser than air, igniting the gas in the chamber will cause residue to remain at the bottom of the container. The propane and air was distributed uniformly by circulating the gas in the chamber by injecting the propane/air gas mixture through a pipe installed at the bottom of the container.
Table 1 lists the size and parameters of the chamber and the diameter of the exit diameter where the rupture disc was installed. The ignition point was located approximately 0.7 m from the bottom of the container. Table 2 lists the conditions of the gas and before ignition in the experimental chamber. The propane/air mixture was injected into the container at a rate of 42 L/min for 60 min. The turbulent mixing of the gases allowed the gases to be uniformly distributed. To match the internal gas’s explosive concentration [3], the internal pressure was set to 0.2 bar for the experiment.
2.2 Experiment Results
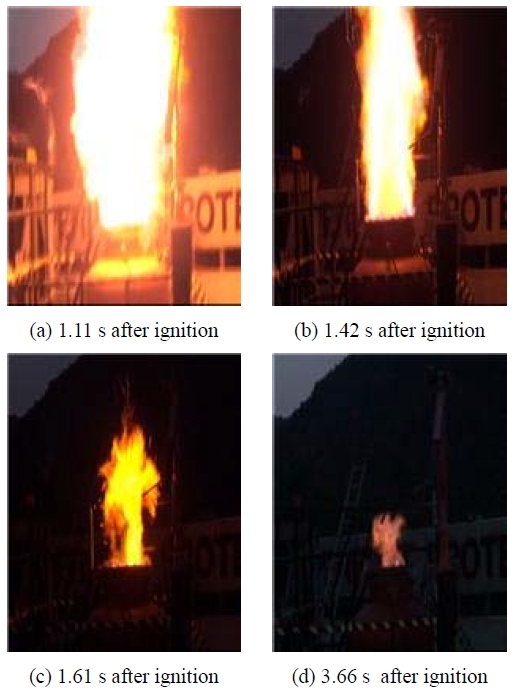
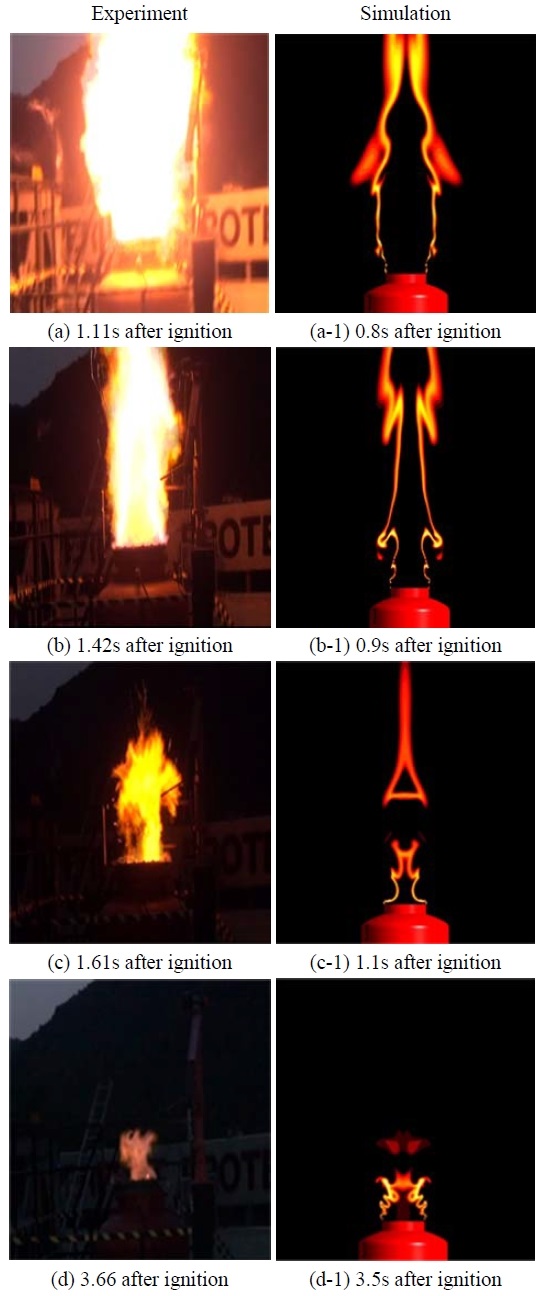
Figure 3 shows the photographs captured during the experiment at different times after the ignition as the flames exited the container. The experiment was conducted in the night to aid the visual confirmation of the ignition and combustion by the naked eye. Figure 3 (a) shows the picture captured 1.11 s after ignition; bright exiting flames are shown expanding wider than the diameter of the chamber’s exit. However, 1.42 s after ignition, as shown in Figure 3 (b), the width of the out-going flame pillar matched the diameter of the chamber exit diameter; 1.61 s after ignition, as shown in Figure 3 (c), the size of the flames reduced significantly until 3.66 s (Figure 3 (d)), where the flames were combusting the remaining gases that were exiting the chamber.
3. Numerical Analysis
3.1 Modeling of Numerical Analysis
The chemical equation related to the explosion analysis is given by the following Equation (1):
| (1) |
In the numerical analysis, to reduce the calculation time, the piping for the propane/air mixture was not added; instead, an airtight container that contained a uniformly mixed propane/air gas mixture was modeled. The conditions for the experiment were specified for the analysis, and the flame speed closure model [4] was used for the turbulence model. The governing equations are shown in Equation (2):
| (2) |
is the chemical source term;
is the source term;
is the averaged reaction progress variable;
is the density of the unburnt mixture; and
ST is the turbulent burning velocity.
The governing equation above, Equation (2), affects the resulting turbulence burning velocity. This equation has several advantages compared with the basic molecular reaction rate modeler. First, it is simpler than the basic molecular reaction rate model and the difference in the results of the overall combustion analysis is small. Next, results from the experiments can be entered into the numerical analysis. Therefore, for these reasons and the reduced time for numerical calculation, this method was preferable.
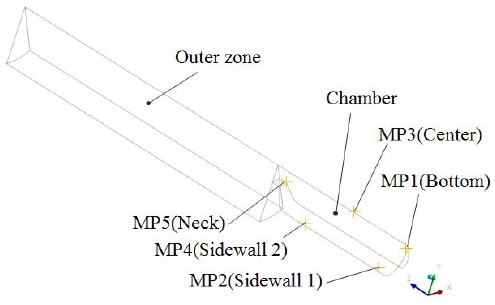
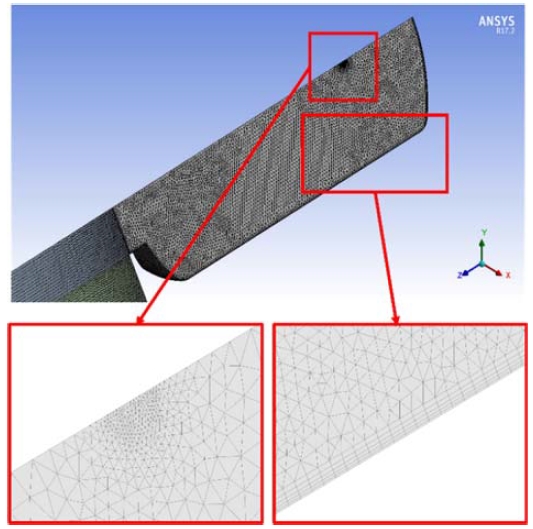
To obtain explosion and fluid characteristics similar to those of the experiment, once the internal pressure of the container reached 0.5 bar, the rupture disc would open. A transient analysis was specified with a total time of 4.8 s. The domain, shown in Figure 4, was used for the analysis and a tetra-element mesh was used for the domain. To further minimize the calculation, only a section of the container was modeled and the symmetry boundary condition was applied. Several points inside the container (near the bottom, center, side walls, and neck) were monitored for temperature.
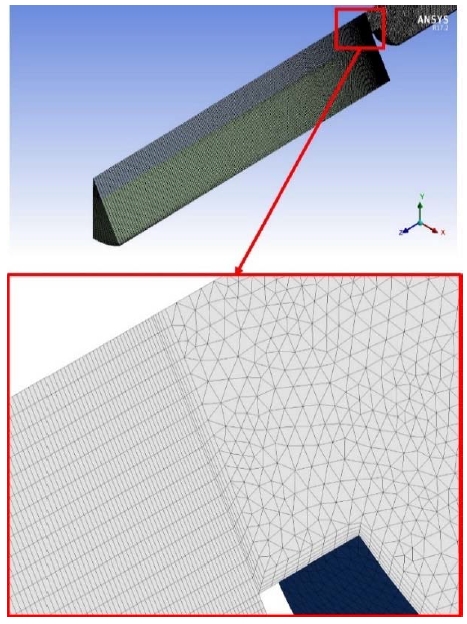
Figure 5 shows the internal mesh of the container, where; the mesh is refined near the ignition point. In addition, the mesh near the walls of the container are refined to measure the temperature variation. The area outside the container was modeled using hexa elements, as shown in Figure 6. The rupture disc was located in the area between the container exit and the external area, and it has been refined to adequately capture the fluid flow and sudden changes that occur after rupture. For the simulation, the total numbers of nodes and elements were 244,220 and 599,256, respectively. The finite-volume-based solver ANSYS CFX was used to perform the numerical analysis of the explosion [5].
3.2 Boundary Conditions
Generally, the shear–stress transport (SST) model or the k–epsilon (k–ε) model is utilized in turbulence modeling. For the refined mesh utilized in this analysis, the difference in results was not large, but as the k–ε model required less time than the SST model to complete, it was selected for this analysis. The total energy was applied in the heat transfer equation. The combustion model used the burning velocity model (BVM), which used the Zimont method in a combustion acceleration simulation used in the RUT facility [6]. In the BVM model, the combustion and flame speed was determined by the burning velocity; the burning velocity equation is given in Table 3.
The time step interval for the analysis was initially selected as 1 ms but owing to the sudden change caused by the rupture disc, the interval was changed to 0.2 ms to capture the results adequately.
3.3 Results of Numerical Analysis
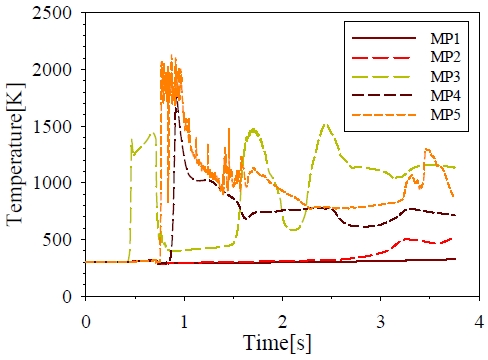
J. K. Paik et al. [7] performed an experimental analysis on explosions, and the data obtained were compared with the numerical analysis, as shown in Figure 7 and Figure 8. K. Hu and Y. Zhao [8], who analyzed temperature changes as the calculation time and temperature of the explosion as investigated by Q. Liu et al. [9], who used a gas mixture of propane and air for an explosion analysis, was considered in the paper as well. Figure 7 shows the variation in temperature at different points inside the container. The ignition point was located 0.7 m below the center point (MP3) and as the explosion rose upward, a large temperature increase occurred at point MP3 at approximately 0.5 s. At approximately 0.7 s, the rupture disc broke owing the sudden increase in internal pressure and the exit of hot gases from the container. Once the gases exited, the temperature at the center decreased. Simultaneously the points at the neck (MP5) and high wall (MP4), the temperature increased to approximately 2200 K before decreasing to 1000 K subsequently. At the center point, MP3, the gas temperatures varied from 500 to 1500 K. Following that, the pressure stabilized and the combustion expanded fully in the container. After 3 s, the temperature near the bottom wall increased gradually. However, at the bottom end of the container, because combustion did not occur, the temperature did not increase. In addition, during the explosion, the temperature was measured at the neck at approximately 2,237 K and at that instant, the temperature of the nearby upper walls indicated 1,987 K.
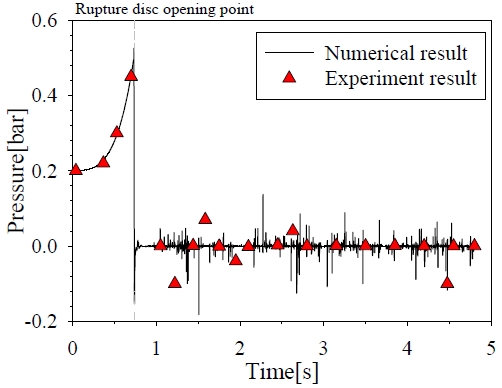
Figure 8 shows a graph comparing between the pressures obtained in the experiment and the numerical analysis at point MP4. A difference is shown where the numerical result showed an instant where the pressure dropped slightly after the rupture disc ruptured. However, in the experiment, the same pressure drop was not observed. Generally, the conditions before and after the rupture show a general agreement in results. Furthermore, it was observed that leading up to the rupture at approximately 0.7 s, the internal pressure increased in a parabolic shape up to 0.5 bar. After the rupture, the pressure returned to normal air pressure within 2 s. Subsequently, the fluctuated around the air room pressure as the remaining hot air gases exited the container. In this interval, the pressure fluctuated between the maximum of 0.1 bar and the minimum of -0.19 bar.
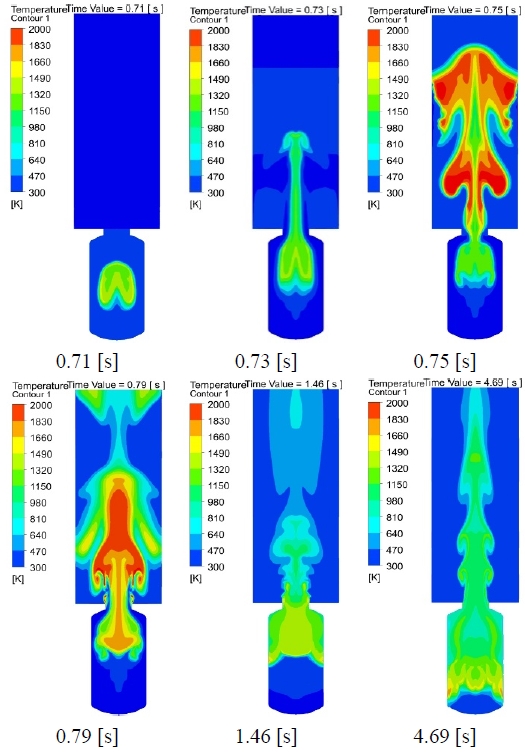
In Figure 9, several cross sections of the numerical domain show the calculated temperature of the gases at six different time instants. As the flame expanded at 0.73 s, it reached approximately 1500 K as it began to breach the container exit. As flames continued to exit from the container, temperatures as high as 2000 K were recorded as the hot gases began to expand into the surroundings. The diffused gases remained at a temperature of 1700–1800 K. After the initial explosion, some uncombusted propane gas remained inside the container owing to the outside pressure difference and density. After approximately 1 s, the remaining gas was burnt.
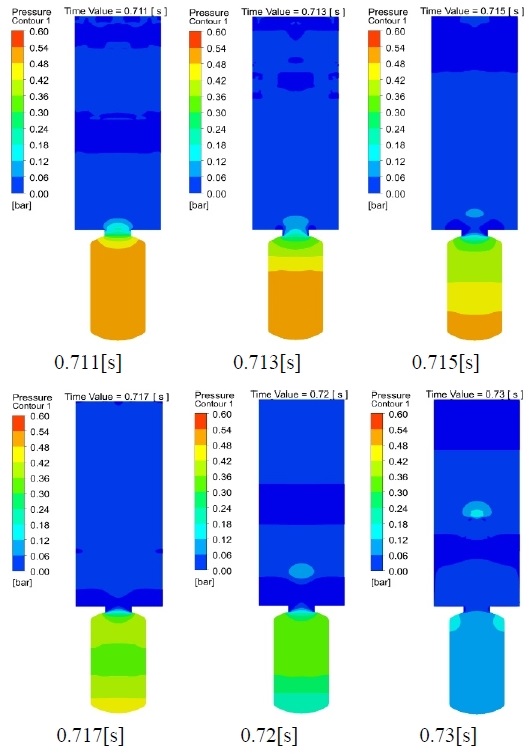
Figure 10 shows the pressure of the gas at the same instants as shown in Figure 9. As the rupture occurred, the pressure decreased from 0.5 bar until the room pressure.
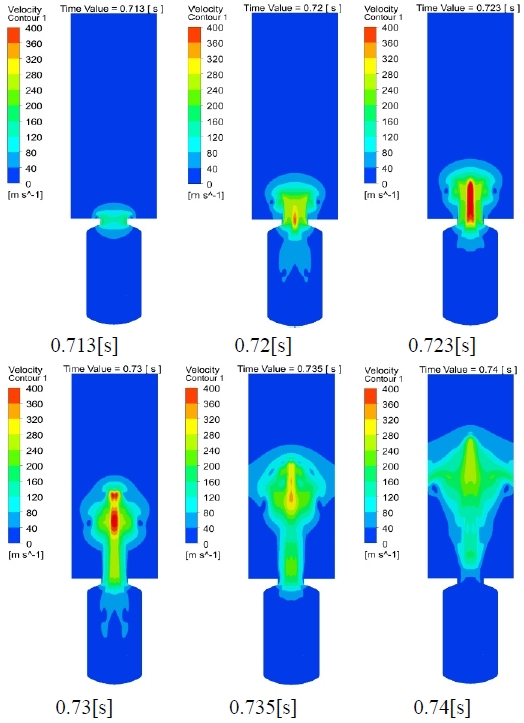
The contours in Figure 11 show the velocity of the gas at the time of the rupture. As shown, the exit velocity of the gas reached 400 m/s and within 1–2 s after the rupture, air entered the container at a velocity of approximately 10–20 m/s.
Figure 12 shows the comparison of flames produced in the experiment and numerical analysis. However, a slight 0.3 s time difference occurred between combustions in the experimental and numerical analysis. This difference could be due to the non-occurrence of combustion at the initial ignition but rather at the subsequent ignition attempts. Figure 12 (a) compares the instant where the rupture disc was ruptured and a thick flame column appeared in the experiment. Figure 12 shows the first stages of a strong exiting flame expanding outward in the numerical analysis. In both instants, the flame column width is significantly wider than the exit width. Figure 12 (b) and Figure 12 (b-1) show that the intensity and width of the flames decreased. Subsequently, Figure 12 (c) and Figure 12 (c-1) show that the flames decreased significantly in size. Figure 12 (d) and Figure 12 (d-1) show that the final flames remained.
4. Conclusion
In this study, propane explosion was analyzed both experimentally and numerically for the design of a flame arrestor in LPG vessels. The following results from each analysis were obtained and compared with each other.
In the experiments, a rupture disc designed to rupture at 0.5 bar was used; in the numerical analysis, this pressure was reached 0.71 s after ignition.
After the rupture, the pressure from inside the container forced the flames outside and drew some of the external air inside. During the rupture, the flames discharged at high velocities, and while flames where not observed 2–3 s after the experiment, the numerical analysis showed that the remaining propane gases continued to burn inside the container. In addition, the gases discharged at temperatures beyond 1000 K.
The main factors of damage to equipment or personnel were the pressure and high temperatures caused by the explosion. It was difficult to estimate the explosive pressure and flames once an explosion occurred in areas where measures to discharge sudden pressure increases existed. As the energy released from the chemical reaction during the explosion will increase the surrounding pressure and temperature, it is important to use real experiments to produce estimations that deduce maximum pressure values from maximum pressure values from test calculations. The numerical analysis of a simulation of a real explosion experiment was performed in this study to establish similarities timely. The method used in this study could facilitate the design of flame arrestors in small or large LPG vessels or other related safety equipment.
Acknowledgments
This research is the result of the consigned R&D of SME technology development support project in 2017 (project name : Flameless Explosion Venting Device for Inflammable Gas localization technology and product development, host name : FDC Co., Ltd.).
Author Contributions
Conceptualization, H. Yang and Y. Lee; Methodology, H. Yang, J. Park and J. Eun; Software, H. Yang, H. Park and J. Park; Validation, H. Yang, H. Park and J. Eun; Formal Analysis, H. Yang, J. Park and Y. Lee; Investigation, H. Yang and H. Park; Data Curation, H. Yang and J. Eun; Writing-Original Draft Preparation, H. Yang; Writing-Review & Editing, H. Yang and Y. Lee; Visualization, H. Yang and H. Park; Supervision, Y. Lee; Project Administration, Y. Lee; Funding Acquisition, Y. Lee.
References
- Korean Statistical Information Service (KOSIS), http://kosis.kr/statHtmal/statHtmal.do?orgId=146&tb1Id=DT_MLTM_2000, , Accessed April 15, 2019.
- K. Y. Kim, “Technical guidance on the calculation and installation of discharge capacity of safety valves, etc,” Korea Association Safety & Health Agency, 2017. Available: http://www.kosha.or.kr/kosha/data/guidanceD.do?mode=download&articleNo=262738&attachNo=142813, , Accessed April 3, 2019.
-
M. S. Y. Ebaid and K. J. M. Al-Khishali, “Measurements of the laminar burning velocity for propane: Air mixtures,” Advances in Mechanical Engineering, vol. 8, no. 6, pp. 1-17, 2016.
[https://doi.org/10.1177/1687814016648826]

-
I. C. Tolias, J. R. Stewart, A. Newton, J. Keenan, D. Makarov, J. R Hoyes, V. Molkov, and A. G. Venetsanos, “Numerical simulations of vented hydrogen deflagration in a medium-scale enclosure,” Journal of Loss Prevention in the Process Industries, vol. 52, pp. 125-139, 2018.
[https://doi.org/10.1016/j.jlp.2017.10.014]

- ANSYS, “ANSYS CFX-theory guide,” ANSYS Help, 2016.
-
V. L. Zimont, F. Biagioli, and Khawar, “Modeling turbulent premixed combustion in the intermediate steady propagation regime,” Progress in Computational Fluid Dynamics An International Journal, vol. 1, pp. 14-28, 2001.
[https://doi.org/10.1504/PCFD.2001.001467]

-
J. K. Paik, B. J. Kim, J. S. Jeong, S. H. Kim, Y. S. Jang, G. S. Kim, J. H. Woo, Y. S. Kim, M. J. Chun, Y. S. Shin, and J. Czujko, “CFD simulation of gas explosion and fire actions,” Ships and Offshore Structures, vol. 5, no. 1, pp. 3-12, 2010.
[https://doi.org/10.1080/17445300902872028]

-
K. Hu, and Y. Zhao, “Numerical simulation of internal gaseous explosion loading in large-scale cylindrical tank with fixed roof,” Thin-Walled Structures, vol. 105, pp. 16-28, 2016.
[https://doi.org/10.1016/j.tws.2016.03.026]

-
Q. Liu, Y. Zhang, F. Niu, and L. Li, “Study on the flame propagation and has explosion in propane/air mixtures,” Fuel, vol. 140, pp. 677-684, 2015.
[https://doi.org/10.1016/j.fuel.2014.09.123]


