Effects of DC electric fields applied in the radial direction of a co-flow bunsen flame
Copyright ⓒ The Korean Society of Marine Engineering
This is an Open Access article distributed under the terms of the Creative Commons Attribution Non-Commercial License (http://creativecommons.org/licenses/by-nc/3.0), which permits unrestricted non-commercial use, distribution, and reproduction in any medium, provided the original work is properly cited.
Abstract
In the case of Bunsen flame hydrocarbon fuels, the application of an electric field causes changes in combustion properties, combustion products, and combustion stability. Applying an electric field in the combustion reaction zone causes the movement of charge carriers from the flame to both electrodes, under the effect of the Lorentz force. The neutral molecules, which account for most of the number densities in the flame, possess kinetic energy due to the momentum transfer from the movement of charge carriers, which is called an ionic wind. The number densities of positive and negative charges generated via chemical ionization are equal; however, a majority of the negative charges consist of electrons. Moreover, electron mobility is 1000 times higher than that of positive ions. As a result, the residence time of electrons from the flame to an anode is relatively short owing to their high mobility. This implies that the local field intensity is relatively lower than that on the negative side. Therefore, an ionic wind blowing from the flame has asymmetric structures and acts as a decisive factor in the analysis of the flame structures under an electric field.
Keywords:
Bunsen flame, Ionic wind, Electric field, Plasma, Diffusion flame1. Introduction
The maritime shipping industry is undergoing a paradigm shift from low-carbon economic systems to zero-emission economic systems starting from the year 2020. According to an annual report of the International Maritime Organization (IMO), regulations will be enforced for sulfur oxides (SOx), nitrogen oxides (NOx), and carbon dioxide (CO2) in the future. In particular, regulations on NOx emission became effective formally in May 2015 and strengthened by classifying Tiers I–III. Currently, Tier III is applied, demanding an 80% reduction as compared to the conventional level. Therefore, as the combustion gas regulation has been reinforced, a variety of technologies have attempted to reduce the gas emission across the entire industry. Among these, combustion technologies employing an electric field and plasma are reported to yield benefits such as increased burning rates and combustion stability [5]-[7], while contributing to the reduction of combustion byproducts such as NOx [1]-[3] and CO [4] originating from the interaction between the flames and the electric field.
Generally, positive charges (CHO+, and H3O+) and negative charges (electron, O2—, and OH—) generated by chemical ionization exist in a combustion system using hydrocarbon fuels. If an electric field is applied to these, the charged particles are accelerated to the electrodes, on which attraction acts on each polarity due to the Lorentz force. Here, the momentum of occurrence of charges is transferred to the neutrons accounting for majority of number densities, thereby causing a large scale of bulk flow. This is called an “ionic wind.” Only until several years ago, an ionic wind was known as unidirectional. However, recently, results of flow field visualization using the particle image velocimetry (PIV) technique have confirmed experimentally that an ionic wind blows in both directions of the polarity of the flames [8]-[10]. Based on this result, various studies were conducted focusing on the direction of the electric field, premixed or non-premixed flames, and combustor types. In the results, the applied electric field at sub-breakdown caused changes in the flow field while having almost no impact on the chemical reactions and thermal properties, such as the flame propagation velocity and the flame temperature. Nevertheless, according to a study’s results, the altered flow field can significantly suppress the flame size, flame displacement velocity, and growth rate of soot particle [4]. Therefore, the electrically assisted combustion clearly has technical advantages in that the overall combustion environment can be improved through the control of the flow field.
Therefore, this study examined the dynamic flame behavior under the application of a radial-type electric field in the flame propagation direction rather than the direction of the applied electric field as in conventional studies. Furthermore, for electron impact attachment caused by oxygen molecules, which is a significant phenomenon of a bidirectional ionic wind, changes in the flow field are investigated through polarity change.
2. Experimental Equipment
2. Experimental Equipment
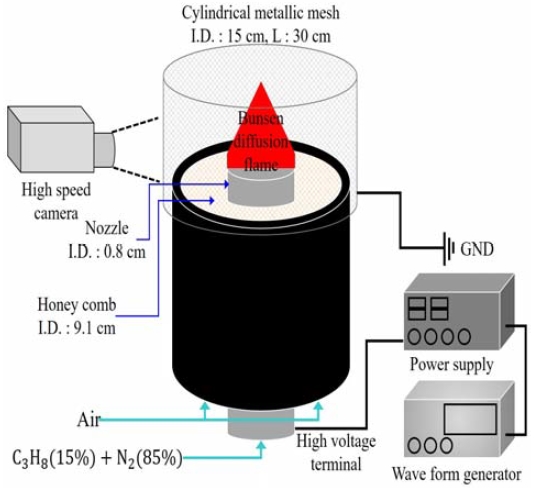
Figure 1 depicts the schematic of the experimental equipment used in this study. The nozzle used in the experiment is composed of stainless steel, which is a conductive material, and its internal diameter and thickness are 0.8 cm and 0.05 cm, respectively. Table 1 lists combustion properties regarding the diffusion flame selected as the default flame. For the default flame, propane and nitrogen are mixed in ratios of 15% and 85%, respectively, and the nozzle exit velocity was set to 8 cm/s. In the theoretical calculation results, the flame propagation velocity (SL) is 22.4 cm/s, and the adiabatic flame temperature (Tad) is 2050 K. For these experimental conditions, a nozzle diameter of less than or equal to 1 cm, low nozzle exit velocity , and high nitrogen dilution rate are selected to reduce the oscillations induced by soot flame [11], so that increasing the flame visualization resolution by decreased soot volume fraction. Furthermore, the Co-flow is used for the prevention of external disturbances. Acetal resin, which is a nonconductor, is used as the material, and the internal diameter is 9.1 cm. Air is selected as the Co-flow gas with the flow velocity fixed at 5.6 cm/s. All gas flows are supplied by the mass flow controller (MFC). The images of flame behavior are captured using a high-speed camera.
A metallic mesh with an internal diameter of 15 cm, length of 30 cm, and lattice size of 1 x 1 cm is installed around the Co-flow burner to form a radial-type electric field in the flame propagation direction. Direct current (DC) voltage is applied to the nozzle by setting the voltage to ±2, ±5, and ±10 kV, and the ground is installed on the radial-type mesh.
3. Results and Discussion
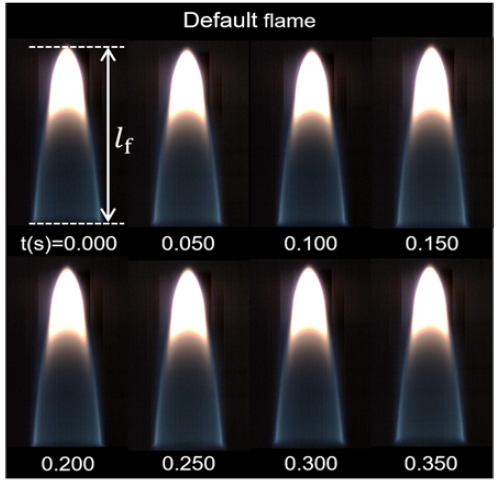
Figure 2 shows temporal images of diffusion flames produced with a 15% and 85% mixture ratio of propane and nitrogen, respectively, which were selected for the default flame. As shown in the figure, a stable state was maintained without any combustion instability. Here, the measured length of the default flame was 3.8 cm. In the analysis results of the images captured during a 5 s duration, the changes in the flame length were within ±0.1 cm. Therefore, this study assumed that the default flame was a stable attached flame.
Figure 3 illustrates the flame stability map by three Regime according to the flame behavior change caused by the applied voltage and the polarity change. Here, the applied voltages were expressed on the horizontal axis and the polarities of the voltage were expressed on the vertical axis. The following three types of characteristic flame behavior changes were observed:
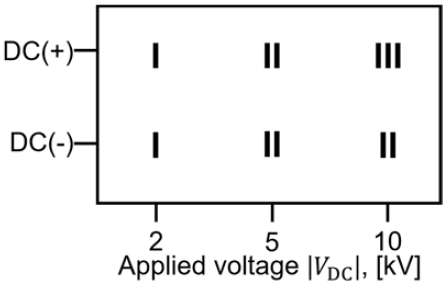
Stability map as a function of the applied voltage and polarity change; I: Stable flame, II: Unstable flame, III: Flame extinction.
I: Stable flame
II: Unstable flame
III: Flame extinction
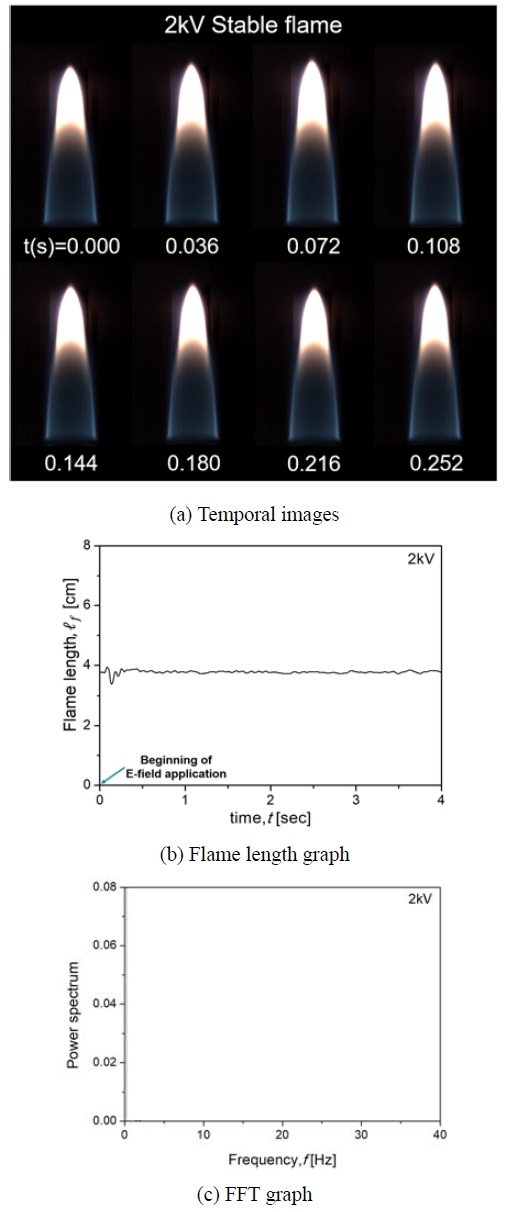
First, Regime I corresponds to a stable flame identical to the default flame. It is a flame that is constantly maintained and does not undergo changes in the flame length over time, even when an electric field is applied. Figure 4 (a) shows temporal flame images at +2 kV. Figure 4 (b) presents the graph for the peak height of the flame measured with respect to time, using MATLAB coding.
At the same time as the electric field was applied, flame oscillations with small amplitudes were observed until the applied voltages are fully developed, but the flame stabilized as time elapsed. As shown in Figure 4 (c), from the results of examining the changes of the flame peak using Fast Fourier Transform (FFT) analysis, no specific frequency was derived because the flame was stable.
However, Regime I was not observed at –2 kV. Therefore, it was concluded that because the voltage applied to the flame was not high, the field intensity existing between the flame and the electrode was insufficient for charge transfer. Therefore, it was inferred that flame fluctuation caused by ionic wind was not observed, and a stable flame was observed.
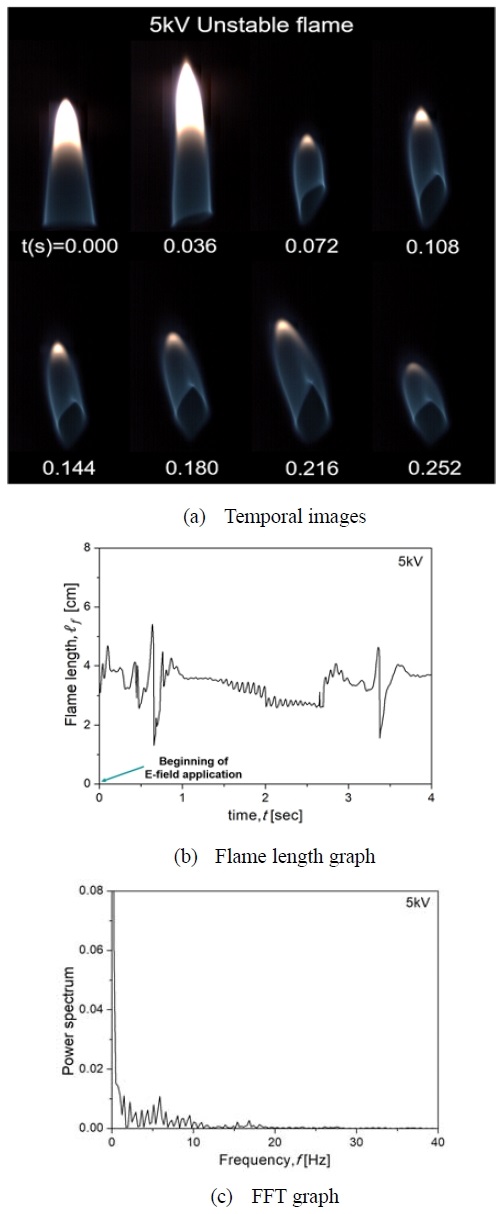
In Regime II, flame fluctuations occurred because of an unstable flame. Figure 5 (a) shows temporal flame images at +5 kV. As shown in the figure, 0.072 s after applying the electric field, the flame tilted significantly towards one side. Furthermore, the flame changed irregularly over time, as confirmed in Figure 5 (b), which shows that the height of the flame peak changes with respect to time. Likewise, as confirmed in Figure 5 (c), which shows the FFT result, a specific frequency was not derived because the flame fluctuation did not exhibit a constant cycle.
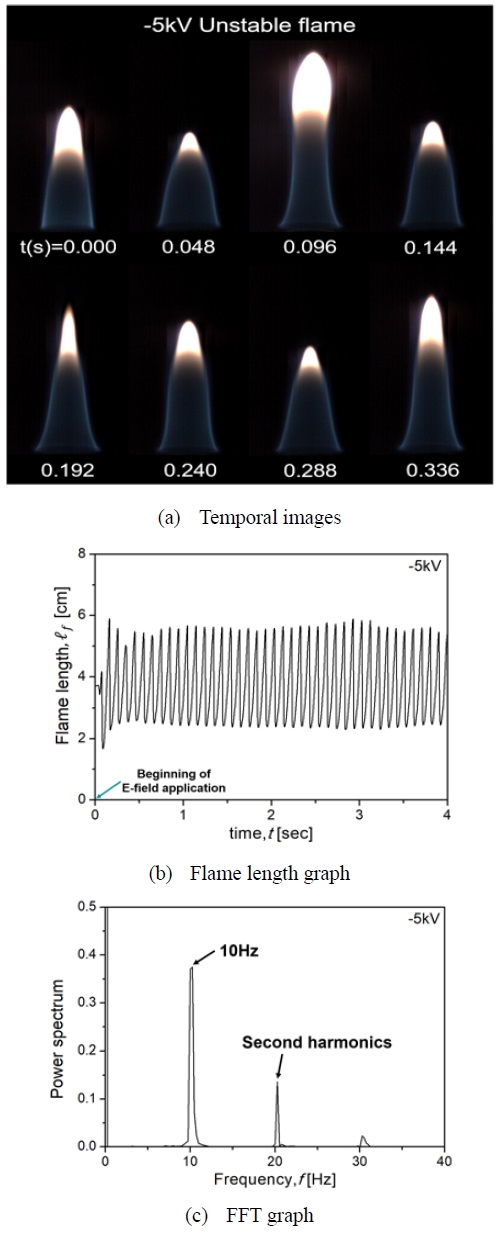
Figure 6 (a) shows temporal flame images at –5 kV, which have certain cycles and oscillate to the axial direction. As shown in Figure 6 (b), oscillations regularly occurred with respect to time. Figure 6 (c) shows the FFT analysis results of the edge flame graph, and the oscillation cycle was derived to be approximately 10 Hz, which seemed to be the vortex phenomenon caused by the negative flow velocity due to the positive ions produced in the reaction zone in the flame.
Next, the number density of positive ions and electrons will be discussed to examine the flame behaviors with specific cycles in more detail. Equal amounts of positive and negative changes are generated, excluding neutrons that account for the majority of number densities in hydrocarbon flames. Here, the generation ratio of electrons, which corresponds to negative charges, and negative ions is approximately 9:1. Therefore, existing papers usually show interest in the distribution of positive ions and electrons, excluding negative ions. Particularly, because electron mobility is about 1,000 times higher than that of positive ions, the residence time of electrons moving from the flame to the anode is relatively short compared to the time required for positive ions to reach the cathode. If a negative voltage is applied on the nozzle, positive ions move to the nozzle side, and electrons move to the metallic mesh around the Co-flow. Positive ions cause an ionic wind through momentum diffusion of neutrons, which account for most of the number densities. However, electrons cause a relatively weak ionic wind compared to ions because of their high mobility. In the case of –5 kV, a negative flow velocity occurs due to the strong ionic wind blowing to the nozzle side. Consequently, oscillations with a specific cycle occur because of the internal vortex. By contrast, in the case of +5 kV, where a positive voltage is applied to the nozzle, electrons move from the flame to the nozzle, and positive ions move to the metallic mesh surrounding the Co-flow. Because of high mobility, electrons move to the nozzle relatively fast but take a relatively long time when moving to the metallic mesh surrounding the Co-flow. Afterward, positive ions move stagnantly toward the metallic mesh, and it can be said that the spatial number density of positive ions is high. Therefore, an ionic wind blows in one direction, and thus stabilizes the flame.
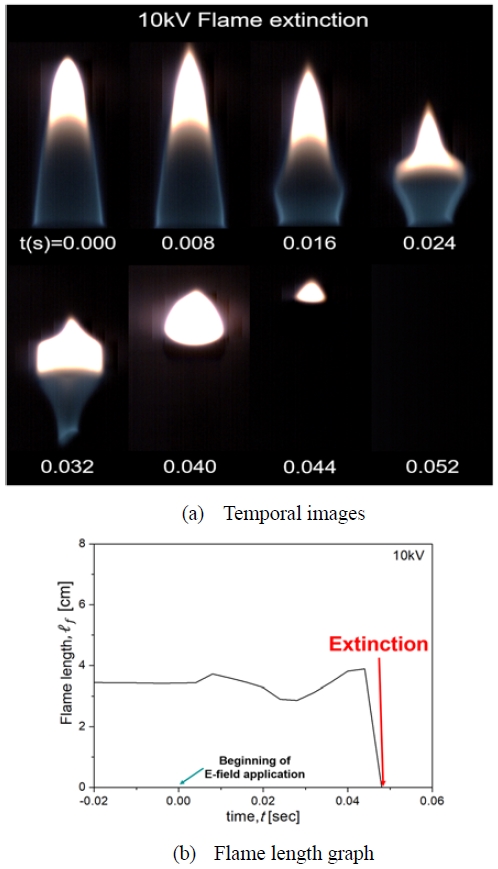
Finally, the flame extinguishing phenomenon of Regime III was observed at +10 kV only. As soon as the electric field was applied, the flame shrunk and grew once or twice repeatedly in the axial direction, and immediately afterward, was extinguished. Figure. 7 (a) shows temporal flame images at +10 kV. Figure. 7 (b) presents a graph showing the height of the edge flame with respect to time. As confirmed in the figure, the flame was extinguished in 0.052 s after applying the electric field. Likewise, because of the stagnation of positive ions in the hydrocarbon flame, a relatively large-magnitude ionic wind occurred from the flame to the edge of the Co-flow. Hence, mass outflow in the flame intensified, thereby producing a significant deformation on the flame surface, leading to the extinguishing of the flame.
However, Regime II was observed at –10 kV, unlike +10 kV. As mentioned above, because positive ions of a relatively high number density moved to the muzzle side, they participated in the combustion reaction inside the flame, in contrast to +10 kV, at which they flowed to the outside of the flame. Therefore, in the case of –10 kV, it was deduced that the rate of the chemical reaction increased locally and contributed to the flame stabilization.
4. Conclusion
A radial-type electric field was applied on Co-flow propane diffusion flames in the direction of the flame propagation, and the dynamic behavior changes of the flame were observed. Three types of characteristic flame behavior occurred according to the applied voltage intensity and polarity.
(1) I: a stable flame was observed for the low voltage condition, and this occurred because the intensity of the field existing between the flame and the electrode was not sufficient for the movement of charges.
(2) II: an unstable flame was observed at ±5 and –10 kV, and this occurred because of the asymmetric structure of ionic wind caused by the mobility difference of ions and electrons.
(3) III: fire extinguishing was observed at +10 kV only. This phenomenon occurred because as positive ions moved to the metallic mesh surrounding the Co-flow, the outflow of mass to the outside of flame became severe.
Acknowledgments
This work was supported by the National Research Foundation of Korea (NRF) grant funded by the Korea government (MSIT) (No. 02018R1C1B5086432).
Author Contributions
Conceptualization, S. H. Yoon; Methodology, S. H. Yoon; Formal Analysis, Y. M. Kim; Investigation, Y. M. Kim; Resources, Y. M. Kim; Data Curation, Y. M. Kim; Writing—Original Draft Preparation, Y. M. Kim; Writing—Review & Editing, S. H. Yoon; Visualization, Y. M. Kim; Supervision, S. H. Yoon; Project Administration, S. H. Yoon; Funding Acquisition, S. H. Yoon.
References
- J. Lawton and F. J. Weinberg, Electrical Aspects of Combustion, Oxford University Press, 1969.
- F. J. Weinberg, Advanced Combustion Methods, Academic Press, 1986.
-
S. M. Lee, C. S. Park, M. S. Cha, and S. H. Chung, “Effect of electric fields on the liftoff of non-premixed turbulent jet flames,” IEEE Transactions on Plasma Science, vol. 33, no. 5, pp. 1703-1709, 2005.
[https://doi.org/10.1109/TPS.2005.856414]

-
M. S. Cha, S. M. Lee, K. T. Kim, and S. H. Chung, “Soot suppression by nonthermal plasma in coflow jet diffusion flames using a dielectric barrier discharge,” Combustion and Flame, vol. 141, no. 4, pp. 438-447, 2005.
[https://doi.org/10.1016/j.combustflame.2005.02.002]

-
S. H. Won, S. K. Ryu, M. K. Kim, M. S. Cha, and S. H. Chung. “Effect of electric fields on the propagation speed of tribrachial flames in coflow jets,” Combustion and Flame, vol. 152, no. 4, pp. 496-506, 2008.
[https://doi.org/10.1016/j.combustflame.2007.11.008]

-
M. K. Kim, S. K. Ryu, S. H. Won, and S. H. Chung, “Electric fields effect on liftoff and blowoff of nonpremixed laminar jet flames in a coflow,” Combustion and Flame. vol. 157, no. 1, pp. 17-24, 2010.
[https://doi.org/10.1016/j.combustflame.2009.10.002]

-
M. K. Kim, S. H. Chung, and H. H. Kim, “Effect of electric fields on the stabilization of premixed laminar bunsen flames at low AC frequency: Bi-ionic wind effect,” Combustion and Flame, vol. 159, no. 3, pp. 1151-1159, 2012.
[https://doi.org/10.1016/j.combustflame.2011.10.018]

-
D. G. Park, S. H. Chung, and M. S. Cha, “Bidirectional ionic wind in nonpremixed counterflow flames with DC electric fields,” Combustion and Flame, vol. 168, pp. 138-146, 2016.
[https://doi.org/10.1016/j.combustflame.2016.03.025]

-
D. G. Park, S. H. Chung, and M. S. Cha, “Visualization of ionic wind in laminar jet flames,” Combustion and Flame, vol. 184, pp. 246-248, 2017.
[https://doi.org/10.1016/j.combustflame.2017.06.011]

-
S. H. Yoon, B. H. Seo, J. Park, S. H. Chung, and M. S. Cha, “Edge flame propagation via parallel electric fields in nonpremixed coflow jets,” Proceeding of the Combustion Institute, vol. 37, no. 4, pp. 5537-5544, 2019.
[https://doi.org/10.1016/j.proci.2018.06.026]

-
V. R. Katta, W. M. Roquemore, A. Menon, S. Y. Lee, R. J. Santora, and T. A. Litzinger, “Impact of soot on flame flicker,” Proceeding of the Combustion Institute, vol. 32, no. 1, pp. 1343-1350, 2009.
[https://doi.org/10.1016/j.proci.2008.06.152]


