Real time fault detection and diagnosis system for onboard engine room
Copyright © The Korean Society of Marine Engineering
This is an Open Access article distributed under the terms of the Creative Commons Attribution Non-Commercial License (http://creativecommons.org/licenses/by-nc/3.0), which permits unrestricted non-commercial use, distribution, and reproduction in any medium, provided the original work is properly cited.
Abstract
Experts of ship technology have varied definitions of smart ships. Some consider a smart ship to be an autonomous ship, while others define it as an eco-ship with smart technology. Currently, shipbuilders and shipping companies need to urgently cope with environmental regulations related to NOx tier III, CO2 Phase 2(EEDI and EEOI), and ballast water management, etc. These entities aim to solve these types of problems using smart technologies such as ICT, IoT, M2M, big data analysis, and intelligent technology. The most important aspect of a smart ship is the ability to transport valuable cargo safely, while reducing operating expenses and complying with IMO environmental requirements. A necessary functionality of autonomous or smart ships is real-time fault detection and diagnosis of machinery systems. This paper shows that real-time fault detection and diagnosis can be achieved by the proposed method using real-time ship maneuvering data. This study used maneuvering data from ships’ engine logbooks.
Keywords:
Fault detection and diagnosis, Real time fault detection, Ship’s engine logbook, Real-time ship maneuvering data1. Introduction
Shipbuilders and shipping companies must follow environmental regulations related such as NOx tier III, CO2 Phase 2 (EDI and EEOI) and ballast water management, etc. These organizations intend to solve these types of problems using smart technology, such as ICT, IoT, M2M, big data analysis, and intelligent technology. The most important requirement of smart ship is that valuable cargo must be transported safely, while reducing operating expenses and complying with IMO environmental requirements. One of the necessary functionalities of an autonomous or smart ship is real-time fault detection and diagnosis of machinery systems.
Recently it is very popular to use technologies such as AI, neural networks and big data analysis; however, these solutions do not provide real-results of fault detection and diagnosis, as well as requiring necessary big and different data sets to train and test the system. Even for the same machine, output measurements that can be used as factors to check for faults vary according to the operation and installation environment. Especially in ship operation, the fault status changes with respect to sea state and loading condition. In a smart ship, it is necessary to detect faults in real-time and obtain recommendations on how to fix the fault. The combustion process inside the cylinder is one of the primary reasons for faults in diesel engines. The combustion status in the cylinder affects the output of the engine, causes fluctuation of RPM, and results in faults being propagated to other parts. As it is very difficult to measure the explosion pressure of the cylinder in order to check the combustion status inside the cylinder in real-time, the temperature of the exhaust gas and the pressure of scavenging air are measured and compared with those of other cylinders. This study improves the fault detection and decision algorithms developed in previous studies [1]-[4] for consideration of real time fault detection and diagnosis. The fault detection algorithm of a previous study employed rule based fuzzy inference by using the standard deviations (SDs) of all related measurement items. For example, to detect and decide cylinder fault, related items are the main engine (M/E) load, scavenging air pressure and temperature, turbo charger (T/C) output temperature and RPM, and cylinder exhaust gas temperature. A large amount of time is required to apply the fuzzy rule based model to all these parameters and the model is difficult to be implemented in real time. Furthermore, because the load or RPM of the M/E is related to all of the above parameters, it is found that only the detection of the moving SD (MVSD) of the load or RPM of the M/E is effective for detecting cylinder faults using statistical experiments with various real ship data. This paper proposes the real-time detection of faults and confirms the use of a decision making process, especially in diesel engines, by using real operating data from ships’ engine room log books.
2. Structure of real-time fault detection and diagnosis system
2.1 Characteristics of exhaust gas temperature of cylinder
The exhaust gas temperature of the main diesel engine and generator engine were obtained as time series data from the engine log book. Table 1 summarizes details of the ships used in this study. Relatively new and old ships and various types of engines were used to comprehensively understand the engine characteristics.
Table 2 presents the statistical analysis of the M/E exhaust gas temperature of N_MS.
As shown in Table 2, the standard deviation of the No. 2 cylinder exhaust gas temperature was large in comparison with those of other cylinders. This implies that the temperature of this cylinder varies largely and the combustion is not even. There are several possible reasons that can explain the large variation in exhaust gas temperature; however, it is suspected that the spray of fuel or the exhaust gas valve and piston ring conditions are the most likely reasons. These types of value should be compared in the long term and it must be evaluated if the variation range is within a certain range. If the combustion statuses of other cylinders are similar, then the Pearson correlation coefficient (CC) of each cylinder should also be within a similar range. Table 3 shows the relation of Pearson correlation coefficient with other cylinders.
The CC of the exhaust gas temperature for M/E cylinder No. 2 was much lower than the CCs of other cylinders. This indicates that the combustion status of the No. 2 cylinder may be unstable and the combustion characteristics of the cylinder may be different than those of other cylinders. It is necessary to carefully observe the change in cylinder No. 2.
Table 4 and Table 5 show the descriptive statistic No. 1 & 2 G/E of this ship.
The standard deviation of the No. 5 cylinder was slightly higher than that of others; thus, its CC was compared with that of each cylinder. The CC comparison of No. 1 G/E is shown in Table 5. The lowest CC related with cylinder No. 5 was that related with cylinders No. 3 and No. 6. However, the CC was very high with respect to the significance level of 0.01; thus, the trends of CC change must be checked.
Table 6 shows statistical analysis for No.2 G/E. In comparison with that of No.1 G/E, SD of No.2 G/E is higher than that of No. 1 G/E.
The average exhaust gas temperature and SD of the No. 4 cylinder was highest in comparison with that of others; the combustion of the No. 4 cylinder was suspicious. Investigation of CCs is shown in Table 7. As shown in Table 7, low CCs were related with cylinders No. 4 and No. 2, and with cylinders No. 1 and No. 2. Thus, it is important to observe the trends of cylinders No. 2 and No. 4.
With the above investigation using statistical calculations of exhaust gas temperature, the combustion status inside each cylinder can be observed. In a diesel engine, abnormal combustion can occur due to various reasons such as lack of scavenging air and compression pressure, condition of piston ring, exhaust valve, fuel valve and fuel, lubrication of cylinder liner, and carbon deposit.
These reasons may be the cause and the results of reasons, because the reasons and results are to related each other. These reasons may be found using a fault diagnosis tree and decision making tree tracking phenomena. Therefore, it is very important that faults can be detected while engines are running.
If descriptive statistical analysis can be conducted using time series data from the alarm monitoring system (AMS), faults can be detected as shown in above investigation. Descriptive statistical analysis can be conducted using the following equations.
| (1) |
| (2) |
where,
| (3) |
| (4) |
where,
2.2 Structure of real time fault detection system
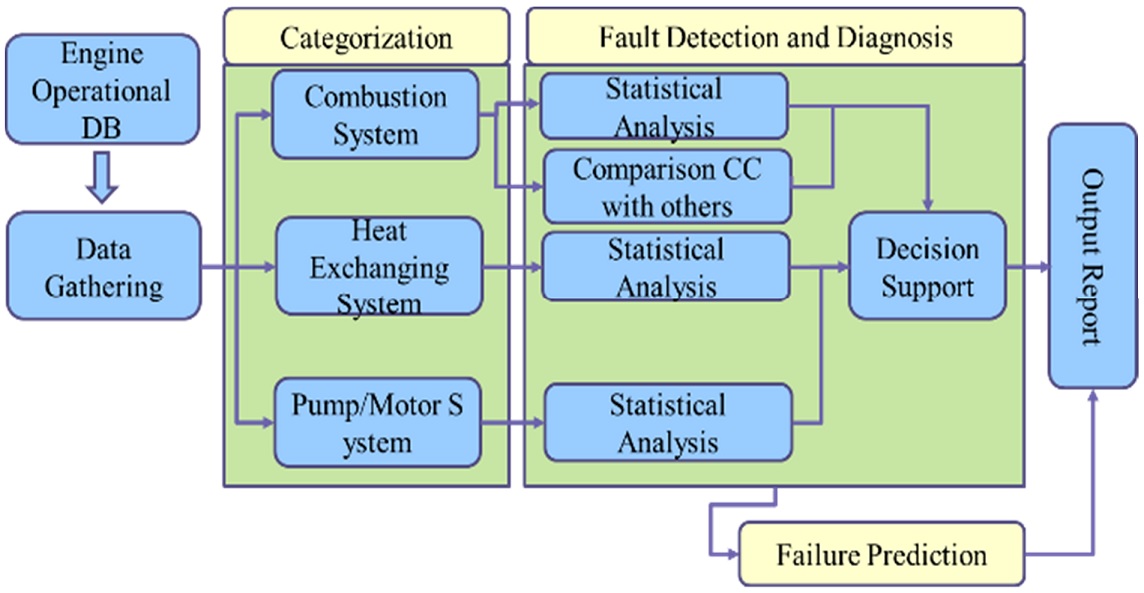
Engine room data can be categorized into the combustion system of the diesel engine such as exhaust gas temperature, T/C input and output gas temperature, and heat exchangers, including cooler and heaters, and pumps and motor to circulate cooling fluid. Data can be input in real time series from the network via AMS or data files from the database. These data can be input separately for each categorized fault detection system, as shown in Figure 1. The fault detection system detects fault from time series data using descriptive statistics. If the detected fault is confirmed with respect to relationships with other cylinders, then diagnosis is performed by the diagnosis and decision making tree. If the degree of degradation is obtained, fault prediction can be estimated.
Even if the same type of machinery is installed and operated, the value of CC of each measurement may be different depending on the ship. Thus, it is necessary to decide the proper value of CC to be considered as a fault.
2.3 Fault detection algorithm
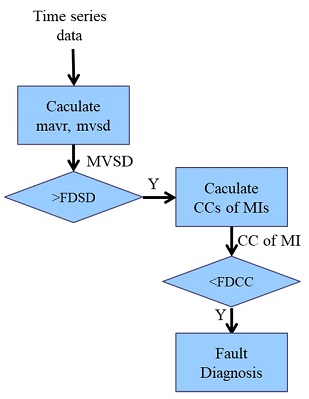
Time series data were input to the fault detection component shown in Figure 1 separately depending on their type. Each fault detection component calculates the moving average (MAVR) and moving SD (MVSD) for each type of data. When the MVSD is over the predetermined value (i.e., the fault detection SD (FDSD)), the CC between each measurement item is calculated. For example, for the main engine, the load or RPM is related to the output of each cylinder because the combustion of the cylinder is resulted in output of cylinder. To detect faults in the cylinder, the MAVR and MVSD of the load or RPM are continuously calculated. When the MVSD of load or RPM is over the FDSD, the CCs of exhaust gas temperature are calculated for all cylinders to identify the CC that is lower than the predetermined value (i.e., FDCC). In case of the generator engine, the load in terms of kilowatts can be used instead of that in terms of RPM, because the generator engine rotates with a constant RPM.
Figure 2 shows the fault detection algorithm. When a fault is detected and remains over a predetermined time, the fault diagnosis system attempts to identify its cause using expert knowledge and a diagnosis tree. The diagnosis tree consists of if-then components and expert judgement and knowledge.
2.4 Fault diagnosis tree with expert judgement and knowledge
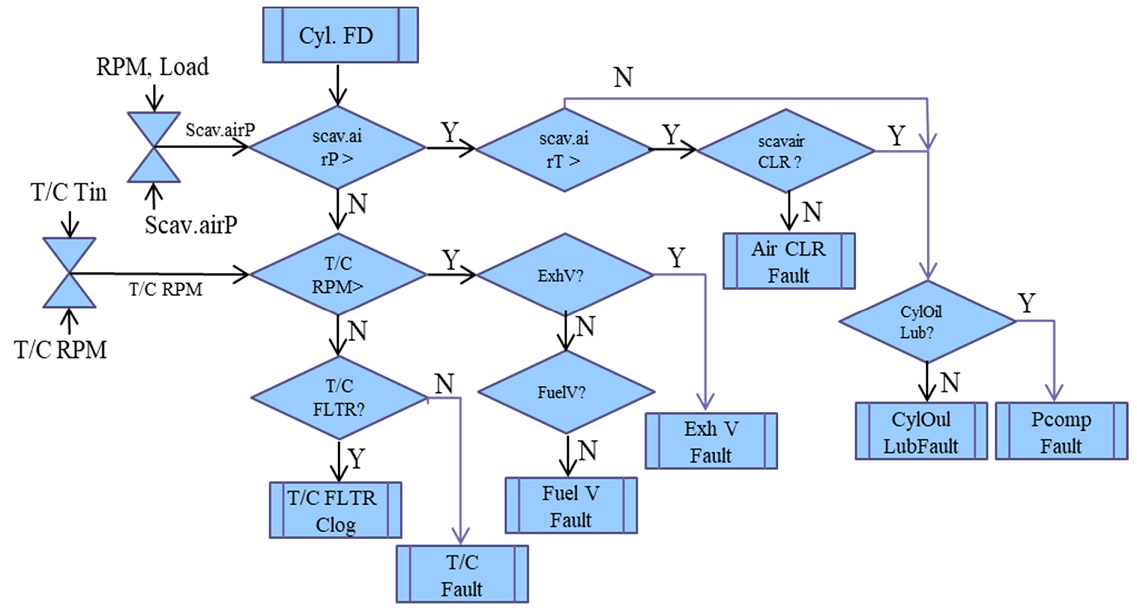
Reasons of faults are composed with various reason and combination of those reasons. To identify out the exact reason, information regarding the fault as well as expert judgement and knowledge are necessary. Figure 3 shows the fault diagnosis tree when the fault detection system detects a specific cylinder fault. The scavenging air pressure is dependent on the RPM or load of the engine; in addition, the T/C RPM is dependent on the temperature of the gas input to the T/C. When the system detects a cylinder fault, values of scavenging air pressure are compared and used to diagnose the fault of the scavenging or turbocharger system.
When the engine rotates at a certain RPM, exhaust gas flows into the T/C. The T/C drives the blower connected to it. The blower creates air pressure to scavenge the cylinder and provide air super charged in the cylinder with fresh air. A scavenging air pressure is properly established by the T/C rotation in a normal case. The engine RPM, T/C RPM, and scavenging air pressure are correlated by the cause of the fault and the result chain. Combustion in the cylinder is related to the quantity of air, the fuel and air mixture in the cylinder, the spray status of the fuel valve, the injection time of the fuel, and the compression pressure, which is related to the status of the piston ring and the lubrication of the cylinder wall. These reasons may be results of combined reasons.
When a cylinder fault is detected, the diagnosis tree confirms whether the scavenging air pressure and T/C rotation are appropriately established. The most significant reasons for cylinder faults are T/C and piston problems. Another reason for unstable combustion could be exhaust and fuel valve leakage, combustion and injection time faults. Because the injection time is principally the most significant reason and can affect all cylinders, cylinder faults can occur frequently due to fuel valve leakage and spray conditions. These types of faults change frequently depending on the conditions. Expert engineers can check their status and plan maintenance measures. Figure 3 shows the series of steps in identifying the reasons behind the faults. If the diagnosis tree finds significant faults such as T/C faults and Pcomp (compressed pressure by piston movement) faults, which involve lack of compression of air in the compression stroke of the piston, then an expert engineer needs to make a decision by comparing and considering more information.
3. Experiments
3.1 Implementation of real-time fault detection and diagnosis system
An automatic real-time fault detection and diagnosis system (RTFDDS) is developed using C++ based on the description in Section 2. The RTFDDS reads data from spreadsheet files, which are acquired from a real ship’s engine logbook during a time period of 6 months, and calculate the MAVR and MVSD. According to the fault detection algorithm described in Figure 2, if the MVSD of the M/E load is over the predetermined value, then the CCs of all cylinders are calculated. If the CC is lower than the predetermined FDCC, then the faulty cylinder can be identified. The system is implemented only on the M/E for the time being and it will be developed in the near future for the G/E, head exchanger, and the system of pumps and motors.
The predetermined value of the MVSD and FDCC are quite different depending on the ship even if the same machine is used. Therefore, the proper degree of value should be investigated and tests should be carried out after onboard installation.
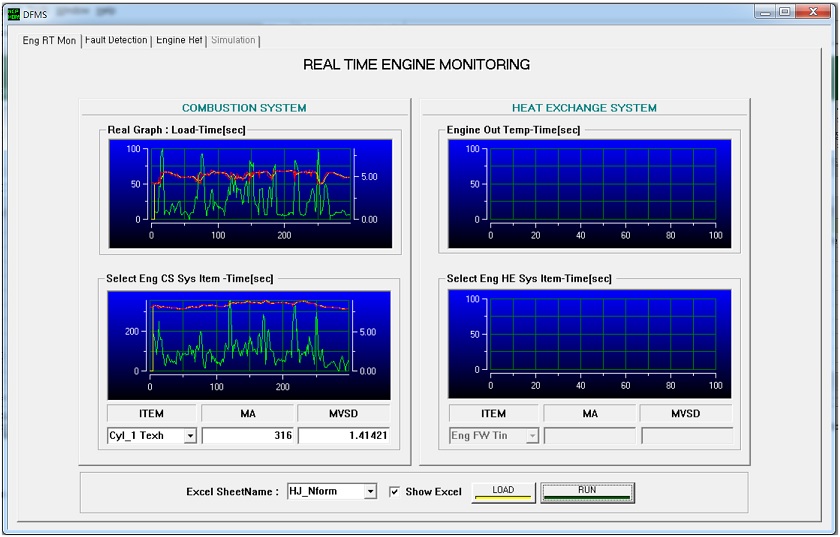
Figure 4 shows how the RTFDDS reads data from the spreadsheet and calculates and displays online raw data (red), MAVR (yellow) values, and MVSD (green) values for a selected item. The upper graph shows the M/E load or RPM and the lower graph shows the selected item, which, in this case, is the exhaust temperature of the No. 1 cylinder.
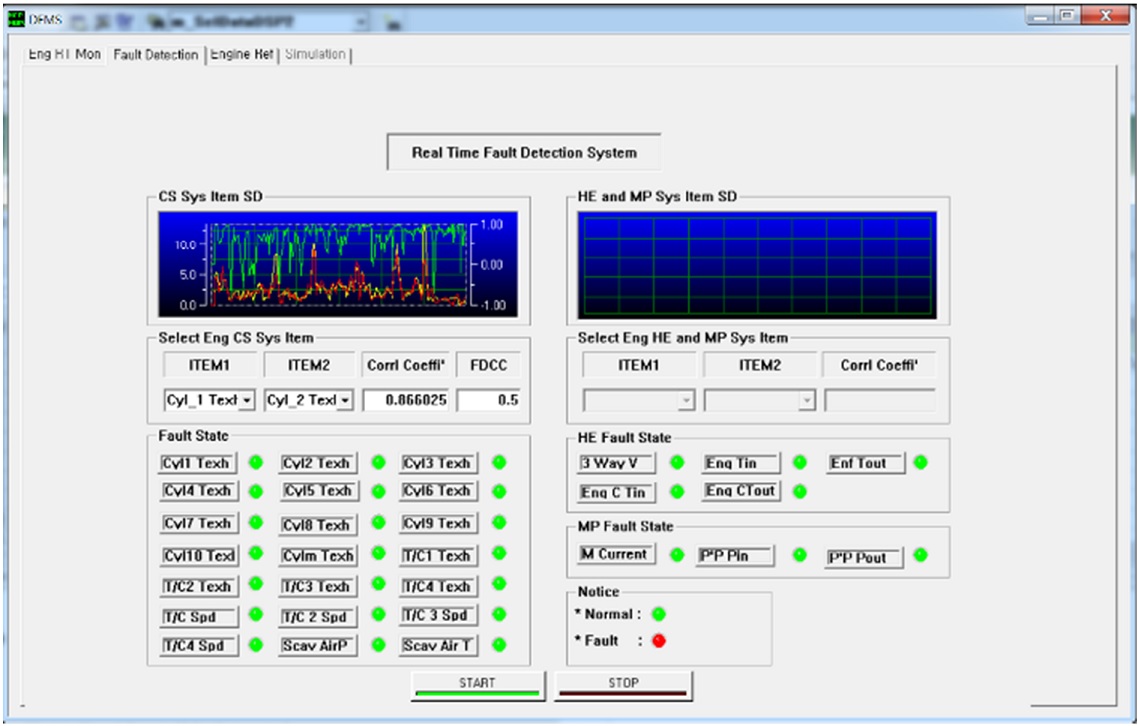
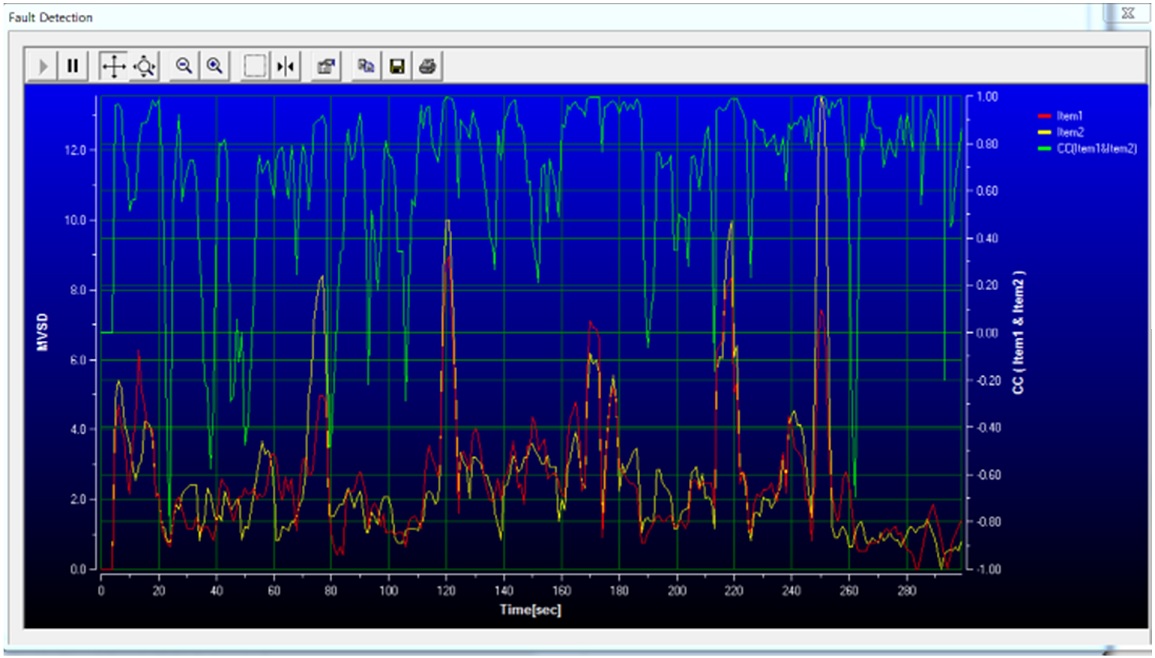
The graph on the left of Figure 5 shows the CC and MVSDs of selected items 1 and 2; however, in reality, the MVSD of the load or RPM for the M/E is calculated continuously in the background and when the MVSD is over the FDSD, the system calculates the CCs of all cylinders.
When the CCs of the cylinders are lower than the FDCC, then the LED lamps shown in the bottom part of Figure 5 turn red. The FDCC can be adjusted by changing the input value as shown in the middle box of Figure 5.
Figure 6 shows an enlarged version of the graph in Figure 5. The graph in Figure 5 only shows the change in the CC for the selected item; however, all the CCs are calculated when the MVSD of the load or RPM of the M/E is over the FDSD in the background of the system.
4. Conclusion
Engine room machineries are mainly categorized as diesel engines and auxiliary machines such as heat exchangers and pumps and motors that circulate fluid for the engine. This paper proposes an improved algorithm for real-time fault detection and diagnosis in engine room machinery based on the results of a previous study. This paper demonstrated fault detection and diagnosis considering combustion inside the cylinder of a diesel engine by calculating the MVSDs and CCs of the engine load or RPM and the cylinder exhaust gas temperature using a statistical analysis of various data from an actual ship.
The developed system will be used to conduct onboard experiments and will be extended to G/Es, heat exchangers, pumps, and motor systems.
To apply the developed system onboard, it is necessary to develop suitable and easy methods to determine the FDSD and FDCC values that depend on the onboard system and the ship considered in future studies.
Acknowledgments
This study is carried out by the support of National Core Cluster R&D Project, and appreciated for support.
This study was carried out as thesis of Ph.D. Y. I. Kim with supervisor of first author of this paper, but revised fault detection algorithm for real time detection. Revised detection algorithm is proved by statistical analysis of more redundant real ship’s log data for commercialization.
This paper is an extension of the 2nd International Conference on Advanced Convergence Engineering (ICACE2019).
Author Contributions
Conceptualization, Y. YU; Methodology, Y. YU; Software, Y. YU and S. R. Baloch; Validation, S. R. Baloch and Y. YU; Formal Analysis, S. R. Baloch; Investigation, Y. YU; Resources, Y. YU and S. R. Baloch; Data Curation, Y. YU and S. R. Baloch; Writing—Original Draft Preparation, S. R. Baloch; Writing—Review & Editing, Y. YU; Visualization, Y. YU and S. R. Baloch; Supervision, Y. YU; Project Administration, Y. YU; Funding Acquisition, Y. YU;
References
- Y. Kim, H. Oh, Y. Yu, “A study on fault diagnosis for diesel engine by statistical analysis,” Journal of Korean Society of Marine Engineering, vol. 30, no. 2, pp. 247-252, 2006 (in Korean).
- Y. Kim, H. Oh, and Y. Yu, “A development of fault diagnosis system on engine room machineries by analyzing correlation coefficient,” Journal of Korean Society of Marine Engineering, vol. 30, no. 2, pp. 253-259, 2006 (in Korean).
- Y. Kim, The Fault Diagnosis and Prediction System of Marine Diesel Engines Using a Statistical Analysis Method Ph.D. Dissertation, Department of Control Instrument Engineering, Korea Maritime & Ocean (KMOU), Korea, 2005 (in Korean).
- Y. Yu, S. Mo, S. R. Baloch, “A study on the real time fault detection and diagnosis system for onboard engine room,” ISMT2019 (International Symposium on Marine Engineering and Technology 2019), GS07-02, p. 75, BEXCO, Busan, 2019.


