Experimental study on drag reduction characteristics through PIV visualization
Copyright © The Korean Society of Marine Engineering
This is an Open Access article distributed under the terms of the Creative Commons Attribution Non-Commercial License (http://creativecommons.org/licenses/by-nc/3.0), which permits unrestricted non-commercial use, distribution, and reproduction in any medium, provided the original work is properly cited.
Abstract
The fluid force reduction characteristics with respect to changes in the diameter and gap ratios between two cylinders in a flow field were experimentally investigated by installing two cylinders in a circulating tank in which the Reynolds number was maintained at 10,000. The velocity vector fields were examined through flow visualization with particle image velocimetry (PIV). The temporal drag and lift variation measurement results showed that the magnitude of the drag and the amplitude of the lift were reduced when a smaller cylinder was present, as compared to the reference case without the smaller cylinder. The optimum gap ratio for which the drag reduction was the greatest differed with the diameter ratio of the two cylinders. The mean drag coefficient was the smallest when the diameter ratio was 0.4 and the gap ratio was 0.5. The mean absolute values of lift coefficient decreased near the optimum gap ratio in all cases, but this tendency was not observed as the gap ratio increased. PIV visualization showed the correlation between the velocity distribution and drag reduction characteristics of the stagnant region between the two cylinders.
Keywords:
Drag, Lift, PIV, Visualization1. Introduction
Relative motion between a circular cylinder and a fluid generates typical flow patterns, such as stagnation, separation, secondary flows, and periodic Kalman vortices in the wake region. In particular, as the vortex shedding in the cylinder wake region significantly affects the dynamic stability of the flow structure, a lot of research has been conducted on controlling the flow field around a circular cylinder or square prism to improve the dynamic stability and reduce drag. A horizontal plate in the wake region can suppress the turbulence intensity and the deflection of the lower flow. Various studies have reported that the flow separation and reattachment characteristics vary depending on the shape of the structures in the fluid [1]-[6]. Another approach to fluid force control is to install cylinders or splitters upstream of the structure rather than downstream. It has been shown that these additionally installed structures have an important effect on the flow characteristics and fluid force changes [7]-[9]. In this study, experiments were conducted to investigate the effects of the diameter ratio and distance between two circular cylinders arranged in tandem on the lift and drag reduction characteristics around the cylinders. The correlations between velocity distribution and fluid force variation were investigated using particle image velocimetry (PIV) visualization techniques.
2. Experimental Setup and Procedures
2.1 Experimental Model
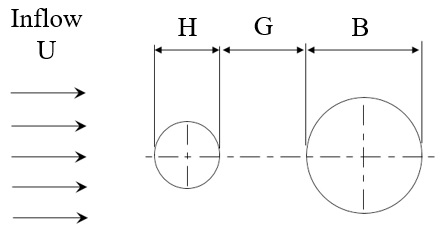
Figure 1 shows a schematic of the experimental model used in this study. An external flow of mean velocity U was formed around two cylinders of different sizes to measure the changes in lift and drag acting on the larger cylinder located downstream, with varying distances G between the two cylinders, and to visualize the flow field around the two cylinders. The drag force D acting on the large cylinder refers to the fluid force component acting in the flow direction, and the lift force L refers to the fluid force component acting in the direction normal to the flow.
2.2 Lift and Drag Measurements
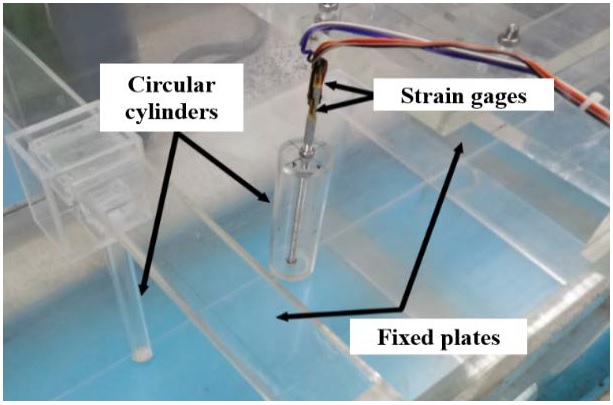
Figure 2 shows the experimental device fabricated for measuring the lift and drag acting on the larger cylinder located downstream. The apparatus consisted of a circular cylinder, a fixed plate, and a measuring axis. The downstream larger cylinder is 50 mm in diameter and 180 mm in height, and the upper and lower covers are made of 10 mm thick acrylic plates. The measuring axis was fabricated by machining an aluminum rod with a diameter of 8 mm and a length of 345 mm. The lower 190 mm of the rod was machined to fix the rod and the cylinder. To measure the fluid force acting on the cylinder, two strain gauges in the flow direction and another two strain gauges in the normal direction were attached to the upper part of the rod, and a bridge circuit was formed to measure the lift and drag from the amount of strain. The output waveforms from the bridge circuit of each of the two channels were transmitted through the strain amplifier and AD converter and then pre-calibrated by a PC.
This study was conducted with an average flow velocity U of 0.182 m/s. The Reynolds number (Re) calculated using the characteristic length B was about 10,000. The diameter B of the large cylinder was fixed at 50 mm. Three cases with different diameters of the small cylinder located upstream H were considered, and the experiments were performed with seven values of G for each value of H as shown in Table 1.
2.3 Lift and Drag Calibration
Equation (1) and Equation (2) show the linear relationships between the strain and the fluid force. After measuring the output voltage (V) generated by applying loads at 0.05 N intervals for the lift (L) and drag (D), the linear relations between the loads and output voltages were obtained using the least-squares method.
| (1) |
| (2) |
2.4 PIV Visualization
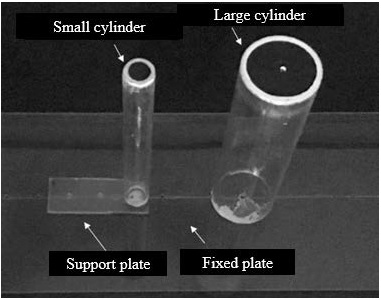
Figure 3 shows the experimental setup for PIV visualization. To perform flow visualization on the experimental model, obstacles entering the field of view of the high-speed camera located in the upper part of the tank must be removed. The size of the cylinder for the visualization was the same as that of the lift and drag experiment. The cylinder was made of a transparent acrylic plate with a thickness of 2 mm.
For each experimental condition, the cylinder was installed in the channel and illuminated by continuous laser light, and the flow field was photographed with a high speed camera vertically down from the top of the cylinder. The tracer particles were polyvinyl chloride (PVC) spheres with an average diameter of 100 μm and a specific gravity of 1.02. The average flow velocity of the visualization circulating tank U = 0.182 m/s, and the Reynolds number (Re), which was calculated by taking the diameter of the cylinder as the characteristic length, was about 10,000, which gave the same conditions as the lift and drag measurement experiment. The continuous shooting time for each set of experimental variables was 16.37 seconds. 2048 frames were obtained at 1/125 second intervals, and 1024 velocity fields were tracked between two consecutive frames at 1/62.5 seconds intervals. The main specifications of the PIV system used in this study are shown in Table 2.
3. Results and Discussion
3.1 Lift and Drag Characteristics
The fluid forces acting on an object due to external flow can be divided into lift and drag according to the direction of action. The drag coefficient CD and lift coefficient CL defined in Equation (3) and Equation (4) can be used to understand the flow characteristics.
| (3) |
| (4) |
The drag force D and lift force L are the fluid force components acting in the parallel and perpendicular directions to the fluid motion around the cylinder, respectively. ρ denotes the density of the fluid and S is the projected area of the cylinder submerged below the surface of the water in the direction of the flow.
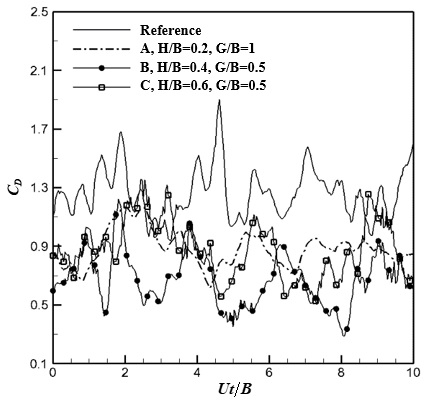
Figure 4 shows the temporal variation of the drag coefficient CD for various H/B ratios, including a reference case without the small cylinder, at the optimal G/B ratio with the maximum drag reduction. The horizontal axis represents a dimensionless time based on the measurement time t, the average flow velocity U, and the diameter B of the large cylinder. Experimental data points were obtained at 0.01 second intervals for 10.24 seconds. Figure 4 shows that the drag acting on the large cylinder was smaller when the smaller cylinder was installed compared to the reference case. It is observed that the temporal variations of the drag coefficient have a constant period. However, the magnitudes of the drag coefficient variation for different H/B ratios do not show much difference.
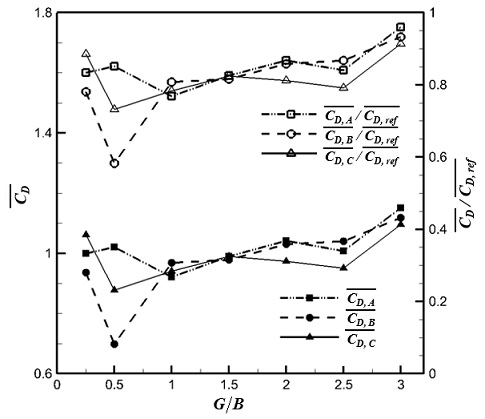
Figure 5 shows the variation of the mean drag coefficient with the change of G/B ratios for various diameter ratios H/B of the two cylinders. The mean drag coefficient is the simple average of the drag coefficients calculated using Equation (3) from the 1024 data points. The mean drag coefficient decreased at all G/B ratios when a small cylinder was installed upstream of the large cylinder. The trends in the variation of mean drag coefficient with G/B are similar for various H/B ratios.
Table 3 shows the ratios of the mean drag coefficient at the optimum G/B ratio to the mean drag coefficient of the reference case. The optimal spacing of the two cylinders was the largest when the diameter of the small cylinder was the smallest. This is considered to be related to the size of the wake region formed by the small cylinder. In other words, the pressure difference between the upstream and downstream of the large cylinder was influenced by the stagnant region formed between the two cylinders, which means that there is a correlation between the G/B and H/B ratios. In this study, the drag reduction effect was the greatest when H/B = 0.4 and G/B = 0.5, for which is there was a decrease of approximately 41.7% from the reference case.
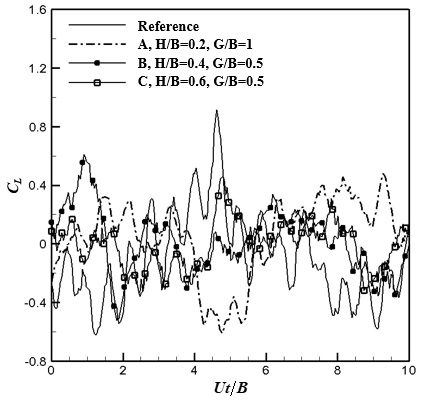
The lift coefficient CL, shown in Figure 6, at the optimum G/B ratio oscillated around zero in all cases, but the amplitude was smaller than the reference case when a small cylinder was installed. This can be understood from the improved dynamic stability of the structure through the reduction of the drag force and lift variation amplitude when the small cylinder was installed upstream of the large cylinder.
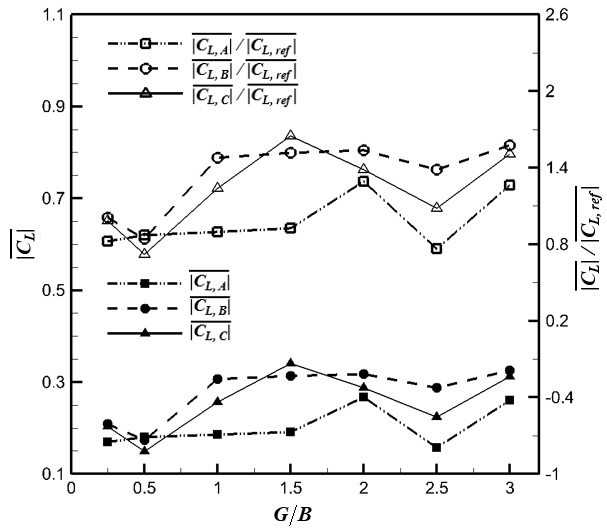
Figure 7 shows the mean absolute value of the lift coefficient for various diameter ratios H/B of the two cylinders and the decrease in relative to the reference case. As the experimental model was axisymmetric and the time average of the lift coefficient was almost zero, the absolute value of the lift coefficient was obtained to determine the dynamic stability of the large cylinder. At the optimal G/B ratio, was measured for all H/B ratios smaller than the reference case. However, when H/B = 0.2, the trend in variation of was different from the other values of H/B. At H/B = 0.2, the amplitude of the variation in the mean lift coefficient increased at G/B = 1.5 and above, while at H/B = 0.4 or 0.6, the amplitude increased at G/B = 1.0 and above. In other words, near the optimal G/B, the mean absolute value of the lift coefficient was decreased from the reference case, but when the distance between the two cylinders exceeded a certain value, the mean absolute value of the lift coefficient was hardly affected by the small cylinder. As a result, the lift was less affected than the drag by the wake region of the smaller cylinder located in the upstream of the flow, and the mean lift coefficient changed rapidly near the optimum G/B ratio between the two cylinders. Thus, the positioning of the upstream cylinder is important in order to improve the dynamic stability of the submerged structure.
Table 4 shows the mean absolute values of the lift coefficients at the optimum G/B ratio with the maximum lift reduction, and illustrates how the lift was reduced compared to the reference case. As H/B increased at the optimal G/B ratio, the absolute value of the lift coefficient decreased. In this study, the lift reduction effect was the greatest when H/B = 0.6 and G/B = 0.5, for which there was a decrease of approximately 28% from the reference case.
3.2 Characteristics of Flow Field
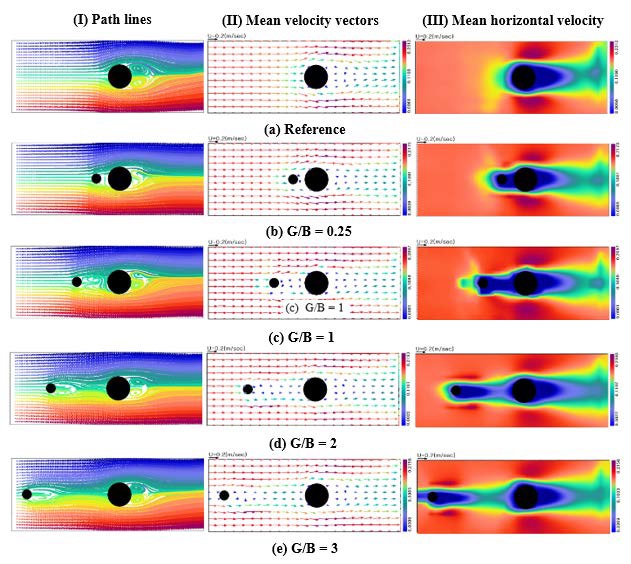
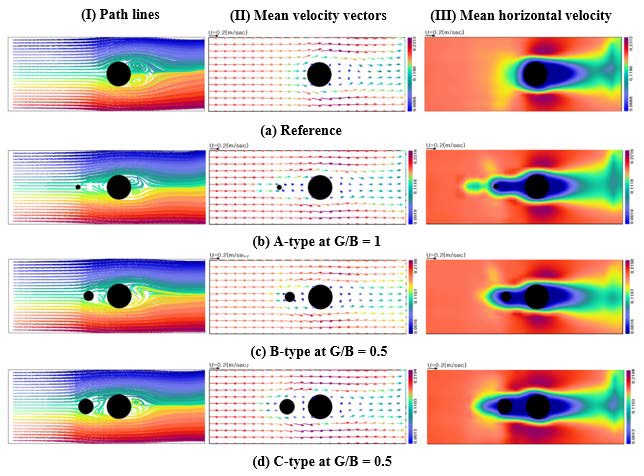
Figure 8 shows the time averaged flow fields around the two cylinders at different G/B gap ratios when the diameter ratio H/B = 0.4. The path lines show that a stagnant region was formed between two cylinders regardless of the G/B ratio. The wakes formed downstream of the large cylinder had similar sizes irrespective of G/B, but the sizes of the stagnant regions depended on the G/B ratio. The mean velocity vector showed a similar distribution in the wake region of the large cylinder irrespective of G/B, and the horizontal velocity component of the flow increased in the stagnant region adjacent to the large cylinder as G/B increased.
Figure 9 shows the time averaged flow fields at the optimal G/B ratio for various H/B ratios. The path lines show that in all cases, vortices existed above and below the large cylinder wake region, and the direction of the vortices were clockwise at the top of the wake and counterclockwise at the bottom. The vortices can be seen more clearly from the mean velocity distribution, where small cylinders were installed and stagnant regions appeared between the two cylinders and in the wake region of the large cylinder. In addition, it can be seen that the size of the stagnant region increased as H/B increased.
4. Conclusion
In this study, the drag and lift reduction characteristics around two cylinders of different diameters arranged in tandem were investigated through experiments, and PIV visualization was performed to determine the flow field characteristics. The flow conditions were fixed at Re = 10,000 and experiments were conducted over the range of gap ratios G/B = 0.25 –3.0 for two cylinders with diameter ratios H/B = 0.2, 0.4, and 0.6.
1) Measurements of the temporal variation of drag and lift show that the magnitude of drag and lift were significantly reduced when a small cylinder was installed upstream of a large cylinder.
2) The optimum gap ratio that maximized drag reduction depended on the diameter ratio of the cylinders, and as the gap ratio increased, the effect of the small cylinder decreased.
3) The average drag coefficient was the smallest when the diameter ratio between the two cylinders was 0.4 and the gap ratio was 0.5, and the drag reduction effect was about 42% compared to the reference case.
4) The mean absolute values of the lift coefficient decreased relative to the reference case near the optimum gap ratio in all cases. Although the trend of the lift coefficient absolute value variation with increased gap ratio is unknown, the absolute value increased compared to the reference case.
5) Through PIV visualization, the shape and size of the stagnant region between the two cylinders could be confirmed, and the correlation between the size and velocity distribution of the stagnant region and the drag reduction characteristics could be identified.
As the fluid force reduction characteristics may differ depending on the Reynolds number, even for the same shape, it is necessary to supplement the experimental results obtained in this study by performing additional experiments in a wide range of Reynolds numbers in a future study.
Acknowledgments
This research was supported by the projects (2017R1C1B5017704) through the National Research Foundation of Korea (NRF) by the Ministry of Science, ICT, and Future Planning (MSIP).
Author Contributions
Conceptualization, J. Kwon and S. Choi; Methodology, J. Kwon; Software, B. Kim; Validation, J. Kwon and S. Choi; Formal Analysis, J. Kwon; Investigation, J. Yang; Resources, S. Choi; Data curation, J. Kwon; Writing-Original Draft Preparation, J. Kwon; Writing-Review & Editing, J. Yang; Visualization, J. Kwon; Supervision, S. Choi; Project Administration, J. Kwon and S. Choi; Funding Acquisition, J. Kwon;
References
-
B. Khalighi, S. Zhang, C. Koromilas, S. R. Balkanyi, Luis P. Bernal, G. Iaccarino, and P. Moin, “Experimental and computational study of unsteady wake flow behind a bluff body with a drag reduction device,” SAE transactions (2001): 1209-1222.
[https://doi.org/10.4271/2001-01-1042]

-
T. Tamura and T. Miyagi, “The effect of turbulence on aerodynamic forces on a square cylinder with various corner shapes,” Journal of Wind Engineering and Industrial Aerodynamics 83, no. 1-3, pp. 135-145, 1999 .
[https://doi.org/10.1016/S0167-6105(99)00067-7]

- W. C. Park, “Effect of the length of a splitter plate on drag reduction,” Transactions of the Korean Society of Mechanical Engineers B, vol. 17, no. 11, pp. 2809-2815, 1993 (in Korean).
-
Con J. Doolan, “Flat-Plate Interaction with the Near Wake of a Square Cylinder,” The American Institute of Aeronautics and Astronautics Journal, Vol. 47, No. 2, pp. 475-478, 2009
[https://doi.org/10.2514/1.40503]

-
K. D. Ro, “Characteristic calculations of flowfield around a square prism having a detached splitter plate using vortex method,” Journal of the Korean Society of Marine Engineering, vol. 37, no. 2, 156-162, pp. 2013 (in Korean).
[https://doi.org/10.5916/jkosme.2013.37.2.156]

-
K. D. Ro, S. M. Yoon, D. H. Choi, J. H. Kim and E. C. Sim, “Drag Reduction on a Square Prism Using a Detached Splitter Plate,” Journal of the Korean Society of Marine Engineering, Vol.36, No.6, pp. 808-813, 2012 (in Korean).
[https://doi.org/10.5916/jkosme.2012.36.6.808]

-
T. Igarashi, “Drag reduction of a square prism by flow control using a small rod,” Journal of Wind Engineering and Industrial Aerodynamics 69, pp. 141-153, 1997.
[https://doi.org/10.1016/S0167-6105(97)00150-5]

-
H. Sakamoto, K. Tan, N. Takeuchi, and H. Haniu, “Suppression of Fluid Forces Actiong on a Square Prism by Passive Control,” Journal of Fluids Engineering, Vol. 119, pp. 506-511, 1997.
[https://doi.org/10.1115/1.2819273]

- K. D. Ro, C. W. Kang, and K. H. Park, “Characteristics of Fluid Force Reduction for Two Different Square Prisms in a Tandem Arrangement,” Transactions of the Korean Society of Mechanical Engineers B, vol. 41, no. 7, pp. 435-443, 2017 (in Korean).

