Electric power system design and analysis for FLNG vessel
The electrical reliability of the power generation and distribution system of Floating Liquefied Natural Gas vessels has been analyzed according to the operating modes using Electrical Transient Analysis Program in this paper. Electricity is used for the topside processes, cargo pumps for off-loading, thrusters for heading control and marine equipment. It is very important to improve the safety, efficiency, and stability of the electrical power system for successful operation. The voltage variation of the high and the low voltage bus shall be within the primitive limitation range at normal operation loads both in steady state and in the transient state. The power system was simulated and compared with class rule for design verification.
Keywords:
Floating Liquefied Natural Gas, Electrical Transient Analysis Program1. Introduction
The FLNG concept allows energy companies to produce natural gas in more remote areas and in deeper water than would have been economically possible with other technology, like fixed piled structures. Furthermore, it has storage capacity for the natural gas produced and is equipped with an offloading system to transfer it to shuttle tankers for shipment to the shore.
The electrical distribution system of FLNG is quite similar to typical redundant system of FPSOs except liquefaction process is added. It means that the designers consider the hazards of fire and explosion, 24-hours operation, and meeting the needs of the rules and regulations related to oil and gas industry.
The electrical power system is analyzed using ETAP [1]-[8] and the results are compared with IEC standard and the class rule for the design verification [9]-[10]. It shows that the equipment ratings and electrical parameters meet the needs of the rule and regulation requirements.
2. Electric system structure of FLNG
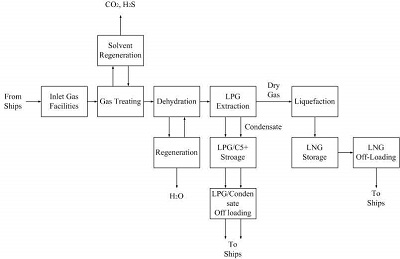
The process is illustrated in the FLNG topsides flow diagram Figure 1. The overall purpose of the facilities is to produce LNG from natural gas and extract LPG and condensate. The feed gas to the processing plant is gas from subsea wells of an offshore gas field. The refrigerant compressors are driven by gas turbines, other equipment is electric motor driven. Power generation is done by dual fuel gas turbines.
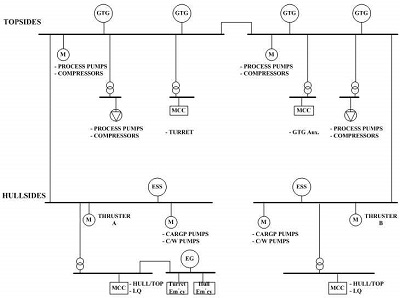
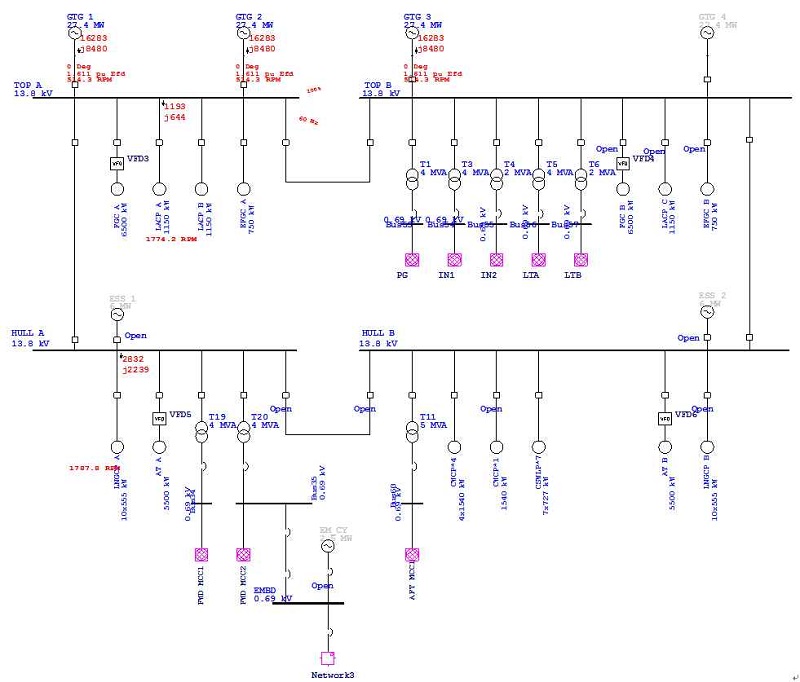
The power generation and distribution system is illustrated in the overall single line diagram Figure 2. The main gas turbine generators supplies electrical power to the electrical consumers through the power distribution network. They supply power to all consumers on the vessel while under normal operation including LNG off-loading. There are two essential generators and they will be run when the gas turbines are not available, during transit or to start the first gas turbine. The process will not be in operation at this time. The essential power will be distributed using the same network as the main power. The emergency generator supplies emergency power to the emergency consumers which are designated by rules and regulations on the vessel.
3. Static characteristic analysis
3.2 Load flow analysis
Load flow analysis performs power flow analysis and voltage drop calculations to get results about bus voltages, power factors, currents, and power flows throughout the electrical system. The simulation was executed based on different operating modes to verify overloading, the stability of the bus voltage, and direction of power flows in this paper.
According to the class requirement of offshore standard, power generation system was designed based on an N+1 basis. In normal operating mode with LNG off-loading three gas turbine generators supply electrical power to the loads and one gas turbine generator is a stand-by. The result of the load flow analysis Table 1.
3.2 Short circuit analysis
Short circuit analysis is performed to analyze the effect of fault currents on electrical power systems. The short circuit analysis makes it easy to go from selecting elements from the comprehensive libraries of short circuit current ratings to performing dozens of different types of short circuit analysis with the purpose of finding the worst-case fault current device duty.
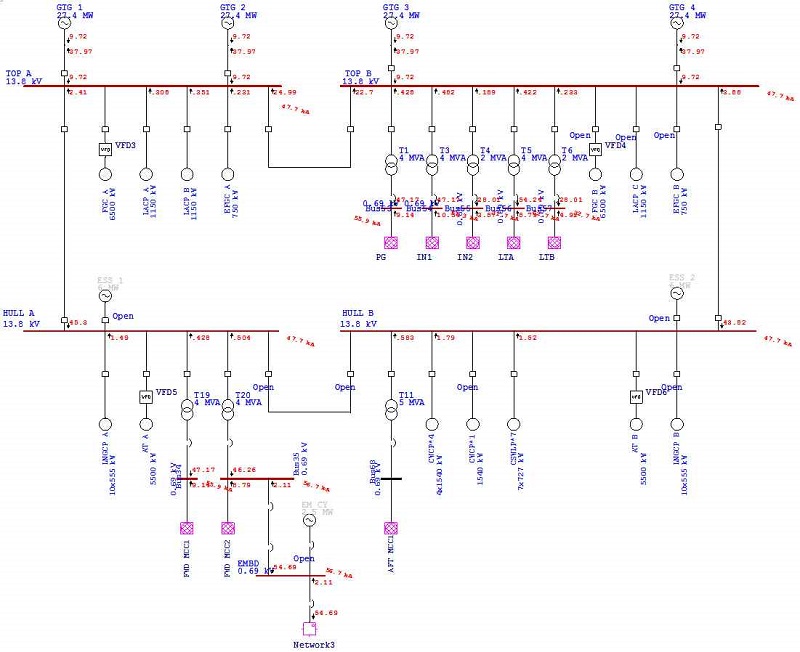
Figure 3 shows short circuit analysis result. The calculated initial system short circuit current on the 13.8kV topside switchgear is 47.7kA rpm and initial system short circuit current on the 690V topside PG switchboard is 55.9 kA. With reference to these values, the short time wit hstanding current and the peak rating of the switchboard are decided. Also, the possibility of changing the alternator reactance can be considered.
4. Dynamic characteristic analysis
4.1 Motor starting analysis
Motor starting analysis calculates the acceleration time of the motor and the voltage impact caused by the starting of the heavy motors on electrical power systems. For motors modeling, ETAP library model was used and the parameters are on Table 2.
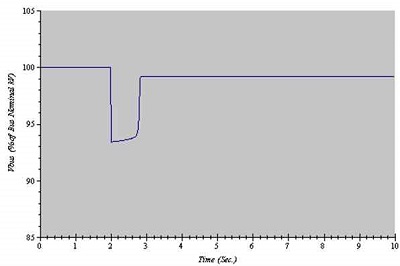
Figure 4 shows motor starting analysis result for LNG cargo pumps. It shows that about 6% voltage drop is occurred when it starts. The transient oper-transient operation can be executed by transient stability analysis which is covered at chapter 4.2.1 of this paper.
4.2 Transient stability analysis
The transient stability analysis calculates the dynamics and transient response of the electrical power system by simulating disturbances and other events according to the load change in different operating modes.
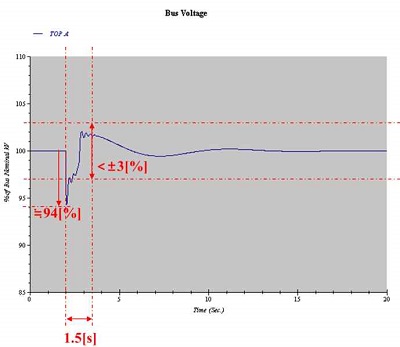
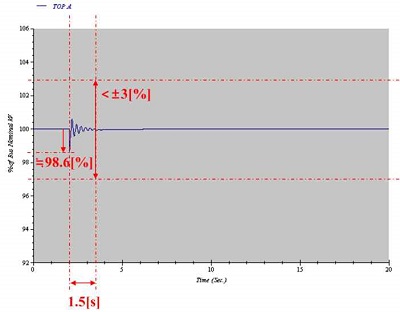
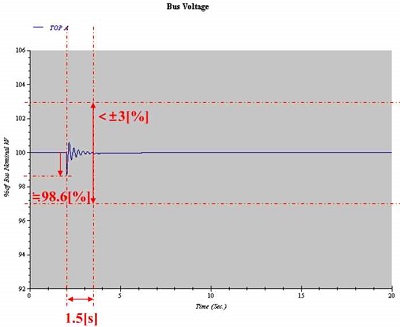
According to the class requirement, the voltage variations on main switchboards are maintained from 85% to 120% of nominal voltage. After a transient condition has been initiated, the voltage in distribution shall not differ from nominal system voltage by more than ±3% within 1.5 s.
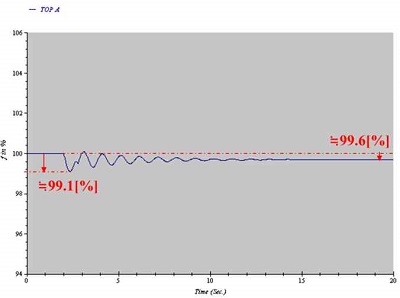
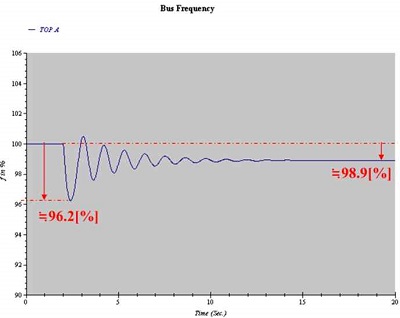
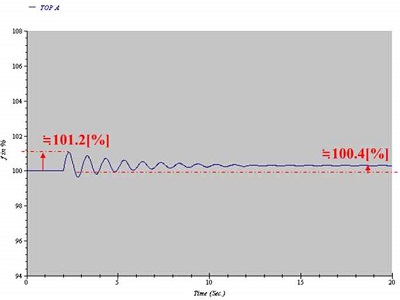
The frequency variations with fixed nominal frequency shall be kept within the following limits 95 to 105% of rated frequency under steady load conditions and 90 to 110% of rated frequency under transient load conditions. Figure 5 shows transient stability analysis result.
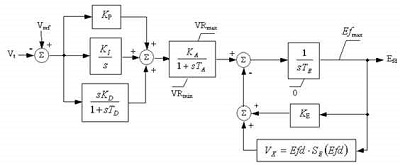
To model the power generation system governor and exciter library from ETAP has been used. Figure 6 shows the block diagram of the exciter and AVR control system model.
Table 3 shows the parameters used for generator exciter model.
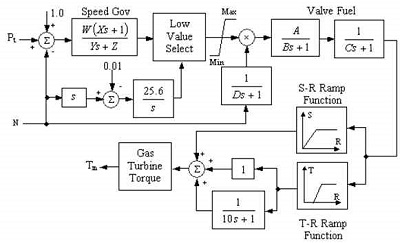
A governor is a device used to measure and regulate the speed of the engine. Figure 7 shows the block diagram of gas turbine governor model.
Table 4 shows the parameters used for generator governor model.
To evaluate the transient response of the generator models three example cases are established and Table 4 shows the established states for transient stability analysis.
All the gas turbine generators are in operation and Liquefied Natural Gas cargo pumps are started in 2 seconds.
5. Conclusions
The electrical reliability of the electrical power system of FLNG vessels has been analyzed in steady and transient state using ETAP. The results were compared with IEC standard and the class rule for the design verification. It shows that the voltage variation of the high and the low voltage bus is within the primitive limitation range.
Acknowledgments
This paper is extended and updated from the short version that appeared in the Proceedings of the International symposium on Marine Engineering and Technology (ISMT 2013), held at BEXCO, Busan, Korea on October 23-25, 2013.
References
- Arthur R. Bergen, and Vijay Vittal, Power Systems Analysis, 2nd edition, Prentice Hall, (1986).
- Craig Cameron, “Integrated power system design for offshore energy vessels and deep water drilling rigs”, IEEE Transactions on Industry Applications, 48(4), p1251-1257, (2012).
- Timothy J. Mc Coy, “Trend in ship electric propulsion”, IEEE, 1, p343-346, (2002).
-
J. V. Amy, and Jr. , “Considerations in the design of naval electric power systems”, IEEE Power Engineering Society Summer Meeting, 1, p330-335, (2002).
[https://doi.org/10.1109/PESS.2002.1043244]

- A. Frank, and Woodbury, “Electrical design considerations for drilling rigs”, IEEE Transactions on Industry Applications, 1A-12(4), p421-431, (1976).
-
R. M. Calfo, J. A. Fulmer, and J. E. Tessaro, “Generators for use in electric marine ship propulsion systems”, Proceedings of the IEEE Power Engineering Society, 1, p254-259, (2002).
[https://doi.org/10.1109/PESS.2002.1043228]

-
P. Patil, and K. Porate, “Starting analysis of induction motor: A computer simulation by ETAP Power station”, Proceedings of the International Conference on Emerging Trends in Engineering and Technology, p494-499.
[https://doi.org/10.1109/ICETET.2009.211]

- “Status and inventions in electrical power and thruster systems for drillships and semi-submersible rigs”, Proceedings of the Dynamic Positioning Conference, p28-30, (2004).
- Won Jeon, Yong-Peel Wang, and Sang-Yong Jung, “Dynamic characteristic analysis at each operating condition for electric ship propulsion system”, Journal of the Korean Society of Marine Engineering, 32(1), p1296-1302, (2008).
-
Won Jeon, Yong-Peel Wang, Jong-Hwa Jeong, Sung-Kak Lyu, and Sang-Yong Jung, “Power characteristic analysis of assumed short circuit instance of electric ship propulsion system”, Journal of the Korean Society of Marine Engineering, 32(2), p323-329, (2009).
[https://doi.org/10.5916/jkosme.2008.32.2.323]

