Empirical study on the application of fuel cell–battery hybrid electric propulsion systems in small coastal ships
Copyright © The Korean Society of Marine Engineering
This is an Open Access article distributed under the terms of the Creative Commons Attribution Non-Commercial License (http://creativecommons.org/licenses/by-nc/3.0), which permits unrestricted non-commercial use, distribution, and reproduction in any medium, provided the original work is properly cited.
Abstract
The International Maritime Organization aims to reduce the total annual greenhouse gas emissions from ships by more than 50% by 2050. South Korea has established the goal of a 37% reduction in global greenhouse gas emissions by 2030, and many studies have been conducted in relation to this. In this study, a diesel fuel propulsion system with the same output as a fuel cell–battery hybrid electric propulsion system was constructed as a test bed to demonstrate the fuel consumption and greenhouse gas emission reduction characteristics of fuel cell–battery hybrid electric propulsion systems. The characteristics of the exhaust emissions and fuel consumption were compared and analyzed under the load profile of actual ships operating in the sea. The exhaust emissions and fuel consumption of the diesel propulsion system installed on the test bed were measured and analyzed, and the economics of the two propulsion systems were evaluated by comparing the hydrogen consumption and price of ships using the fuel cell–battery hybrid system. Furthermore, a hybrid electric propulsion system using a fuel cell and a battery was designed to verify the stability of the ship’s load power system, and its usefulness and applicability to real ships were verified through simulation.
Keywords:
Proton-exchange membrane fuel cell (PEMFC), Lithium-ion battery, NOx, Sox1. Introduction
The International Maritime Organization has established regulations on exhaust emissions from ships to reduce the global greenhouse gas (GHG) [1] and aims to reduce the carbon dioxide emissions per voyage in international shipping by at least 50[%] by 2050. The Ministry of Environment in South Korea has also established the “2030 Greenhouse Gas Reduction Roadmap,” which includes the total permissible amount of GHG for the three years from 2018 to 2020, to achieve the national GHG reduction goal.
To comply with these regulations on pollutant emissions, the shipping industry is reviewing the application of environmentally friendly propulsion systems to replace conventional diesel propulsion systems and is striving to develop electric ship propulsion systems with environmentally friendly energy sources [3][4].
In this study, we compared the environmental and economic characteristics of ships with a fuel cell–battery hybrid system with the same output as a target ship using a diesel engine as its power source. The actual operation load profile of the target diesel engine ship was established through measurements. The nitrogen oxide (NOx) emissions, carbon dioxide emissions, and fuel consumption from the operation of a diesel engine installed on a testbed in accordance with the load profile were measured and compared with those of a ship equipped with a fuel cell–battery hybrid system to demonstrate the superiority of the fuel cell–battery hybrid system. Furthermore, to verify the stability of the ship’s load power system, a hybrid electric propulsion system was designed with a fuel cell and a battery, and its applicability to real ships was verified through simulation.
2. Selection of Target Ship for Applying Fuel cell–battery Hybrid System
In consideration of the output of the fuel cell–battery hybrid system, the passenger vessel “Hansol No. 2,” which operates between Tongyeong Port and Somaemul Island, was selected as the target ship. Table 1 lists the specifications of the target ship. The load profile was analyzed by investigating the operation characteristics of the ship. Then, the exhaust emission components for each engine load of the target diesel ship were measured and converted into masses.
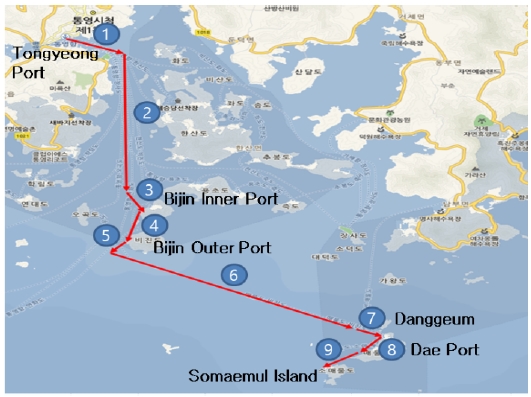
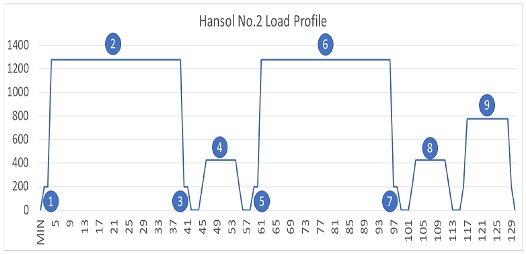
The one-way route from Tongyeong Port to Somaemul Island was divided into 9 sections, as shown in Figure 1, and the actual load profile was derived, as shown in Figure 2.
3. Simulation According to Load Profile
3.1 System configuration
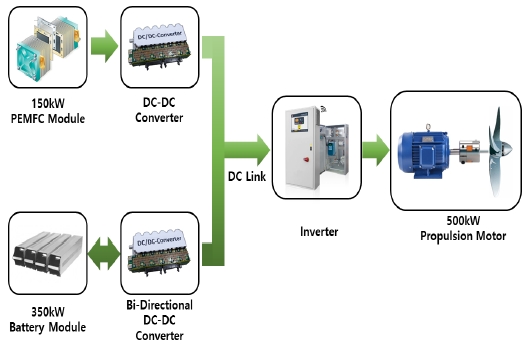
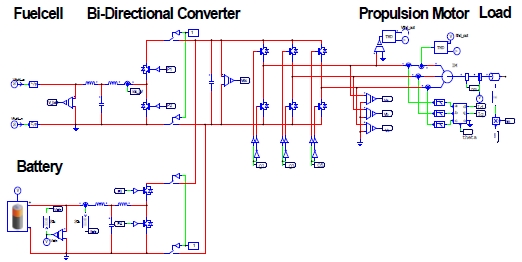
The fuel cell–battery hybrid electric propulsion system was composed of a fuel cell, battery, power converter, and propulsion motor, as shown in Figure 3. For the fuel cell, a low-temperature-type proton-exchange membrane fuel cell (PEMFC) with a 150[kW] output was applied. The battery was a lithium-ion battery with a capacity of 350 [kW].
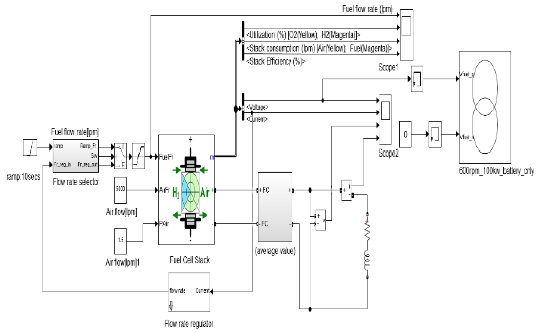
For the fuel cell, which is the power source of the hybrid electric propulsion system, a fuel cell stack and a fuel and air supply control system were designed using MATLAB/Simulink, as shown in Figure 4. The “Simcoupler” tool was used for connection with the power analysis program PSIM. Using PSIM, the propulsion system was set up with a battery, power converter, and propulsion motor, as shown in Figure 5.
3.2 Load profile sections 1, 3, 5, and 7 (only battery mode)
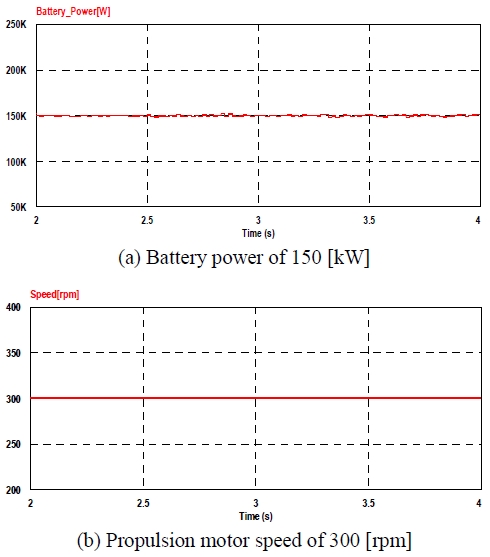
The load profile sections 1, 3, 4, and 5 in Figure 1 and Figure 2 are the sections for arrival, departure, and narrow channel navigation, which require small propulsion power from the ship. Thus, these sections were simulated to make speed changes using only the battery. As shown in Figure 6, the ship was operated with a battery power of 150 [kW], propulsion motor power of 150 [kW], and rotation speed of 300 [rpm] according to the speed load.
3.3 Load profile sections 4 and 8 (only battery mode)
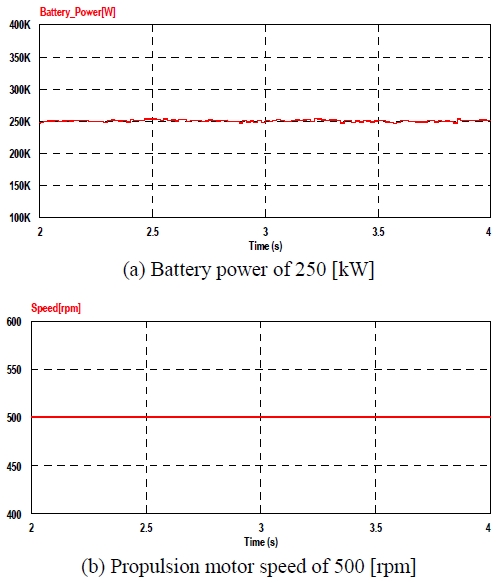
The load profile sections 4 and 8 in Figure 1 and Figure 2 are short-distance low-speed navigation sections. The load profiles of these sections were simulated using the battery only. As shown in Figure 7, the ship was operated with a battery power of 250 [kW], propulsion motor power of 250 [kW], and rotation speed of 500 [rpm].
3.4 Load profile section 9 (fuel cell + battery mode)
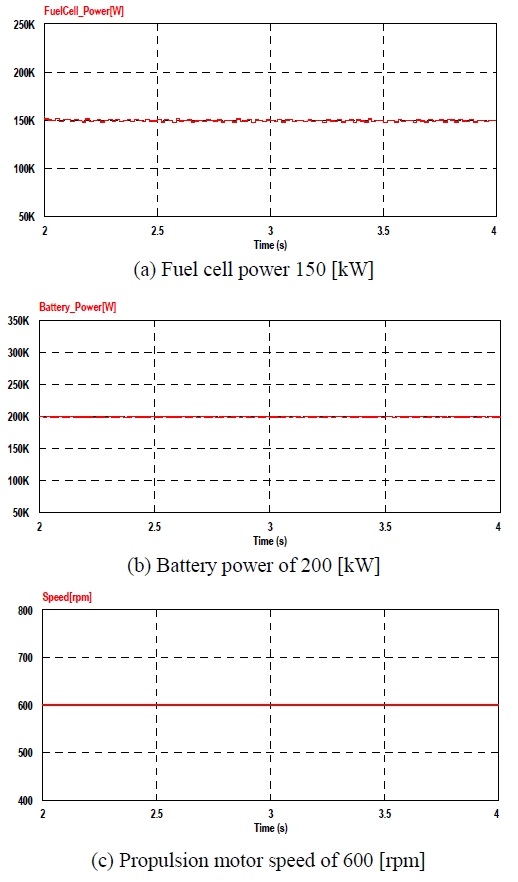
The load profile section 9 in Figure 1 and Figure 2 is a fuel cell and battery hybrid operation section, and a total propulsion power of 350 [kW] is required. As shown in Figure 8, the ship was operated through simulation with a fuel cell power of 150 [kW], battery power of 200 [kW], propulsion motor power of 350 [kW], and rotation speed of 600 [rpm].
3.5 Load profile sections 2 and 6 (fuel cell + battery mode)
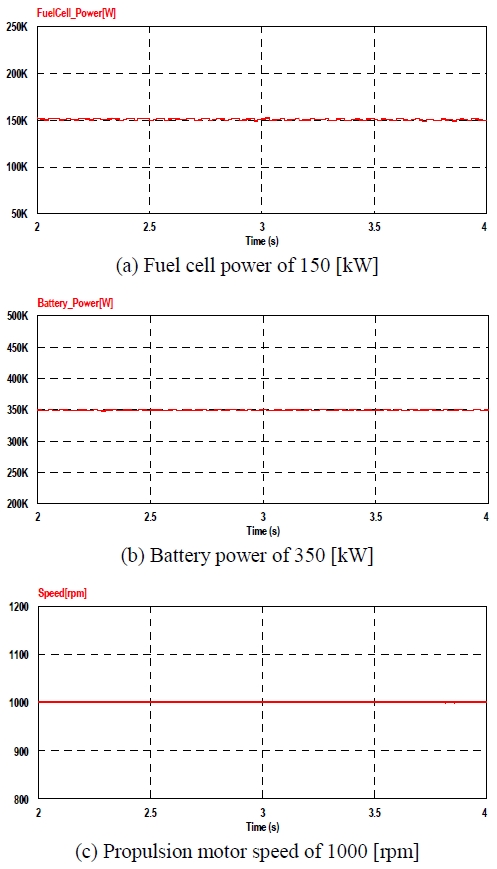
The load profile sections 2 and 6 in Figure 1 and Figure 2 are full-speed navigation sections using the maximum power of the fuel cell and battery. As shown in Figure 9, the ship was operated with a fuel cell power of 150 [kW], battery power of 350 [kW], propulsion motor power of 500 [kW], and rotation speed of 1000 [rpm].
3.6 Simulation analysis results
To evaluate the applicability of the fuel cell–battery hybrid propulsion system to real ships, the actual operation load profile of a diesel engine propulsion ship was measured and divided into 9 sections. The propulsion system consisting of a 150 [kW] fuel cell, 350 [kW] battery, and 500 [kW] propulsion motor was simulated by applying the navigation conditions of the target ship.
The simulation was performed by combining the fuel cell and battery to different extents depending on the navigation modes of departure, arrival, narrow channel navigation, full-speed navigation, long-distance navigation, and short-distance navigation. The results confirmed that the fuel cell power, battery power, propulsion motor power, and rotation speed were operated in the same load profile as that of the existing diesel ship.
4. Exhaust Emissions and Fuel Consumption Measurements of Target Ship
4.1 Measurement of exhaust emissions
The target ship selected for this study was a passenger vessel with two engines, each with 500 [kW] output power. To measure the fuel consumption of the engines in actual load profiles, 20 [%], 40 [%], 60 [%], 80 [%], and 100 [%] loads were applied to the 500 [kW] engine installed on the testbed.
The exhaust output gas from a sample device was analyzed using a gas component analyzer. In addition, the carbon dioxide and NOx components in the exhaust emissions were converted to masses, and the quantified values were compared.
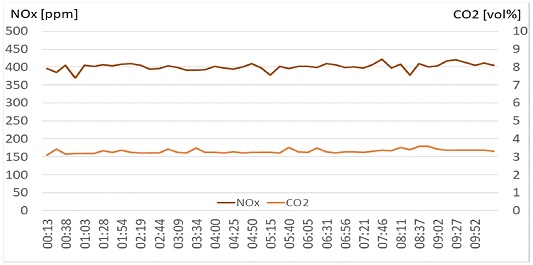
The exhaust emissions were measured for 10 s per session 50 times, and average values were derived. As shown in Figure 10, the average value of carbon dioxide was 3.31 [vol-%], and the average value of NOx was 401.18 [ppm]. Converted to mass flow rates, they were 78,235.00 [g/h] for carbon dioxide and 1,069.60 [g/h] for NOx.
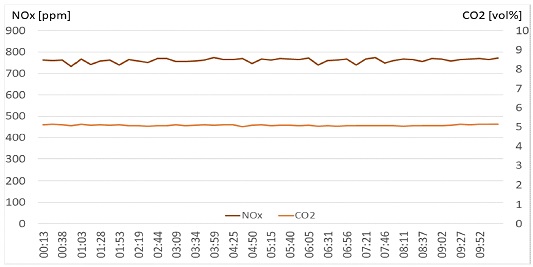
The exhaust emissions were measured 50 times for 10 s per session, and average values were calculated. As shown in Figure 11, the average value of carbon dioxide was 5.09 [vol-%] and the average value of NOx was 761.73 [ppm]. When converted to mass flow rates, they were 130,584.00 [g/h] for carbon dioxide and 2,195.50 [g/h] for NOx.
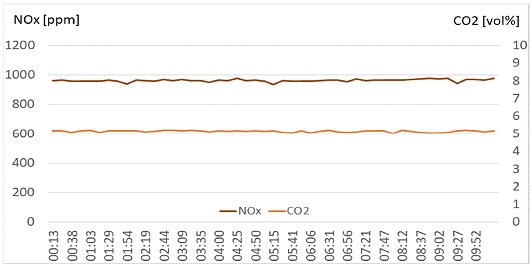
The exhaust emissions were measured 50 times for 10 s per session, and the average values were determined. As shown in Figure 12, the average value for carbon dioxide was 5.15 [vol-%], and the average value for NOx was 961.38 [ppm]. Converted to mass flow rates, they were 180,981.00 [g/h] for carbon dioxide and 3,585.50 [g/h] for NOx.
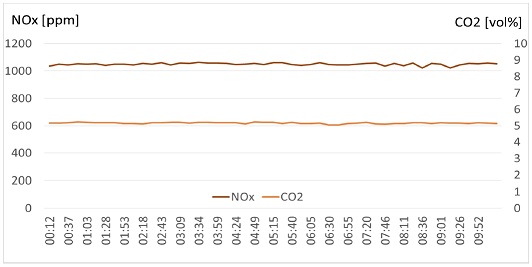
The exhaust emissions were measured 50 times for 10 s per session, and the average values were determined. As shown in Figure 13, the average value for carbon dioxide was 5.17 [vol-%], and the average value for NOx was 1049.66 [ppm]. When converted to mass flow rates, they were 289,408.00 [g/h] for carbon dioxide and 6,571.00 [g/h] for NOx.
4.2 Comparison of exhaust emission measurement results according to the ship’s load profile
Hansol No. 2 operates along the following route: Tongyeong – Bijin Inner Port – Bijin Outer Port – Dangguem – Dae Port - Somaemul Island. It operates three voyages per day on weekends and two voyages per day on weekdays. Therefore, the exhaust emissions were calculated based on the two voyages per day on weekdays. Table 2 compares the NOx and carbon dioxide emissions of a diesel engine propulsion ship and a fuel cell–battery hybrid ship.
When the diesel engine was replaced with a fuel cell–battery hybrid system, the carbon dioxide emissions were reduced by 1,737.60 [kg] per day and NOx emissions by 66.32 [kg] per day.
4.3 Comparative analysis of fuel consumption according to the ship’s load profile
The energy density per mass of hydrogen is 142 [kJ/g], which is approximately 4 times higher than that of gasoline and three times that of natural gas. Because the fuel efficiency ratio of diesel to gasoline is 4:3, the amount of hydrogen required to navigate the same route as the target ship is as follows:
| (1) |
The hydrogen consumption according to the load profile of a fuel cell–battery hybrid can be calculated using Equation (1), and the results are outlined in Table 3.
Because the target ship operates twice per day, the fuel consumption is 714.40 [kg]/day, and the fuel cost required for one-day operation is 817,202 [Won] for the conventional diesel engine. Furthermore, the current hydrogen fuel price is 6,000-8,000 [Won/kg]. The amount of hydrogen required for navigation via the same route as that of the target ship is 133.95 [kg]. If the hydrogen price is 6,000 [Won/kg], the fuel cost for one-day operation is 839,700 [Won]. Therefore, the hydrogen engine ship has a similar cost of fuel consumption compared to the existing diesel engine ship.
At the end of 2015, the Korean government predicted the expansion of infrastructure for hydrogen charging to spread the use of hydrogen, as disclosed in “The Third Basic Plan for Environment-Friendly Vehicle Development and Propagation” [5]. There are various methods to produce hydrogen, such as using byproduct hydrogen, modifying fossil fuels, and using water electrolysis. With the development of these hydrogen production technologies, the price of hydrogen fuel is expected to remain stable and be competitive in the future.
4.4 Comparative analysis of fuel consumption between diesel engine propulsion ship and fuel cell–battery hybrid ship
The simulation results for the fuel cell–battery hybrid propulsion system showed that in the operation environment of the target ship using a 150 [kW] fuel cell, 350 [kW] battery, and 500 [kW] propulsion motor power, the propulsion motor power and rotation speed approached the target values stably in the same operation conditions as those of the existing diesel engine. This result demonstrates that the fuel cell–battery hybrid system is applicable to the operation pattern of existing diesel ships.
5. Conclusion
A fuel cell–battery hybrid electric propulsion ship was modeled in this study, and it was verified that the modeled ship can operate in the same environment as an existing diesel engine using a 150 [kW] fuel cell, 350 [kW] battery, and 500 [kW] propulsion motor through simulation under the assumption that the specifications of the two ships are identical.
Furthermore, empirical research was conducted on the environmental and economic effects of replacing a diesel engine propulsion system with a fuel cell–battery hybrid system.
In terms of environmental effects, the proposed hybrid engine had the advantage of reducing carbon dioxide emissions per day by 1,737.60 [kg] and NOx emissions per day by 66.32 [kg].
In terms of economics, the proposed hybrid system could reduce fuel consumption per voyage by 357.20 [kg] and diesel consumption per day by 714.40 [kg]. The diesel fuel cost for one-day operation was 817,202 [Won]. If hydrogen fuel prices are maintained at their current level of 6,000–8,000 [Won/kg], hydrogen could maintain price competitiveness with diesel.
Acknowledgments
This research project was supported by the Korea Energy Technology Evaluation and Planning (KETEP) and the Ministry of Trade, Industry, and Energy (MOTIE) (No. 20173010032240).
Author Contributions
Conceptualization, K. W. Kang and J. S. Kim; Methodology,K. W. Kang; Software, C. H. Jeon and H. M. Jeon; Validation, K. W. Kang and J. S. Kim; Formal Analysis, K. W. Kang; Investigation, K. W. Kang; Resources, K. W. Kang; Data Curation, K. W. Kang; Writing—Original Draft Preparation, K. W. Kang; Writing—Review & Editing, H. M. Jeon and J. S. Kim; Visualization, C. H. Jeon; Supervision, J. S. Kim; Project Administration, J. S. Kim; Funding Acquisition, J. S. Kim.
References
- A. Miola, B. Ciuffo, E. Giovine, and M. Marra, Regulating Air Emissions from Ships, The State of the Art on Methodologies, Technologies and Policy Options, Joint Research Centre, Luxembourg, 2010.
-
M. C. Díaz-de Baldasano, F. J. Mateos, L. R. Núñez-Rivas, and T. J. Leo, “Conceptual design of offshore platform supply vessel based on hybrid diesel generator-fuel cell power plant,” Applied Energy, vol. 116, pp. 91-100, 2014.
[https://doi.org/10.1016/j.apenergy.2013.11.049]

-
N. Sulaiman, M. A. Hannan, A. Mohamed, P. J. Ker, E. H. Majlan, and W. R. Wan Daud, “Optimization of energy management system for fuel-cell hybrid electric vehicles: Issues and recommendations,” Applied Energy, vol. 228, pp. 2061-2079, 2018.
[https://doi.org/10.1016/j.apenergy.2018.07.087]

-
J. S. Kim, H. M. Jeon, and D. K. Kim, “A study on characteristics of each operation mode for hybrid electric propulsion ship by operation circumstances,” Journal of the Korean Society of Marine Engineering, vol. 41, no. 3, pp. 245-250, 2017 (in Korean).
[https://doi.org/10.5916/jkosme.2017.41.3.245]

- J. N. Park, “Status of hydrogen station technology and policy,” KIC News, vol. 21, no. 3, pp. 10-19, 2018 (in Korean).
-
Y. Wang, K. S. Chen, J. Mishler, S. C. Cho, and X. C. Adroher, “A review of polymer electrolyte membrane fuel cells: technology, applications, and needs on fundamental research,” Applied Energy, vol. 88, no. 4, pp. 981-1007, 2011.
[https://doi.org/10.1016/j.apenergy.2010.09.030]

-
J. Torreglosa, P. Garcia, L. Fernandez, and F. Jurado, “Predictive control for the energy management of a fuel-cell –battery-supercapacitor tramway,” IEEE Transaction on Industrial Informatics, vol. 10, no. 1, pp. 276-285, 2014.
[https://doi.org/10.1109/TII.2013.2245140]

- B. Wu, High-Power Converters and AC Drives, 2nd ed, USA, Wiley: Hoboken, 2006.
-
J. M. Apsley, A. Gonzalez-Villasenor, M. Barnes, A. C. Smith, S. Williamson, J. D. Schuddebeurs, P. J. Norman, C. D. Booth, G. M. Burt, and J. R. McDonald, “Propulsion drive models for full electric marine propulsion systems,” IEEE Transaction on Industrial Informatics, vo. 45, no. 2, pp. 676-684, 2009.
[https://doi.org/10.1109/TIA.2009.2013569]


