Electrochemical and on-site tests for the application of cathodic protection on the inner surface of seawater pipes
Copyright © The Korean Society of Marine Engineering
This is an Open Access article distributed under the terms of the Creative Commons Attribution Non-Commercial License (http://creativecommons.org/licenses/by-nc/3.0), which permits unrestricted non-commercial use, distribution, and reproduction in any medium, provided the original work is properly cited.
Abstract
The corrosion of pipe materials dramatically proceeds due to several factors (e.g., temperature, flow rate, concentration of chlorine). In particular, seawater leakages can unexpectedly and suddenly occur in seawater pipes because of coating failures, cracks in the welding area, and localized corrosion. These problems can repeatedly occur in the absence of an effective protection technique. In this study, we performed electrochemical and on-site tests for the application of cathodic protection on the inner surface of seawater pipes. We measured several parameters, including the corrosion rate, corrosion current density, optimal cathodic protection potential, and range of cathodic protection current density necessary to maintain the cathodic protection potential. Furthermore, we determined the effects of corrosion prevention on some pipe specimens by registering the cathodic protection current density, cathodic protection potential, and state of the pipe’s inner surface under various flow rates.
Keywords:
Corrosion, Polarization, Cathodic protection, Seawater, Potentiostatic1. Introduction
Under global economic growth and the emergence of sophisticated technologies, marine industries (i.e., shipbuilding, marine materials, and marine transportation) underwent a rapid and broad development. In this context, ships and marine structures (e.g., offshore plants and power industries) should have not only a high value, but also a long life expectancy [1]. Seawater is used as a coolant for the operation of these facilities. However, scale is adsorbed on the metal surfaces inside seawater pipes and accelerates their corrosion; additionally, the corrosion of pipe materials can proceed rapidly due to several factors (e.g., temperature, flow rate, concentration of chlorine) [2]. If the inner surface of a pipe undergoes corrosion repeatedly, it will ultimately exhibit small holes and/or a rough surface and the lifetime of the pipe will be reduced. The frequent replacement of pipes is not possible due to the high costs involved [3]. Furthermore, seawater leakages can unexpectedly and suddenly occur in seawater pipes due to several factors (e.g., coating failures, cracks in the welding area, and localized corrosion). These problems can repeatedly occur in the absence of an effective protection technique [4].
For these reasons, many researchers have investigated the corrosion behavior of materials used in seawater pipes and marine structures. W. B. W. Nik et al. [5] investigated the corrosion behavior of mild steel in seawater at different sites through the weight loss method: the weight loss percentage of mild steel in seawater was found to increase with the immersion period; in addition, a slight temperature increase was found to enhance the corrosion rate. J. A. Jeong et al. [6] conducted electrochemical polarization tests on carbon steel in fresh and natural seawater, showing that the corrosion rate of specimens was 100-fold higher in seawater than in fresh water, while the current density in seawater was 3-fold higher than in fresh water; furthermore, the results obtained from the galvanostatic tests indicated that a higher the cathodic protection current corresponded to a lower cathodic protection potential. Those previous researches, focused on corrosion prevention, have hardly discussed the corrosion of pipes’ inner surfaces.
In this study, we performed electrochemical and on-site tests for the application of cathodic protection on the inner surface of seawater pipes. We measured several parameters, including the corrosion rate, corrosion current density, optimal cathodic protection potential, and range of cathodic protection current density necessary to maintain a certain cathodic protection potential. Furthermore, we determined the effects of corrosion prevention on some pipe specimens, registering the cathodic protection current density, cathodic protection potential, and state of the pipe’s inner surface under various flow rates.
2. Experimental
2.1 Materials
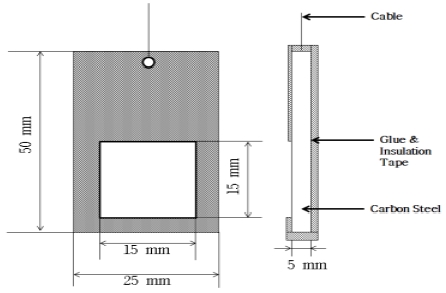
General carbon steel is normally used for the creation of seawater pipes and was selected as the research material. The specimens (Figure 1) were processed into rectangular blocks with the following dimensions: 50 (length) x 25 (height) x 5 (width) mm. A copper wire was connected to each of the specimens and then coated with an insulation tape and glue to seal other parts, leaving the working surface so that the corrosion surface of the area of 2.25 cm2 was exposed to the solution. The elemental composition of the specimens is shown in Table 1.
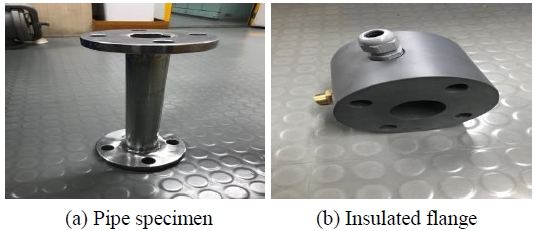
The equipment for this test consisted in a seawater pipeline system located onboard the T/S HANBADA, a training ship of the Korea Maritime & Ocean University. The diameter of the pipe specimens was of 40 mm. Insulated flanges were used for the installation of reference electrodes and insoluble anodes; these flanges had an air venting valve that allowed the discharge of air from the pipes (Figure 2).
2.2 Methods
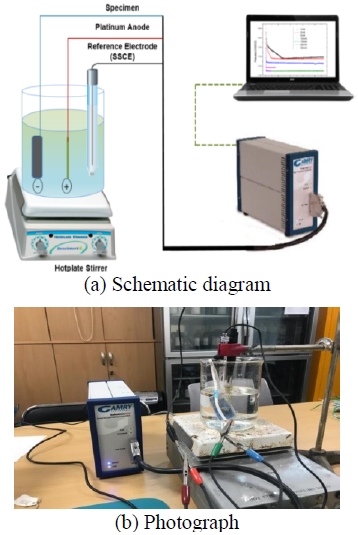
A schematic diagram of the electrochemical polarization test and a photograph of the whole test apparatus are shown in Figure 3. The electrochemical polarization characteristics of the specimens were studied by immersing them in different solutions, as well as by testing different flow rates and temperatures. The solution flow rate and temperature were controlled by using a hot plate stirrer (MS-300TD, Jeil Science). Silver–silver chloride and platinum electrodes were used as reference and counter electrodes, respectively. The electrochemical polarization test was performed using a potentiostat (Gamry Instrument, Reference 600). Fresh (tap) water and seawater (natural seawater) were used to prepare the experimental solution. The experimental temperature was maintained at 25 ℃ or 35 ℃ by putting the beaker containing the solution on a hot plate; meanwhile, the target flow rate was achieved by setting the stirrer speed at 360 rpm (20 %). The tested environmental conditions and correspondent codes are shown in Table 2.
A linear polarization resistance test was conducted by scanning the potential range (± 20 mV/SSCE), with respect to the open-circuit potential, at a scan rate of 0.167 mV/s. In addition, an anodic polarization test was conducted by scanning the potential range from –100 mV/SSCE, with respect to the open-circuit potential, to an anodic potential of +1500 mV/SSCE at a scan rate of 5 mV/s. Furthermore, a cathodic polarization test was conducted by scanning the potential range from +100 mV/SSCE, with respect to the open-circuit potential, to a cathodic potential of –1500 mV/SSCE at a scan rate of 5 mV/s. Finally, the cathodic protection potential was set at –1100 mV/SSCE during the potentiostatic tests and the cathodic protection current density was calculated as a function of time.
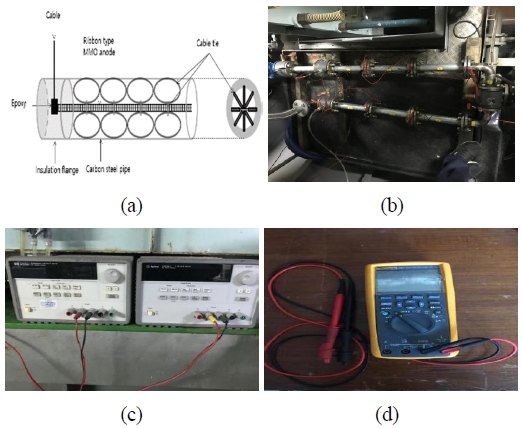
Figure 4 shows the equipment used for this test, which included a MMO ribbon (i.e., the anode) and a carbon steel pipe (i.e., the cathode). The chemical composition of the carbon steel pipe used for this test was equal to that of the specimen used for the electrochemical polarization test. An electric cable was connected to the anode and covered with epoxy and a hardener; then, it was extracted through the hole of the insulation flange. The anode for the cathodic protection was placed in the seawater pipe; subsequently, the MMO ribbon anode was fixed using a cable tie (i.e., the spacer) so that it did not touch the pipe (i.e., the cathode). A power supply (E3632A, Agilent, USA) was used to apply a direct current (DC), while a Fluke multimeter (Fluke 87-V, Fluke, USA) was used to measure the potential of the pipe.
3. Results and Discussion
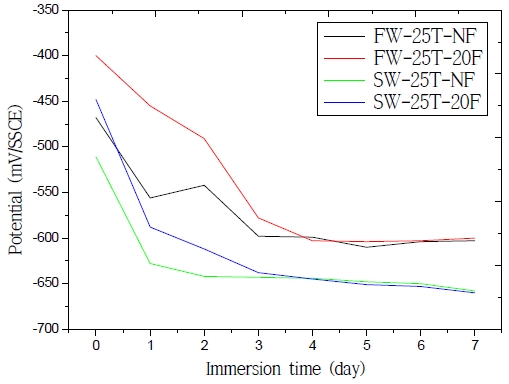
Figure 5 shows the open-circuit potential results obtained using different solutions (e.g., fresh water or seawater) and testing different flow rates (e.g., static or 20 % stir). The open-circuit potentials associated with fresh water were nobler than those of seawater for all the immersion times. The open-circuit potential of the specimen in static fresh water was initially –468 mV/SSCE and gradually decreased to –603 mV/SSCE; in addition, the open-circuit potential of the specimen in static seawater was initially –511 mV/SSCE and gradually decreased to –658 mV/SSCE. As time passed by, the open-circuit potentials of the specimens decreased and then stabilized under all conditions. Some (chemically stable) corrosion by-products apparently covered the reacting surface, leading to a decrease of the reacting surface areas and to a stable potential; however, the open-circuit potential moved rapidly towards active direction during the initial period. Cl- was dissolved in seawater: it destroyed the oxidation layer and adhered to the metal surface, leading to an increase of the exchange current density and to a decrease of the overpotential [7]; furthermore, the open-circuit potentials of the solutions with 20 % stir flow rates were nobler than those of the static solutions. The open-circuit potential of the specimen in fresh water at the 20 % stir flow rate was initially of –400 mV/SSCE and gradually decreased to –600 mV/SSCE; meanwhile, the open-circuit potential of the specimen in seawater at the 20 % stir flow rate was initially of –448 mV/SSCE and gradually decreased to –660 mV/SSCE. In fact, a flow rate increase led to an increase of the polarization agents’ (e.g., H+) diffusion rate, as well as in the rate of cathodic polarization, in the consumption of electrons, and in a reduction of the negative charge formed on the double layer. These results are in agreement with those of previous researches (Z. Li et al. [8] and Q. Niu et al. [9]). Under all conditions, the open-circuit potentials stabilized after 4 days, approaching the value of the corrosion potential (i.e., the mixed potential at which the rate of anodic dissolution of the electrode equaled the rate of cathodic reactions, and at which there was no net current flowing in or out of the electrode).
Based on the linear polarization resistance results, we calculated the corrosion rate and current density in fresh water and seawater (Figure 6). The corrosion rates in fresh water and seawater at 25 ℃ were of 2.789 mpy and 10.15 mpy, respectively; in addition, the corrosion current densities in fresh water and seawater at 25 ℃ were of 13.72 ㎂/cm2 and 49.96 ㎂/cm2, respectively. These results are in agreement with those of A. Royani et al. [10] and R. Winston revie [11]. The average corrosion rate of carbon steel in seawater reported by these authors was of 2 mpy for the first 20 years, and then of 1 mpy. A temporal decrease in the corrosion rate was clearly demonstrated by a corrosion test during which steel was continuously immersed in seawater [11]. Over the long period, the corrosion rates associated with fresh water and seawater were very similar; however, our results for the specimens in seawater showed slightly higher corrosion rates than those reported in previous studies, possibly because the test was performed over a short time period.
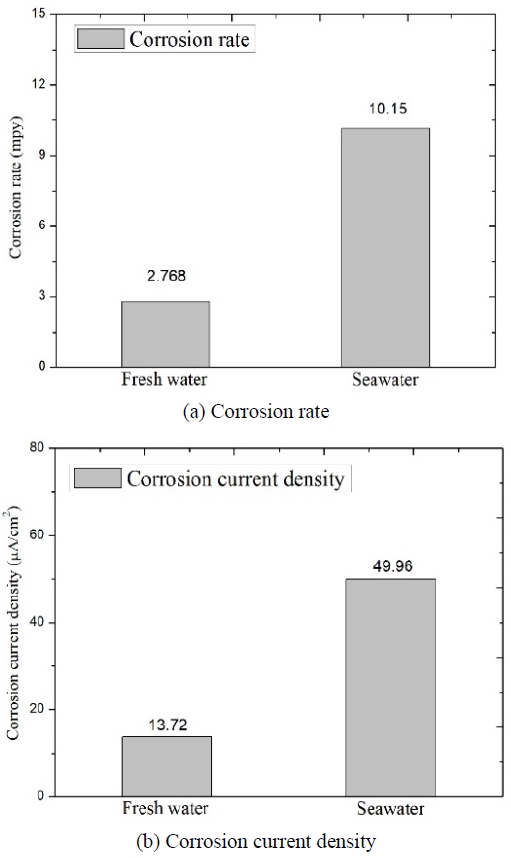
Corrosion rates and current densities registered during the polarization resistance test (in fresh water and seawater)
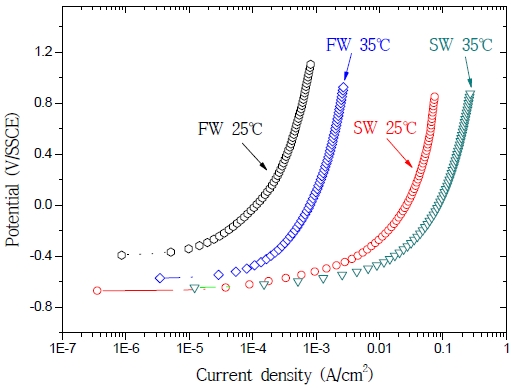
Figure 7 shows the results of the anodic polarization test in fresh water and seawater at 25 ℃ and 35 ℃. The corrosion potential was slightly lower in seawater (containing many corrosive factors) than in fresh water. As the temperature of both solutions increased, their current densities increased as well. At 25 ℃, the current density in seawater was 150-fold higher than in fresh water. In fact, Cl- was adsorbed on the metal surface, causing an increase of the exchange current density for anode dissolution, an acceleration of the activation dissolution reaction, and a reduction of the overpotential [7]. The current density in fresh water at 35 ℃ was 3-fold higher than in fresh water at 25 ℃; furthermore, the current density in seawater at 35 ℃ was 3-fold higher than in seawater at 25 ℃. These results are similar to those reported by S. K. Jang et al. [7] and D. H. Lee [12]. A temperature increase was accompanied by an increase of the current density and rate, since the level of activity of the ions participating in the reaction increased following an alteration of the free energy. As the potential rose during anodic polarization, the current density increased with temperature and was higher in seawater than in fresh water.
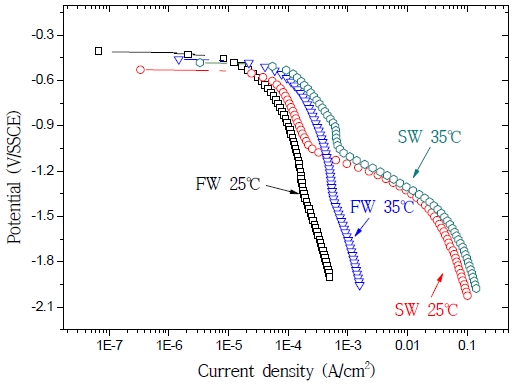
Figure 8 shows the cathodic polarization results obtained using fresh water and seawater at 25 ℃ and 35 ℃. In fresh water, activation and concentration polarization occurred due to a reduction in dissolved oxygen; meanwhile, in seawater, these phenomena occurred due to both a reduction in dissolved oxygen and to the generation of hydrogen gas. For what concerns the activation polarization, the current density at 25 ℃ in seawater was 2-fold higher than in fresh water; moreover, in both fresh water and seawater, the current density was 3-fold higher at 35 ℃ than at 25 ℃. For what concerns the concentration polarization, the current density did not increase due to an increase of the oxygen reduction rate on the surface of the electrode, leading to a consumption of the oxygen ions close to the metal surface. Additionally, we observed a narrow concentration polarization gap, linked to a reduction of the dissolved oxygen levels (due to an increase in seawater temperature) [12]. At 25 ℃, the current density was 40-fold higher in seawater than in fresh water; furthermore, in fresh water, the current density at 35 ℃ was 3-fold higher than at 25 ℃. For what concerns hydrogen reduction, no temperature-related differences were observed: lower potentials corresponded to greater differences in current density. Slightly higher current densities were registered at high temperatures, indicating an increase in the limiting diffusion current density following a rise in the level of activity of ions under high temperature. The cathodic protection potential of the carbon steel apparently had to be maintained between –1000 mV/SSCE and –1150 mV/SSCE in order to avoid damages linked to hydrogen embrittlement.
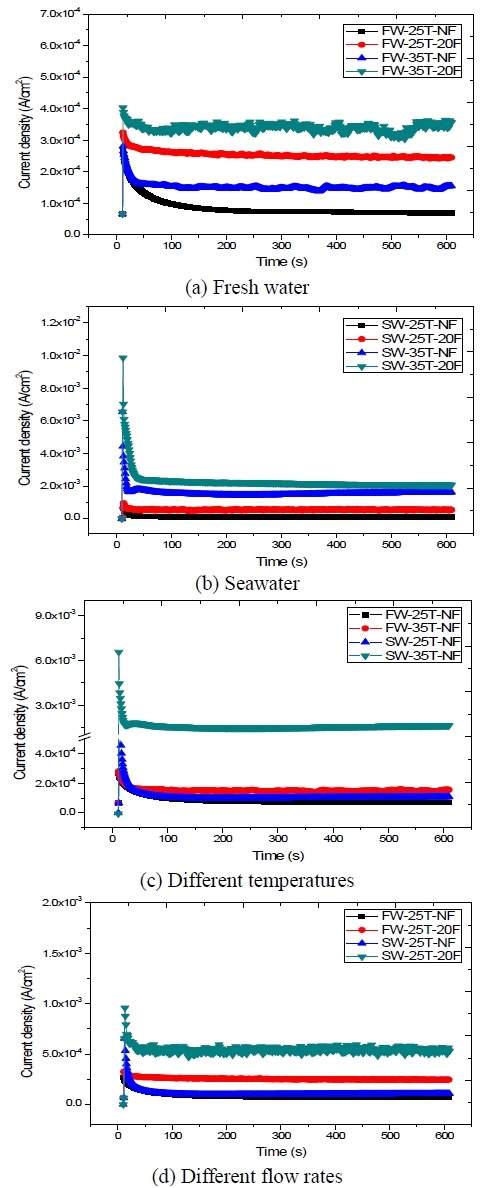
Figure 9 compares the results of the potentiostatic polarization test conducted at different temperatures and flow rates in both fresh water and seawater. The potential was set at – 1100 mV/SSCE. Under all conditions, the cathodic protection current density generally increased at the beginning of the test, while the current density gradually decreased with time. The current density also increased with temperature and the flow rate; in fact, an increase of the superficial flow and temperature can affect the limiting current density, resulting in higher corrosion rates. In fresh water, the lowest current density (~ 70 ㎂/cm2) was recorded at 25 ℃ in static fresh water, while the highest current density (~ 350 ㎂/cm2) was observed at 35 ℃ in 20 % stir fresh water, indicating a 5-fold difference. In seawater, the lowest current density (~ 0.11 ㎃/cm2) was observed at 25 ℃ in static seawater, while the highest current density (~ 2.0 ㎃/cm2) was observed at 35 ℃ in 20 % stir seawater, indicating almost a 18.2-fold difference. The graph relative to the experiment at 35 ℃ in static seawater included the second highest value in current density. Here, the oxygen diffusion coefficient increased with temperature, leading to an increase of the corrosion rate, temperature, and corrosive factor in seawater. Oxygen was adsorbed on the metal surface, causing also an increase in exchange current density and anode corrosion rate. These findings suggests that, in seawater, the influence of temperature was larger than that of the flow rate: under higher temperatures and flow rates, higher current densities were required in fresh water and seawater in order to maintain the same cathodic protection potential. These results are in agreement with those previously reported by S. K. Jang et al. [7].
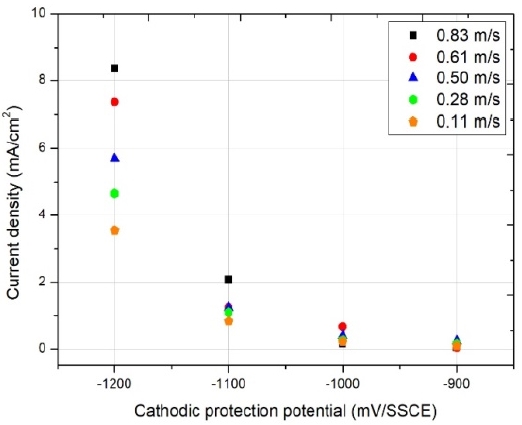
Figure 10 shows the results relative to the cathodic protection current density inside the seawater pipes under various flow rate conditions. For a cathodic protection potential of –900 mV/SSCE, we could observe minimal variations in current density between solutions with different flow rates; however, the difference in current density increased as the cathodic protection potential changed from –900 to –1200 mV/SSCE. Finally, for a cathodic protection potential of –1200 mV/SSCE, we observed the largest current density (8.37 mA/cm2) at a flow rate of 0.83 m/s. The major cause for this increase in cathodic protection current density was a growth in limiting diffusion current density under high flow rate conditions.
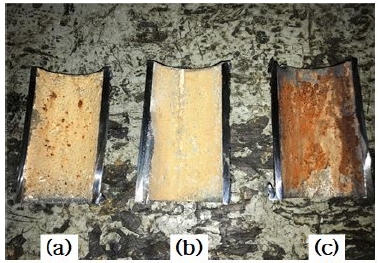
Figure 11 shows a photograph of the inner surfaces of the protected and corroded pipes after the tests. Some corrosive product was found on the inner surface of the corroded pipe; meanwhile, a calcareous layer was deposited on the inner surface of the pipe equipped with the ribbon anode, but no rust was observed. The inner surfaces of pipes that are not equipped with anodes can be partially protected from corrosion, since anodes can produce cathodic protection currents covering distances of ~ 60 cm [12]. In this study, corrosion was partially prevented in the pipe that was not equipped with an anode but positioned next to another pipe equipped with one.
4. Conclusions
The results of electrochemical and on-site test to apply cathodic protection for the inner surface of seawater pipe allow us to draw the following conclusions.
- (1) The open-circuit potentials of fresh water were nobler than that of seawater at all time points. Furthermore, the open-circuit potentials with flow were nobler than that of static solutions.
- (2) The results of linear polarization resistance test showed that corrosion current density and corrosion rate were higher in seawater than freshwater.
- (3) The results of anodic polarization test indicated that the corrosion potential in seawater was slightly lower than fresh water. With an increase of the temperature increases of both solutions, a higher current density was observed in both solutions.
- (4) The results of cathodic polarization test showed that the lower potential, the greater difference in current density. When compared to difference of temperature, a slight increase in current density was observed in high temperature environments. In addition, for protection of carbon steel in seawater, –1,100 to –1,150mV/SSCE of cathodic protection potential should be maintained to avoid occurring hydrogen embrittlement.
- (5) As shown by the results of the potentiostatic polarization test, current density in seawater was normally higher than in fresh water and current density increased with an increase of temperature and flow rate in both solutions.
- (6) The higher cathodic protection current applied, the lower cathodic protection potential was maintained. Furthermore, cathodic protection current increased as flow rates increased. When observing the inner surface of the pipe, corrosive by-products were rarely observed. Therefore, by taking advantage of cathodic protection in the seawater pipe, we could prevent the inner surface of pipe from corrosion suitably.
Acknowledgments
Author Contributions
Conceptualization, J. A. Jeong and M. Kim; Methodology, J. A. Jeong; Software, J. A. Jeong and M. Kim; Validation J. A. Jeong and M. Kim; Investigation, M. Kim and D. H. Lee; Resources, J. A. Jeong; Data Curation, J. A. Jeong and M. Kim; Writing- Original Draft Preparation, M. Kim; Writing-Review & Editing, J. A. Jeong; Visualization, M. Kim; Supervision, J. A. Jeong; Project Administration, J. A. Jeong.
References
-
Y. Huang and D. Ji, “Experimental study on seawater-pipeline internal corrosion monitoring system,” Sensors and Actuators B: Chemical, vol. 135, no.1, pp. 375-380, 2008.
[https://doi.org/10.1016/j.snb.2008.09.008]

-
F. Mansfeld, G. Liu, H. Xiao, C. H. Tsai, and B. J. Little, “The corrosion behaviour of copper alloys, stainless steels and titanium in seawater,” Corrosion Science, vol. 36, no. 12, pp. 2063-2095, 1994.
[https://doi.org/10.1016/0010-938X(94)90008-6]

-
S. A. L. Buhri, D. K. Kaithari, and E. Rasu, “Development of Corrosion Resistance Coatings for Seawater Pipeline,” International Journal of Students’ Research In Technology & Management, vol. 4, no. 2, pp. 24-29, 2016.
[https://doi.org/10.18510/ijsrtm.2016.421]

-
K. M. Moon, S. Y. Lee, Y. H. Kim, M. H. Lee, and J. G. Kim, “Evaluation of corrosion characteristics on welding zone of leakage seawater pipe welded by underwater welding electrode,” Journal of the Korean Society of Marine Engineering, vol. 32, no. 8, pp. 1240-1247, 2008 (in Korean).
[https://doi.org/10.5916/jkosme.2008.32.8.1240]

- W. B. W. Nik, F. Zulkifli, M. M. Rahman, and R. Rosliza, “Corrosion behaviour of mild steel in seawater from two different sites of Kuala Terengganu coastal area,” International Journal of Basic & Applied Sciences, vol. 11, no. 06, pp. 75-80, 2011.
-
J. A. Jeong, M. S. Kim, S. D. Yang, C. H. Hong, N. K. Lee, and D. H. Lee, “Study of the electrochemical polarization test of carbon steel in natural seawater,” Journal of the Korea Society of Marine Engineering, vol. 42, no. 4, pp. 274-279, 2018 (in Korean).
[https://doi.org/10.5916/jkosme.2018.42.4.274]

-
S. K. Jang, S. J. Lee, J. C. Park, and S. J. Kim, “Evaluation of corrosion tendency for S355ML steel with seawater temperature,” Corrosion Science and Technology, vol. 14, no. 5, pp. 232-238, 2015.
[https://doi.org/10.14773/cst.2015.14.5.232]

-
Z. Li and J. Zhang, “The influence of flow velocity on electrochemical reaction of metal surface,” IOPscience, 012098, 2017.
[https://doi.org/10.1088/1757-899X/274/1/012098]

-
Q. Niu, Z. Li, G. Cui, and B. Wang, “Effect of flow rate on the corrosion behavior of N80 steel in simulated oil field environment containing CO2 and HAc,” International Journal of Electrochemical Science, vol. 12, pp. 10279-10290, 2017.
[https://doi.org/10.20964/2017.11.23]

-
A. Royani, L. Nuraini, S. Prifiharni, and G. Priyotomo, “Corrosion rate of various carbon steels in raw water for water cooling system at ammonia plant,” IJETT, vol. 59, no. 1, pp. 51-58, 2018.
[https://doi.org/10.14445/22315381/IJETT-V59P209]

- R.Winston revie, Uhlig’s Corrosion Hand Book Third Edition, A John Wiley & Sons, INC., Publication, pp. 589-601, 2011.
- D. H. Lee, An Experimental Study on the Effect of the Inner Surface of Seawater Pipe using Impressed Current Cathodic Protection, M. S. Thesis, Department of Marine System Engineering, Korea Maritime & Ocean University, Korea, 2018 (in Korean).

