Hydrodynamic performance comparison between the out flows of breakwater OWC devices and offshore OWC devices using CFD analysis
Copyright © The Korean Society of Marine Engineering
This is an Open Access article distributed under the terms of the Creative Commons Attribution Non-Commercial License (http://creativecommons.org/licenses/by-nc/3.0), which permits unrestricted non-commercial use, distribution, and reproduction in any medium, provided the original work is properly cited.
Abstract
This study presents the hydrodynamic analysis of an array of oscillating water column (OWC) devices gliding freely in limited profundity waters and presented to the activity of standard surface waves. The hydrodynamic analysis comparison was made using computational fluid dynamics (CFD) analysis. The advantage of the CFD being an extremely encouraging instrument an originator can be utilized to explore and survey gadget survivability under various conditions and in sporadic waves after further approvals. This method provides an efficient tool for complete hydrodynamic analysis of these devices. The pressure hydrodynamic parameters were calculated using the characteristics of the waves in the Arabian Gulf area with an average historical wave height of 1m. The OWC chamber used for the breakwater experiments was used by Morris-Thomas et al. , whereas for the offshore OWC, the inner diameter was used, which achieved the same cross sectional area as the breakwater chamber. After performing modeling and analysis, the output flow obtained rendered the conclusions for the hydrodynamic performance of the breakwater chamber. A higher OWC devices efficiency was achieved compared to the open ocean fixed OWC, and a variation in efficiency was observed with the change in wave steepness.
Keywords:
Wave energy, Oscillating water column (OWC), Computational fluid dynamics (CFD), Hydrodynamic performance, Offshore, Arabian Gulf1. Introduction
Among the accessible sources of renewable energy, wave energy joins the accompanying focal points [1][2]: the most noteworthy energy thickness, low negative ecological effect (particularly offshore devices), consistency, common regular fluctuation which pursues the adjustments in power request and energy can be removed about 90% of the time contrasted with 20 to 30% for wind and sun oriented. Evaluating the worldwide figure of the accessible wave energy is as yet an issue of discussion among researchers. The World Energy Council Report on World Energy Sources [3] dependent on information. [4] Gave a gauge of the aggregate hypothetical wave energy capability of 32,000 twh /year. While thinking about the heading of the wave energy and the world coastline arrangement. [5] as of late assessed the potential wave energy asset in the scope of 16,000 to 18,500 twh/year which is tantamount to the worldwide power utilization (energy request) of around 20,500 twh in year 2015 [6]. As announced in the World Energy Council report [7], the monetarily exploitable asset could differ to a greatest of 2000 twh/year if all the potential upgrades to existing devices are figured it out. Wave energy is a vital power source because of the generous asset in numerous nations; for instance, Australia has a lot of wave energy that has been evaluated to be around 1329 twh/year [8], which is very nearly multiple times the nation's power utilization of 220 twh in year 2015 [6].
There are countless for wave energy transformation which can be sorted by arrangement area (shoreline, close shore and offshore), type (attenuator, point safeguard and eliminator) and method of activity (submerged weight differential, oscillating wave flood converter, Oscillating Water Column and overtopping gadget) [2]. Of all proposed and existing Wave Energy Converters (WECS), the Oscillating Water Column (OWC) gadget, which is the focal point of the present research work, is Seemingly a standout amongst the most straightforward and exquisite in plan plays a rule of activity. In a general sense, an OWC gadget (see Figure 1) uses sea waves to drive the movement of the water column inside an incompletely submerged chamber 2 open underneath the sea free surface. The free surface motions inside the chamber create mechanical energy by means of pushing and sucking wind current between the OWC pneumatic chambers and encompassing air through an air turbine that is intended to turn a similar way paying little respect to wind stream course. An electric generator can be utilized to change over the mechanical energy into electrical energy. Having no moving parts underwater, an OWC gadget gives insignificant and less demanding support works. OWC devices can be conveyed as settled structures at the shoreline or close shore, coordinated into breakwaters, or coasting structures [9].
1.1 Aim
The aim of this research was to provide a better understanding of the hydrodynamic performance and survivability of offshore OWC devices. To achieve this aim, physical scale model experiments were performed along with fully nonlinear Computational Fluid Dynamics (CFD) simulations. With an emphasis on floating–moored OWC devices, a sequential development of CFD modelling was performed and compared with breakwater OWC device.
2. Sea state in the Arabian Gulf
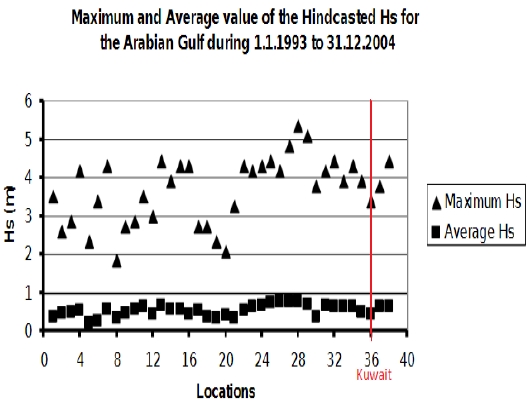
The maximum and average significant wave heights for these 38 locations based on the 12 year hind casted data is provided in Figure 2. The highest maximum significant wave height is hind casted at location 28 (Hs = 5.33 m) and the lowest maximum significant wave height is hind casted at location 8 (Hs = 1.82 m). Similarly the maximum average wave height for 12 year has occurred at location 27 with Hs = 0.77 m and the minimum average wave height has occurred at location 5 with Hs = 0.21 m [10].
From Figure 2 we can clarify the average wave height for Kuwait is Hs= 1.00m.
3. Data analysis and OWC device performance
The overall hydrodynamic efficiency (ζ) that best represents the hydrodynamic performance of an OWC [10] is defined as in Equation (1) for an OWC device [11]. The hydrodynamic efficiency is also referred in the literature as capture width ratio [12] [13] or dimensionless capture width [14].
| (1) |
where PI is the mean incident wave power (energy flux) per unit width, which is defined as the product of the wave energy (EI) (potential and kinetic) per unit ocean surface area and the group velocity (Cg) [20] as given in Equation (3) and Equation (4), while PE is the time-averaged extracted pneumatic power determined as in Equation (5) [5] [15] [16] and a is OWC width/ inner diameter.
| (2) |
| (3) |
| (4) |
where A is incident wave amplitude (defined as half the measured wave height, H), ω is wave angular frequency, k is wave number given by the dispersion relationship ω2/g = k tanh(k ℎ), L is incoming wavelength, T is wave period, h is still water depth, ρ is water density and g is gravitational acceleration.
| (5) |
where q (t) is airflow rate through the orifice, which can be measured by two commonly accepted approaches: (1) using a pre–calibrated orifice together with the pressure measurement [19] and (2) by measuring the free surface elevation inside the OWC chamber [11] [16] [19] with incompressible flow assumption. The second approach was utilized in the present experiments as follows. Using the averaged chamber free surface oscillations (ƞowc), the free surface vertical velocity (V) was calculated by differentiating the measured time–series data (i.e., V (t) = dƞowc/dt). Having defined the chamber free surface vertical velocity and assumed incompressible air for the small model–scale used in these experiments [21], airflow rate (t) was calculated by Equation (6). It is worth highlighting that air compressibility effects must be considered when scaling–up the results presented in this paper to assess device performance at full–scale.
| (6) |
4. Modeling
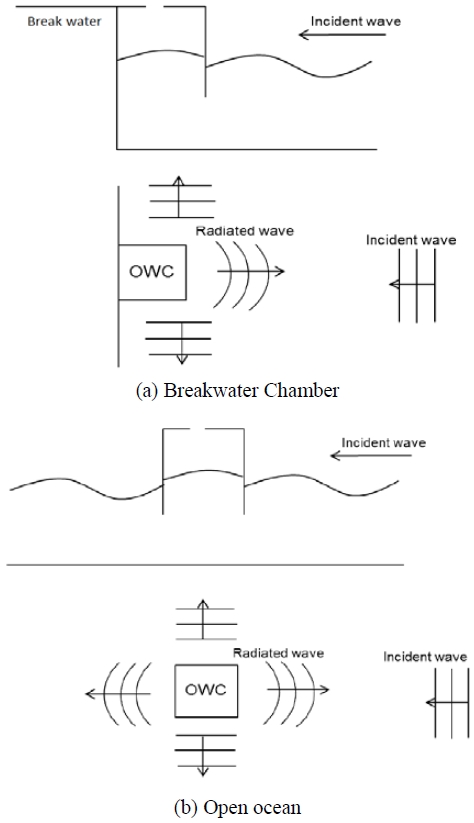
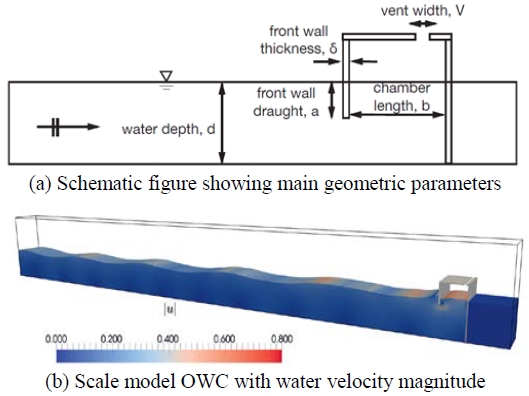
The modelling utilized a 2-dimensional OWC that full scale prototype is to have a main OWC chamber 10m wide by 8m long and was initially proposed for a water depth of 6m but later changed to 11.5 due to various siting considerations of various possible locations, as described precisely in Figure 5. The change in water depth is reflected in the analyzed water depths as well as variations in the experimental front lip submergence. And the residence of a wall after the breakwater chamber affected the results and also the reflection of the waves, as shown in Figure 3. Other simplifications to the OWC geometry included simply squaring off the OWC chamber at the top and utilizing a simple rectangular front lip, as remarked in Figure 4.
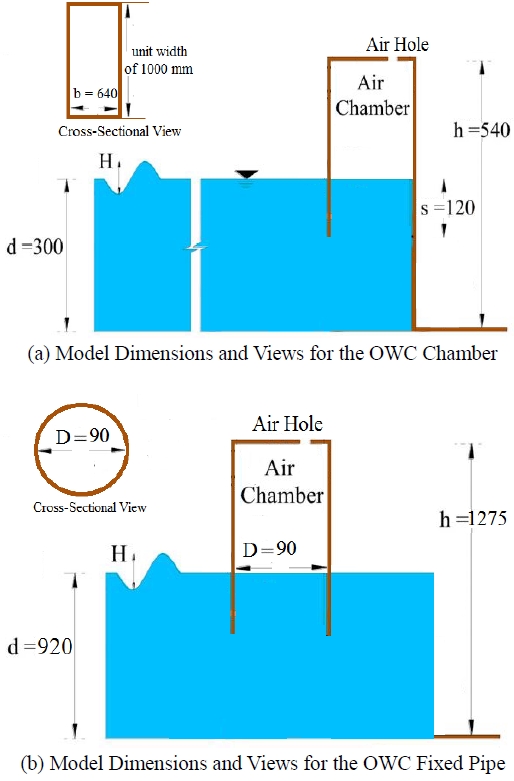
Our model in consideration is the OWC chamber that has been used in the experiments by Morris-Thomas et al [23].
The OWC is placed in a 3D wave system 20 m long, 1 m wide and 2.20 m high in a water depth of d = 0.92 m. The device chamber is h = 1.275 m high with a 0.355 m high air column. The front wall draught a = 0.15 m, chamber length b = 0.64 m and the width of the vent is V = 0.05 m. The OWC device extends along the entire width of the 3D numerical wave tank. The vent is now a slot running along the entire length of the OWC as in the experiments by Morris-Thomas et al. (2007). This configuration of the OWC shows resonant behavior with maximum hydrodynamic efficiency at an incident wavelength of L = 4.07 m or a wave frequency of f = 0.584 Hz [23].
And for the fixed offshore OWC it was taken as the inside diameter of D = 0.9 m so that the cross sectional area are equal in both of the offshore and breakwater OWC, and with the same vent width.
5.Analysis and outputs
As mentioned in section 3, we use the overall hydrodynamic efficiency (ζ) that best represents the hydrodynamic performance of an OWC as a comparing element to deduct the optimum method to make advantage of wave power as an OWC device.
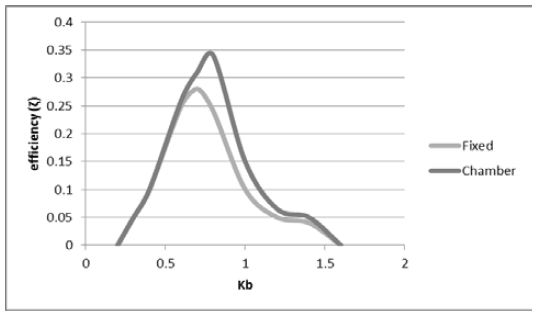
From Equation (1) to Equation (6) calculating the overall hydrodynamic efficiency (ζ) using various range of wave length Kb from 0.2 to 1.6 and summing into the equations with the air flow rate calculated using the CFD analysis simulation and getting the range of the overall hydrodynamic efficiency (ζ) at each wave length Kb and comparing the results of each type of OWC.
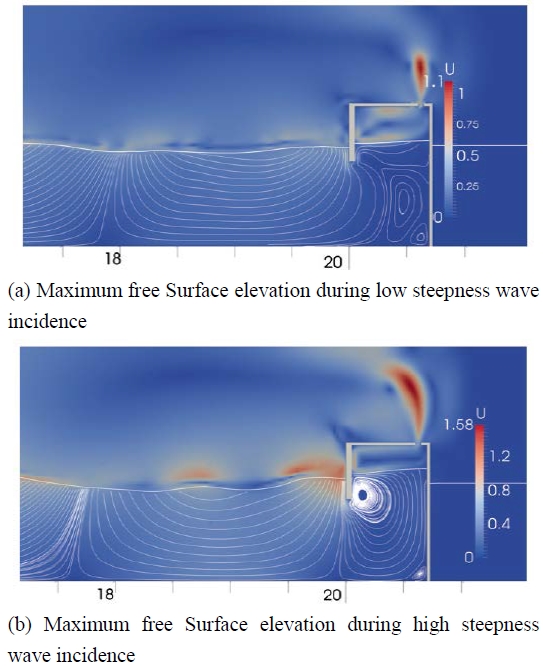
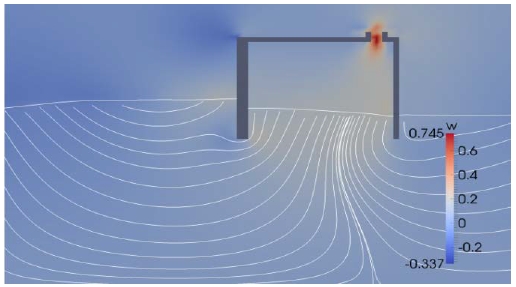
The air stream lines in Figure 6 and Figure 7 show the different values of the air inside and in front of the OWC, and we can notice that the air velocity amplitude at the chamber vent is about twice of the air velocity amplitude at the fixed offshore OWC and ignoring air compressibility in both cases.
6. Summary
From what described before and as shown in Figure 8 and Figure 9 that the hydrodynamic efficiency of the chamber OWC device followed the same general trend as the offshore (fixed) device, but the chamber device exhibited improved the power extraction efficiency (ζ) over a broader bandwidth around the chamber resonant frequency. Similar results could absolutely be observed for (1) a larger regular wave height (H = 1.00 m), and (2) more realistic irregular wave conditions. Furthermore, for both fixed and chamber devices, increasing the incoming wave height resulted in a higher efficiency for low– frequency waves.
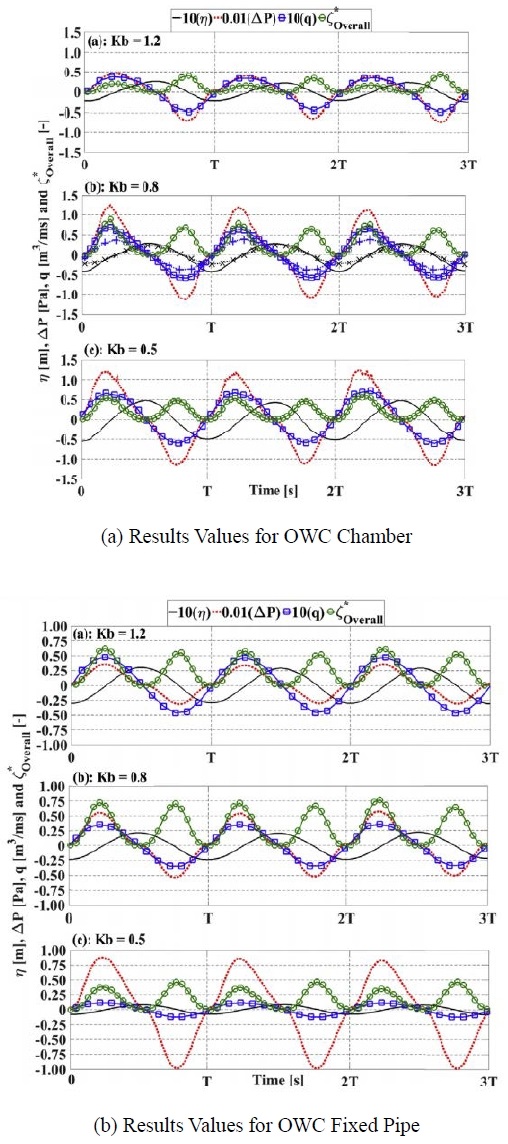
Values of free surface oscillations (ƞ), air pressure oscillations (Pa), airflow rate (q) and overall hydrodynamic and 0.5 for a wave height H = 100 mm.
7. Conclusion
• It was remarkable that the hydrodynamic performance of the breakwater chamber OWC higher than the fixed offshore so as higher in power generated.
• The OWC devices will show better performance for low steepness waves than the high steepness waves.
• The influence of air compressibility is negligible but the ratio of the air chamber volume to the water free surface area has a large influence on the chamber hydrodynamics
• The analysis presented here in is a necessary step forwards the goal of achieving a fixed OWC device of the same geometry as the device tested in this study under normal operating and extreme wave conditions using both experiments and CFD modelling to get a high result so it could be attached to offshore structures to produce clean energy.
• Overall, this study highlighted the possibility of harnessing a large amount of ocean wave energy using an OWC device that can be deployed in deep water where waves are more energetic.
Author Contributions
Methodology, M. S. Alenezi; Software, M. S. Alenezi and M. A. Kurani; Validation, M. S. Alenezi and J. S. Oh; Formal Analysis, M. A. Kurani; Investigation, M. S. Alenezi; Resources, M. S. Alenezi; Data Curation, M. A. Kurani; Writing—Original Draft Preparation, M. S. Alenezi; Writing—Review & Editing, J. S. Oh; Visualization, M. S. Alenezi; Supervision, J. S. Oh; Project Administration, J. S. Oh; Funding Acquisition, J. S. Oh.
References
- B. Drew, A. R. Plummer, and M. N. Sahinkaya, “A review of wave energy converter technology”, Proceedings of the Institution of Mechanical Engineers, Part A: Journal of Power and Energy, 223(8), p887-902, (2009).
- The World Energy Council, World Energy Resources, https://www.worldenergy.org/wp-content/uploads/2016/10/World-Energy-Resources-Fullreport-2016.10.03.pdf Accessed April 19, 2017.
-
B. G. Reguero, I. J. Losada, and F. J. Méndez, “A global wave power resource and its seasonal, inter-annual and long-term variability”, Applied Energy, 148, p366-380, (2015).
[https://doi.org/10.1016/j.apenergy.2015.03.114]

- Enerdata, Global Energy Statistical Yearbook 2016, https://yearbook.enerdata.net/#electricity-domesticconsumption-data-by-region.html Accessed April 19, 2017.
- The World Energy Council, 2010 Survey of Energy Resources, https://www.worldenergy.org/wp-content/uploads/2012/09/ser_2010_report_1.pdf Accessed April 19, 2017.
-
R. S. Tseng, R. H. Wu, and C. C. Huang, “Model study of a shoreline wave-power system”, Ocean Engineering, 27(8), p801-821, (2000).
[https://doi.org/10.1016/s0029-8018(99)00028-1]

- A. C. Mendes, and W. M. L. Monteiro, “Performance analysis of a model of OWC energy converter in nonlinear waves”, Proceedings of the 7th European Wave and Tidal Energy Conference (EWTEC), September 11-13, Porto, Portugal, (2007).
-
A. Elhanafi, A. Fleming, G. Macfarlane, and Z. Leong, “Underwater geometrical impact on the hydrodynamic performance of an offshore oscillating water column–wave energy converter”, Renewable Energy, 105, p209-231, (2017).
[https://doi.org/10.1016/j.renene.2016.12.039]

-
A. Elhanafi, A. Fleming, G. Macfarlane, and Z. Leong, “Numerical energy balance analysis for an onshore Oscillating Water Column wave energy converter”, Energy, 116(1), p539-557, (2016).
[https://doi.org/10.1016/j.energy.2016.09.118]

- S. Neelamani, K. Al-Salem, and K. Rakha, “Extreme waves in the Arabian Gulf”, Journal of Coastal Research, special issue, 50, p322-328, (2007).
-
A. Elhanafi, A. Fleming, G. Macfarlane, and Z. Leong, “Numerical hydrodynamic analysis of an offshore stationary–floating oscillating water column–wave energy converter using CFD”, International Journal of Naval Architecture and Ocean Engineering, 9(1), p77-99, (2017).
[https://doi.org/10.1016/j.ijnaoe.2016.08.002]

-
M. T. Morris-Thomas, R. J. Irvin, and K. P. Thiagarajan, “An investigation into the hydrodynamic efficiency of an oscillating water column”, Journal of Offshore Mechanics and Arctic Engineering, 129(4), p273-278, (2007).
[https://doi.org/10.1115/1.2426992]

-
A. Babarit, “A database of capture width ratio of wave energy converters”, Renewable Energy, 80, p610-628, (2015).
[https://doi.org/10.1016/j.renene.2015.02.049]

-
J. C. C. Henriques, L. M. C. Gato, A. F. O. Falcão, E. Robles, and F. X. Faÿ, “Latching control of a floating oscillating-water-column wave energy converter”, Renewable Energy, 90, p229-241, (2016).
[https://doi.org/10.1016/j.renene.2015.12.065]

-
D. Z. Ning, R. Q. Wang, Q. P. Zou, and B. Teng, “An experimental investigation of hydrodynamics of a fixed OWC Wave Energy Converter”, Applied Energy, 168, p636-648, (2016).
[https://doi.org/10.1016/j.apenergy.2016.01.107]

-
R. Pascal, G. Payne, C. M. Theobald, and I. Bryden, “Parametric models for the performance of wave energy converters”, Applied Ocean Research, 38, p112-124, (2012).
[https://doi.org/10.1016/j.apor.2012.06.003]

-
F. He, M. Li, and Z. Huang, “An experimental study of pile-supported OWC-type breakwaters: Energy extraction and vortex-induced energy loss”, Energies, 9, Paper no. 540, (2016).
[https://doi.org/10.3390/en9070540]

-
A. Kamath, H. Bihs, and Ø. A. Arntsen, “Numerical investigations of the hydrodynamics of an Oscillating Water Column device”, Ocean Engineering, 102, p40-50, (2015).
[https://doi.org/10.1016/j.oceaneng.2015.04.043]

- F. Thi´ebaut, R. Pascal, and A. G. Andreu, “Investigation into the calibration of orifices used in OWC tank testing”, Proceedings of 11th European Wave and Tidal Energy Conference (EWTEC), September 6-11, Nantes, France, (2015).
-
R. A. Dalrymple, and R. G. Dean, Water Wave Mechanics for Engineers and Scientists, New Jersey, World Scientific Publishing Company, (1991).
[https://doi.org/10.1142/1232]

-
A. Elhanafi, G. Macfarlane, A. Fleming, and Z. Leong, “Scaling and air compressibility effects on a three-dimensional offshore stationary OWC wave energy converter”, Applied Energy, 189, p1-20, (2017).
[https://doi.org/10.1016/j.apenergy.2016.11.095]

- K. Freeman, Numerical Modelling and Control of an Oscillating Water Column Wave Energy Converter Thesis, Marine Science and Engineering Doctoral Training Centre, Plymouth University, Country (2014).
-
M. T. Morris-Thomas, R. J. Irvin, and K. P. Thiagarajan, “An investigation into the hydrodynamic efficiency of an oscillating water column”, Journal of Offshore Mechanics and Arctic Engineering-Transactions of The ASME - J OFFSHORE MECH ARCTIC ENG, 129(4), (2007).
[https://doi.org/10.1115/1.2426992]


