Control of corrosion and HClO concentration for biofouling in seawater pipes
Copyright © The Korean Society of Marine Engineering
This is an Open Access article distributed under the terms of the Creative Commons Attribution Non-Commercial License (http://creativecommons.org/licenses/by-nc/3.0), which permits unrestricted non-commercial use, distribution, and reproduction in any medium, provided the original work is properly cited.
Abstract
Marine facilities including vessels and power industries should be obligatorily cooled to navigate the vessels and operate facilities in order to avoid the overheating of their systems. Thus, most facilities use seawater as a coolant in their systems in order to achieve cooling that is continuous and essential. However, there are problems such as corrosion and biofouling that are caused by marine organisms due to the utilization of seawater. To resolve these problems, we have investigated a novel method to control corrosion and the HClO (hypochlorous acid) concentration at the same time in seawater pipes by using cathodic protection and the electrochlorination method. As a result of this experiment, we were able to figure out the cathodic protection current density, the effect of the corrosion protection, and the HClO concentration as a function of various conditions.
Keywords:
Corrosion, Cathodic protection, Seawater, Electrochlorination, Hypochlorous acid, Biofouling1. Introduction
The systems of marine infrastructures including vessels should be obligatorily cooled to navigate the vessels and operate facilities in order to avoid the overheating of their systems. Therefore, most facilities use seawater as the coolant. However, along with the advantages of using seawater as the coolant, such as cost-efficiency and resource abundance, there are also disadvantages, including corrosion and biofouling. In the event of corrosion, the affected pipe section has to be plugged during operation and subsequently replaced by a fresh one. This involves undesirable shut down periods at high costs. Replacement of the entire existing seawater system with new pipes of superior corrosion resistant material is impracticable and therefore protective measures have to be restored [1]. Biofouling is one of the major issues in the power industry since it uses seawater for cooling and other purposes. It causes block rapidly in the cooling system. Hence, the presence of biological organisms such as bacteria and algae that could foul pipes in expensive equipment needs to be managed from an economical and safety point of view [2].
The underlying reason for the accidents that occurred at Hanul nuclear station in Dec, 1988; Hanbit nuclear station in 2012; and Wolsung nuclear station in Jun, 2013 was corrosion in the pipes. Similar cases have also occurred globally, for instance, in 2004, an accident occurred at the MIHAMA nuclear station in Japan [3]. With regard to biofouling, the experience of Marchwood (Southampton) showed that 4000 condenser tubes failed due to mussel fouling, leading to leakage. In addition, an analysis of all the tube failures at Kansai Electric Power Corporation (Japan) in 1982 and 1983 showed that 94% of all tube failures were related to macrofouling in the tubes [4].
To resolve these problems, many authors conducted experiments on corrosion and biofouling in internal seawater cooling pipes by using cathodic protection and electrochlorination, respectively. With regard to cathodic protection for corrosion control, J. A. Jeong et al. [5] experimentally studied corrosion prevention for the inner surfaces of pipes by using the ICCP (impressed current cathodic protection) method. R. Johnsen et al. [6] presented an alternative solution called the RCP (resistor controlled cathodic protection) for solving the corrosion problem. G. Jha [7] discussed the various parameters pertaining to the design of a cathodic protection system for the internal surfaces of metallic pipelines. With regard to electrochlorination for biofouling control, S. Chen et al. [8] investigated the effect of hypochlorous acid on biofouling diatom adhesion by using the seawater electrolysis method. M. Saleem et al. [9] presented the application of electrochlorination for the onsite generation of sodium hypochlorite from seawater to enable its utilization in the power industry. Nevertheless, the lack of an effective and efficient technique that would concurrently enable the control of corrosion and biofouling in seawater pipes aggravates the situation.
In this study, therefore, cathodic protection and electrochlorination were experimentally and contemporaneously tested for their effect on the control of corrosion and the HClO concentration for biofouling control, respectively. Consequently, the major objective of this study is to achieve the simultaneous and full control of corrosion and the HClO concentration for biofouling control in seawater piping systems.
2. THEORETICAL ANALYSIS
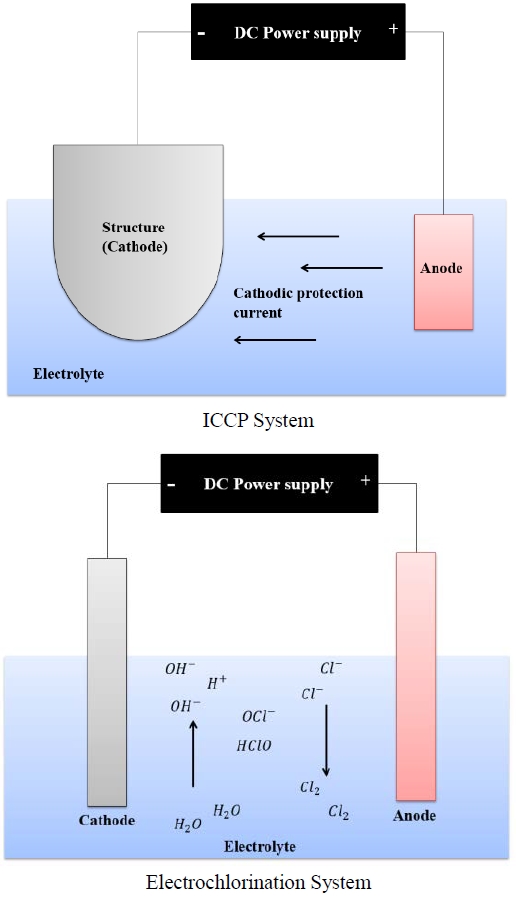
Cathodic protection is an electrochemical method that is known as the most cost-efficient and effective means to prevent corrosion [12]. In particular, the ICCP system has been typically used to prevent the corrosion of the structures exposed to corrosive environments. The circuit comprises the power supply, anode to impress current, electrolyte, and the structure to be protected. The power source drives a positive current from the anode through the electrolyte and onto the structure. The structure is thereby cathodically polarized, leading to a stable state [10]. The electrochlorination system for biofouling control is based on the principle of seawater electrolysis. Seawater can be used to generate a disinfecting solution containing chlorine, by passing a direct electrical current through the solution [11]. Through this process, HClO can be produced. HClO is a weak acid and a type of antiseptic that is widely used in various industries. The main reactions of the HClO production are shown in Equation (1) and Equation (2). The conventional schematic of the ICCP system and the electrochlorination system are illustrated in Figure 1.
| (1) |
| (2) |
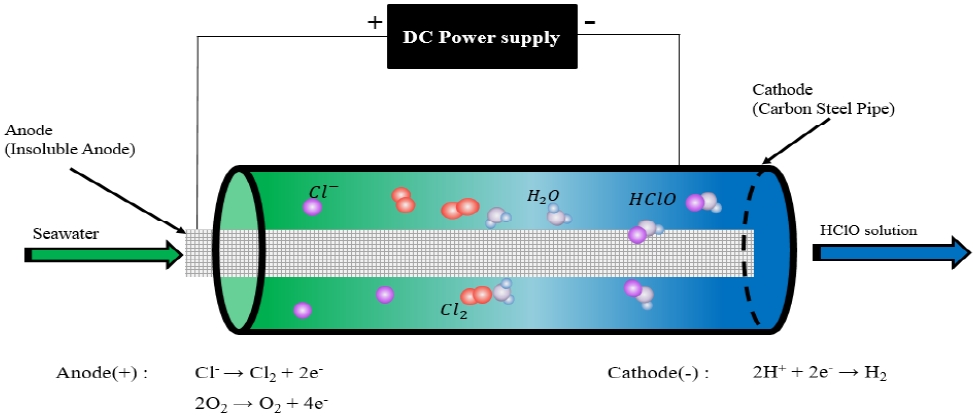
In the present study, a novel technique is accomplished by combining these two systems. To achieve the cathodic protection for the structures to be protected, a cathodic protection current was applied to the structure and later, the structure was cathodically polarized and protected in a proper manner. During this time, by virtue of the cathodic protection current passing through seawater, the seawater was electrolyzed, and chlorine gas was produced, generated in the form of HClO or OCl- (hypochlorite). With these complex reactions, the cathodic protection and HClO concentration produced by seawater electrolysis is controlled simultaneously. The principle of this novel technique is shown in Figure 2.
3. METHODS
An experiment was conducted to verify the presence of HClO produced due to electrochlorination while applying the cathodic protection current. To verify the performance of the cathodic protection and the electrochlorination under various flow velocities, the flow velocity was altered gradually. The cathodic protection potential was measured by a Fluke multimeter. The HClO concentration was measured by the DPD (N,N′-diethyl-p-phenylenediamine) method using a Hach pocket colorimeter. Furthermore, a free chlorine meter, which is an electrochemical measurement device by the electrode, was used to monitor the HClO concentration automatically, because the DPD method has its limitations in terms of measuring the HClO concentration in real-time. The experimental setup is shown in Table 1.
4. EXPERIMENTAL
The experiments were conducted by installing the test apparatus in the seawater piping system located in the engine room of the training ship HANBADA of the Korea Maritime & Ocean University. The material employed was a carbon steel pipe that had a composition of 0.07% C, 0.01% Si, 0.4% Mn, 0.014% P, 0.007% S and Fe as the balance. The diameter of the carbon steel pipe was 40 mm and axially cut every 300 mm. An insulated flange was fabricated to set up the reference electrode and an insoluble anode. It comprised not only the air-venting valve, but also the sampling valve to eliminate the air in the cooling seawater pipe (see Figure 3).

Pipe fittings for cathodic protection and electrochlorination, (a): Carbon steel pipe, (b): Insulation flange, (c): Carbon steel pipe elbow
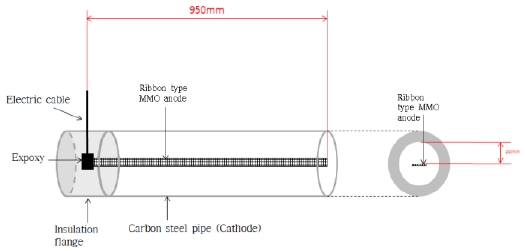
To achieve the cathodic protection for the inner surface of the seawater pipe, we installed an anode in the pipe. Figure 4 shows a schematic and the appearance of the anode installed in the pipe. An MMO (mixed metal oxide) ribbon anode was used as the anode for the cathodic protection and the electrochlorination; a carbon steel pipe was used as the cathode. An electric cable and the anode were connected and covered by using epoxy and a hardener. The electric cable was extracted through the hole located on the insulation flange. By using a cable tie that operated as a spacer, the anode was fixed in order to avoid its touching the pipes that operated as the cathode.
Figure 5 shows the test apparatus that was connected to the inlet and outlet lines of the low temperature cooler in the engine room. The inlet and outlet lines were equipped with a valve to regulate the influx of seawater and a flexible hose which was used for connection with the equipment. At the entrance, the electrochlorination facility was installed, and the insulated flanges were installed facing the front and the behind of the facility. Three carbon steel pipes and one elbow for the cathodic protection test were then connected in series, and an isolated flange with a standard electrode was installed.
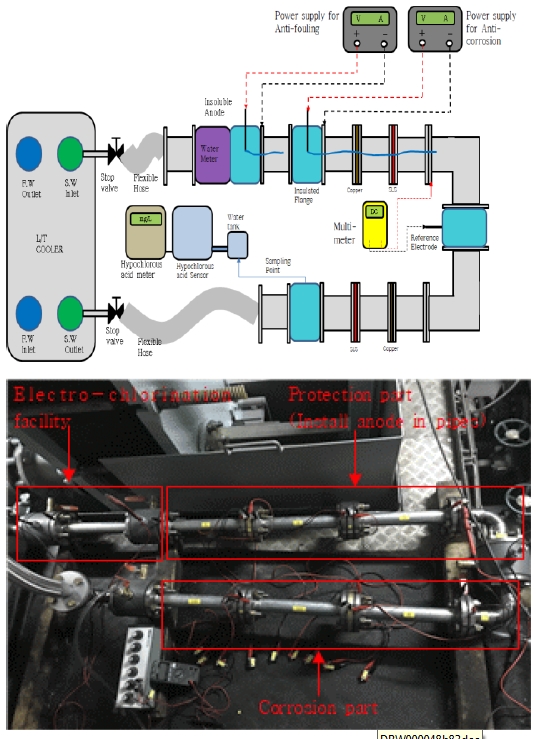
Constitution of test apparatus connected to the cooling seawater pipe in the engine room of training ship HANBADA
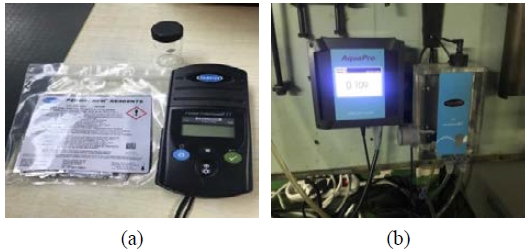
Figure 6 shows the auxiliary test apparatus. A flow meter (FDMWN-40 mm, FLOW Digital, Korea) was installed to measure the flow velocity. The flow meter is an accurate and durable product that can perform measurements in the range from 1 m3/h to 30 m3/h. A power supply (E3632A, Agilent, USA) was used to apply a DC current for the cathodic protection and the electrochlorination. A Fluke multimeter (Fluke 87-V, Fluke, USA) was used to measure the potential of the pipes. In addition, a portable chlorine tester (Pocket Colorimeter Ⅱ, HACH, USA) and a free chlorine meter (Aqua-2000-FCL, Suntech engineering, Korea) were used to measure the HClO concentration (see Figure 7).
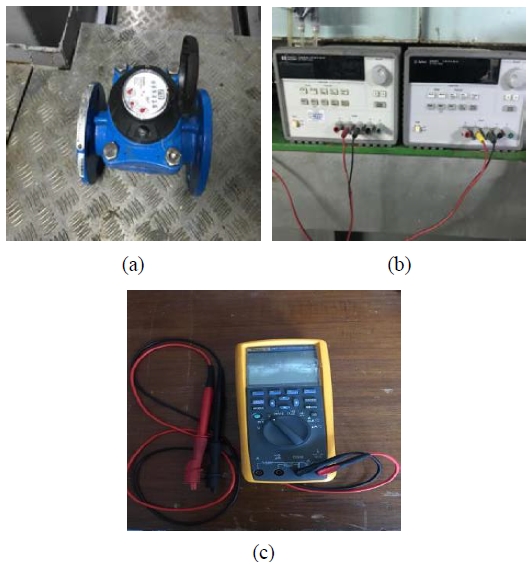
Auxiliary test apparatus for cathodic protection and electrochlorination, (a): Flow meter for measuring flow velocity, (b): Power supply for cathodic protection and electrochlorination, (c): Fluke multimeter
5. RESULTS AND DISCUSSION
5.1 Corrosion Control
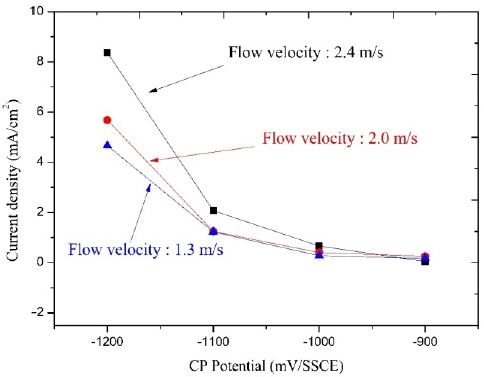
As seen in Figure 8, at –900 mV/SSCE (silver-silver/chloride electrode) of the cathodic protection potential, minute differences in the current density at different flow velocities were observed. However, when the cathodic protection potential changed from – 900 mV/SSCE to –1,200 mV/SSCE, the difference in the current density at different flow velocities was augmented. At the cathodic protection potential of –1,200 mV/SSCE , the largest current density, 8.37 mA/cm2, was identified at the flow velocity of 2.4 m/s. The primary reason for the increase in the cathodic protection current density was the increase in the limit diffusion current density that resulted from a high activity of dissolved oxygen at a fast flow velocity condition [13].
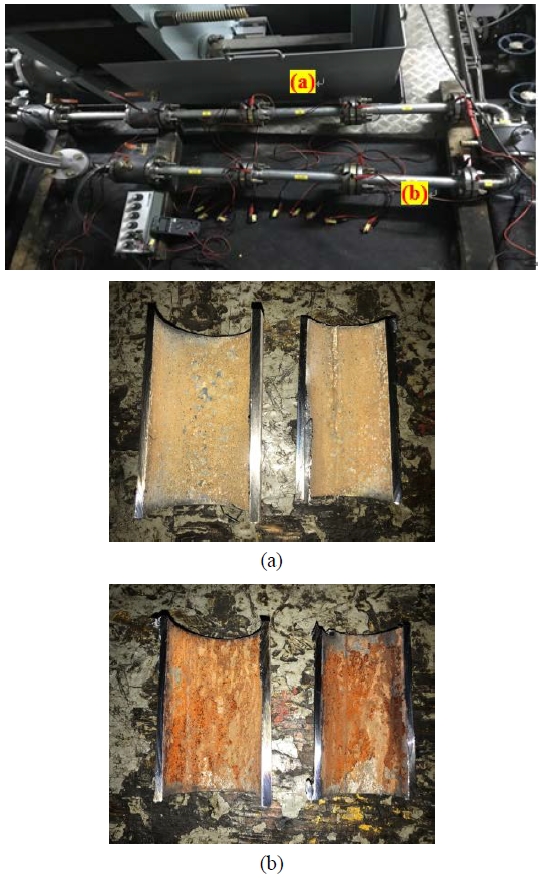
Figure 9 shows the photograph of the inner surface of both the protected and the corroded pipes after the test. According to the results, rust was found on the inner surface of the corroded pipe. By contrast, the pipes that operated by installing the ribbon anode appeared to have deposited a calcareous layer, and rust, which is formed when corrosion occurs, was not found. Furthermore, in the overall pipe, no marine growth or adsorption was observed. We reasoned that the phenomenon of marine growth not occurring in the corroded pipe was due to the fact that the electrochlorination facility that was installed facing the system enabled the presence of the HClO that operated as an antiseptic to pass through the pipe with the seawater flow. Consequently, when an anode was installed in the pipe, corrosion control in the pipe was satisfactorily achieved.
5.2 HClO Concentration Control
Figure 10 shows the results of the HClO concentration produced by the cathodic protection current. Before applying the cathodic protection current, the corrosion potential of the pipe was measured at –700 mV/SSCE. The cathodic protection current and the HClO concentration were measured at a condition of a cathodic protection potential of –900 mV/SSCE. The seawater flow velocity was 15 m3/h, and the temperature during the experiment ranged from 12.6 ℃ to 13.2 ℃. The pH level of the seawater was maintained in the range from 8.20 to 8.24. The cathodic protection current had a tendency to increase with a decrease in the cathodic protection potential. When the cathodic protection potential was below –1,100 mV/SSCE, the HClO concentration amounted to about 0.16 mg/L. Consequently, the HClO concentration was directly proportional to the amount of the cathodic protection current.
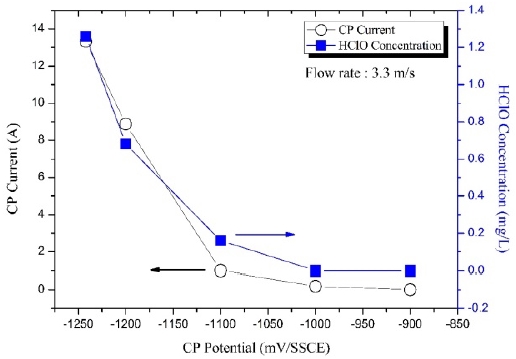
Test results of cathodic protection current and HClO as a function of cathodic protection potential setting
Figure 11 compares the HClO concentration produced by both the cathodic protection current and the electrochlorination output current according to the flow velocities, while maintaining the cathodic protection potential at –1,200 mV/SSCE. The differences in the flow velocities resulted from the fact that a high cathodic protection current was applied in order to maintain the cathodic protection potential, thus increasing the flow velocity. The higher the total current applied (i.e. a combination of the cathodic protection current and the electrolysis current), the higher was the HClO concentration produced. When the cathodic protection potential was maintained at –1,200 mV/SSCE at the flow velocities of 0.7 m/s, 1.3 m/s, and 3.3 m/s, the amount of the applied current was 6.351 A, 6.8 A and 9.751 A, respectively. In addition, 0.70 mg/L, 0.82 mg/L, and 0.92 mg/L of HClO were measured respectively. In each condition, when 6 A of the cathodic protection current was added from the electrochlorination facility, the HClO concentration increased up to 2.2 mg/L, 3.76 mg/L, and 4.66 mg/L, respectively. Conversely, when the additionally applied current decreased, the HClO concentration also decreased. This means that the HClO concentration could be adjusted by the additionally applied current from the electrochlorination facility when the HClO concentration produced by only the cathodic protection current is too low to decimate marine organisms. In addition, with an increase in the flow velocity, the HClO concentration increased in all conditions. This is because the cathodic protection current increases the total applied current to maintain the cathodic protection potential, and thus, the total applied current also increases. It seems that these increases eventually lead to an increase in the HClO concentration. Consequently, when no additional current was applied from the electrochlorination facility, there were insignificant concentration differences in the flow velocity. In contrast, when the additional current was constantly applied, the HClO concentration differences increased considerably. Although the reaction time reduced owing to the increased flow velocities, a high HClO concentration was measured. This is because the large cathodic protection current applied to maintain the cathodic protection potential resulted in the increase in the flow velocity.
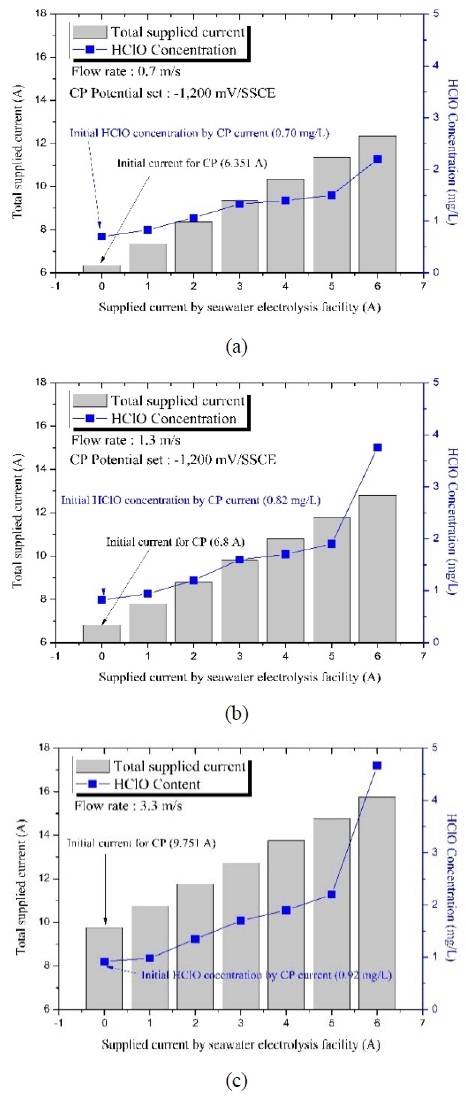
Comparisons of total applied current and HClO concentration at cathodic protection potential of –1,200 mV/SSCE at each flow velocity, (a): 0.7 m/s, (b): 1.3 m/s, (c): 3.3 m/s
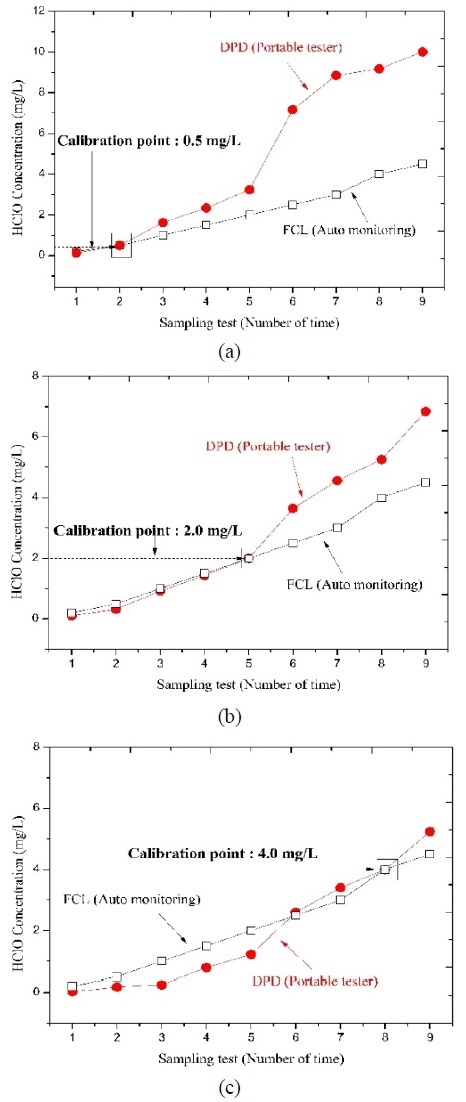
Figure 12 shows the difference between the measured concentrations using the FCL and the DPD methods in a solution of equal concentration when the FCL (free chlorine meter) was calibrated at 0.5 mg/L, 2.0 mg/L, and 4.0 mg/L, respectively. When the FCL was calibrated at 0.5 mg/L, the same level of concentration was observed at 0.5 mg/L. However, with an increase in the HClO concentration, the difference also increased. When the concentration was at 2.0 mg/L, a difference of 0.5 mg/L, on an average, was observed. However, a concentration higher than 2.0 mg/L showed a tendency of an increased difference. For concentrations above 2.0 mg/L, a difference of 4.3 mg/L, on an average, was observed. In addition, when the FCL was calibrated at 2.0 mg/L, at the conditions ranging between 0 mg/L and 2.0 mg/L, a minute difference was observed. Similar to the calibration at 0.5 mg/L, differences in the concentrations above 2.0 mg/L were more likely to be greater than those at 2.0 mg/L. However, the difference in concentrations above 2.0 mg/L was reduced to 1.57 mg/L, on an average. Compared to the case when the calibration was at 0.5 mg/L, the difference was slightly decreased. Lastly, when the FCL was calibrated at 4.0 mg/L, unlike the results reported in the previous graphs, the concentration obtained by the DPD method measured lower than that obtained by the FCL, in the range between 0 mg/L and 2.0 mg/L. The closer the concentration was to 4.0 mg/L (i.e. the calibration value), the smaller was the difference that was observed. In the range from 0 mg/L to 2.0 mg/L, the concentration difference was 0.55 mg/L, on an average. In addition, in the range above 2.0 mg/L, the concentration difference amounted to 0.31 mg/L.
6. CONCLUSION
As demonstrated by the results of the cathodic protection and the electrochlorination, with respect to the corrosion control aspect, the higher the cathodic protection current applied, the lower is the cathodic protection potential. No corrosive byproducts were observed in the inner surface of the pipe. Therefore, by using cathodic protection in seawater pipes, we could prevent the inner surface of the pipe from corroding. Furthermore, with respect to the biofouling control aspect, with an increase in the flow velocity, the HClO concentration increased due to the increase in the cathodic protection current. When adjusting the output current of the electrochlorination facility, the HClO concentration could also be regulated. Although the FCL could achieve monitoring in real-time, deviations according to the range of the calibration were observed. These deviations could be alleviated by appropriate calibration. Consequently, it can be seen that the concentration of the HClO produced by the cathodic protection and the electrochlorination current could be controlled by automatically adjusting the HClO concentration.
Acknowledgments
Author Contributions
Conceptualization, J. A. Jeong and M. Kim; Methodology, J. A. Jeong; Software, M. Kim; Validation, J. A. Jeong and M. Kim; Formal Analysis, M. Kim and D. H. Lee; Investigation, M. Kim and D. H. Lee; Resources, M. Kim and D. H. Lee; Data Curation, J. A. Jeong and M. Kim; Writing-Original Draft Preparation, M. Kim; Writing-Review & Editing, J. A. Jeong and M. Kim; Visualization, M. Kim; Supervision, J. A. Jeong; Project Administration, J. A. Jeong.
References
-
M. B. Deshmukh, P.V. Rodrigues, and I. Akhtar, “Corrosion control of Kunifer-5 seawater piping systems of naval Ships by cathodic protection technique”, Defence Science Journal, 32(1), p17-26, (1982).
[https://doi.org/10.14429/dsj.32.6191]

- M. Saleem, “Biofouling management in the cooling circuit of a power industry using electrochemical process”, Journal of The Chemical Society of Pakistan, 33(3), p295-304, (2011).
- Y. S. Kim, Technology report of Korea Agency for Technology and Standards, Trends in Standardization of Corrosion Methods in Domestic and Foreign, Korea Agency for Technology and Standards, p2-4, (2012), (in Korean).
-
K. K. Satpathy, A. K. Mohanty, G. Sahu, S. Biswas, M.V.R. Prasad, and M. Selvanayagam, “Biofouling and its control in seawater cooled power plant cooling water system – A review”, Nuclear Power, p191-242, (2010).
[https://doi.org/10.5772/9912]

-
J. A. Jeong, M. S. Kim, S. D. Yang, C. H. Hong, N. K. Lee, and D. H. Lee, “Cathodic protection using insoluble anodes by delivering protection currents to the inner surfaces of carbon steel seawater pipes”, Journal of the Korean Society of Marine Engineering, 42(4), p280-286, (2018), (in Korean).
[https://doi.org/10.5916/jkosme.2018.42.4.280]

- R. Johnsen, P. O. Gartland, and S. Valen, “Internal cathodic protection of seawater piping system by the use of the method RCP method”, The NACE International Annual Conference and Exposition CORROSION96, Paper No. 559, p559/1-559/10, (1996).
- G. Jha, Cathodic Protection System for internal surfaces of piping/pipeline, NIGIS CORCON 2017, Paper No. CAP14, (2017).
- S. Chen, J. Zhu, B. Wang, H. Liu, and B. He, “Experimental study on hypochlorous acid blocking the marine diatom adhesion”, International Journal of Electrochemical Science, 7, p5331-5338, (2012).
- M. Saleem, M. H. Chakrabarti, D. B Hasan, Md. S. Islam, R. Yussof, S. A. Hajimolana, M. A. Hussain, G. A. Khan, and B. S. Ali, “On site electrochemical production of sodium hypochlorite disinfectant for a power plant utilizing seawater”, International Journal of Electrochemical Science, 7, p3929-3938, (2012).
-
V. Ashworth, and B. V. Elsevier, Principles of Cathodic Protection, Third Edition 10.1, 2, p10:3-10:28, (2010).
[https://doi.org/10.1016/b978-044452787-5.00152-9]

- R. C. Matousek, D. W. Hill, R. P. Herwig, J. R. Cordell, B. C. Nielsen, N. C. Ferm, D. J. Lawrence, and J. C. Perrins, “Electrolytic sodium hypochlorite system for treatment of ballast water”, Journal of Ship Production, 22(3), p160-171, (2006).
- Luciano Lazzari, and Pietro Pedeferri, Cathodic Protection, Polipress, p237, (2006).
- D. H. Lee, An Experimental Study on the Effect of the Inner Surface of Seawater Pipe using Impressed Current Cathodic Protection, M. S. Thesis, Marine System Engineering, Korea Maritime and Ocean University, Korea, (2018), (in Korean).

