Performance improvement of an axial flow pump model
Copyright © The Korean Society of Marine Engineering
This is an Open Access article distributed under the terms of the Creative Commons Attribution Non-Commercial License (http://creativecommons.org/licenses/by-nc/3.0), which permits unrestricted non-commercial use, distribution, and reproduction in any medium, provided the original work is properly cited.
Abstract
This study aims to design a new axial-pump model to improve the efficiency of an old pump model. The new design considers key parameters such as velocity triangles, hub-to-tip ratio, and selection of hydrofoil in the preliminary design. A computational fluid dynamics analysis was adopted to investigate the performance of the pump models. The performance of the new design was compared with that of the old pump model. The experimental results of both models matched well with the numerical results. The efficiency of the new model reached 73.4%, which is 8.2% higher than the efficiency of the old model at the design point by experimental measurement. The highest loss was found in the impeller domain of both models under the design condition. Thus, the focus is on the internal flow in the impeller domain of both models. Uniform static pressure and smooth streamline distributions were revealed in the fluid passages of the new impeller model. In contrast, non-uniform static pressure distributions were indicated in the blade passages of the old impeller model. As a result, flow circulations were found in the vicinity of the impeller hub area, which caused large hydraulic losses in the impeller and outlet domains of the old model.
Keywords:
Axial-flow pump model, Performance, Impeller design, Loss analysis, Computational fluid dynamics (CFD)1. Introduction
Axial-flow pumps have a high specific speed range in comparison with radial and mixed pumps. Higher specific speed with conventional axial-flow pumps yields a decline in efficiency and cavitation performance [1]. Many researchers have studied the design, flow analysis, and optimal design of impeller blades of axial flow pumps. M. Oshima [2] designed an axial flow pump by modifying a mixed-flow pump without changing its specific speed. A. A. Yevtushenko et al. [3] investigated the effect of impeller hub-to-tip ratio on performance of an axial flow pump. The study concluded that the axial velocity distribution behind an impeller is highly dependent on the impeller hub-to-tip ratio. A. Gusak et al. [4] developed and conducted a test of a small submersible pump for exploiting water from wells. A. Gusak et al. [5] mathematically investigated the hydraulic loss in an impeller of a size axial-flow pump. Manjunatha et al. [6] used CFD to analyze the basic design and investigate the internal flow of an axial-flow pump. L. J. Shi et al. [7] numerically optimized an impeller-blade shape considering the cascade solidity ratio and blade angle to improve the efficiency of an axial flow pump under off-design conditions. The goal of this study is the performance improvement of an old axial-flow pump model by designing a new impeller and diffuser vane under similar working conditions. The new design of the pump model considers the blade angle, hub-to-tip ratio, and diffuser vane. The new design is compared with the old pump model in terms of the pump performance, which is evaluated experimentally and numerically. The efficiency of the new pump model was experimentally recorded as 73.4%, which is 8.2% higher than that of the old model under the design condition. The enhancement is mainly attributed to the decrease in hydraulic loss at the impeller and outlet areas of the new pump design. Thus, an internal flow analysis was conducted to confirm the performance improvement of the new model.
2. Performance test facility of pump models
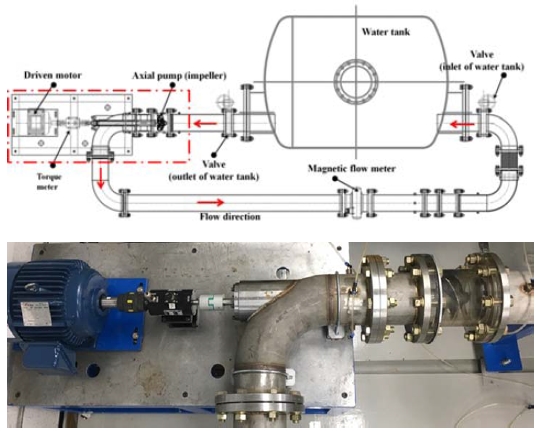
Figure 1 shows the experimental apparatus for performance testing of the axial flow pump model. The flow is transported through a closed loop in the system by an axial-flow pump. The pump is installed horizontally in the system, which has a water tank, two gate valves for controlling flow in and out of the tank, an axial pump driven by a motor, and a magnetic flow meter. Because of the relatively long distance from the impeller blade to the driven motor, straight support vanes are installed in the pipe system to maintain the stability between the shafts of the pump and motor. However, the old pump model does not include a diffuser at the outlet of the impeller because of the pump simplification. The inner diameter of the pipe system is 155 mm, but the casing inner diameter of the impeller model is 151 mm including a 0.5-mm tip clearance between the blade tip and the casing inner wall. Because a gap clearance less than 0.15 mm is not recommended [8], the 0.5-mm tip gap was chosen for ease of manufacturing. Pressure transducers were installed at the inlet and outlet of the axial pump model to measure the pump head. A dynamic torque meter is utilized to measure the pump shaft speed and torque supplied by the motor. The flow rate of the pump is measured by a magnetic flow meter. All measurement signals are recorded to a data-logging system under each operating condition.
3. Design of new axial-flow pump model and numerical method
3.1 Design of new axial-flow pump model
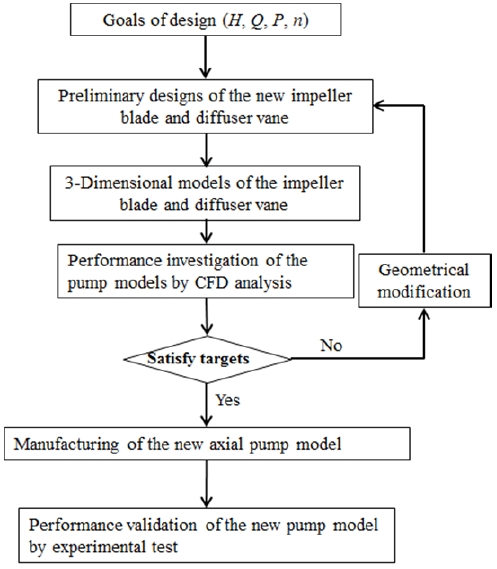
The design parameters of both pump models are shown in Table 1. The new model is designed to supply flow to a propeller hydro-turbine model located downstream of the axial pump. Hence, the design operating condition of the new model is changed appropriately according to the design specification of the propeller hydro-turbine model by changing the specific speed of the pump slightly. The hub diameter of the new impeller was increased to maintain a constant specific speed, which is expressed as Equation (1). The two pump models are designed for a similar operating condition, which is described by the head coefficient (Equation (2)), flow coefficient (Equation (3)), and rotational speed. A flow chart of the design procedure of the new pump model is presented in Figure 2. A closed design loop of the pump model including the CFD analysis is repeated continuously until the design targets are met.
| (1) |
| (2) |
| (3) |
| (4) |
| (5) |
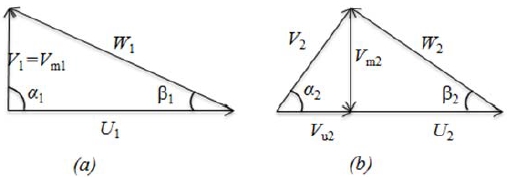
The preliminary design of an impeller blade considers the velocity triangles at the impeller inlet and outlet, which are presented in Figure 3. The entrance flow assumes no pre-rotation at the impeller blade inlet. Hence, the tangential velocity at the entrance (Vu1) should not exist. With a design assumption that same amount of flow rate is transported from the leading to the trailing edge, the meridional velocity (Vm) is determined considering the flow rate in the flow passages.
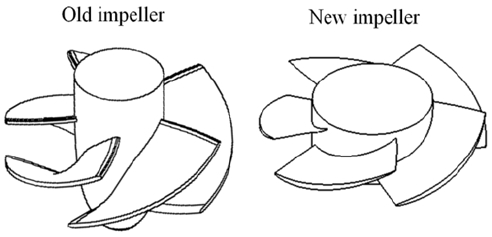
The impeller blade angles (β) at the inlet and outlet can be obtained from Equation (4) and Equation (5), respectively, where indicators “1” and “2” represent the entrance and exit angles of the impeller, respectively; and U is the peripheral velocity; U1 = U2 at the same span of impeller blade. The tangential velocity at the impeller blade outlet is calculated from the Euler equation considering hydraulic efficiency (η) as . A rough estimation of the meridional velocity can be determined by ,where D, and d are the impeller diameter and hub diameter, respectively. The same hydrofoil shape from the previous study [9] is adopted for the impeller blade. A comparison of the three-dimensional impeller blade models is illustrated in Figure 4.
3.2 Numerical method
Owing to the improved accuracy and reliability nowadays, computational fluid dynamics (CFD) analysis is used to predict the performance of fluid machinery as a pre-manufacturing stage. This study uses a commercial code of ANSYS CFX version 18.1 [10] to investigate the performance of both pump models. The experimental results are compared to validate the CFD analysis results.
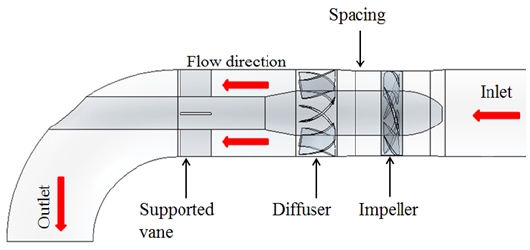
Numerical fluid domains of the models are built using a three-dimensional software. As seen in Figure 5, the fluid domains of the new pump model have five domains. To calculate the pump performance, the tip clearance gap is included in the impeller domain.
To reuse the existing apparatus system, the only changes to the new pump model are the changed impeller shape and the addition of a diffuser. Moreover, as the pump size is small and to improve the convenience of the assembly process of the pump parts, a relatively long spacing is included between the impeller and diffuser domains.
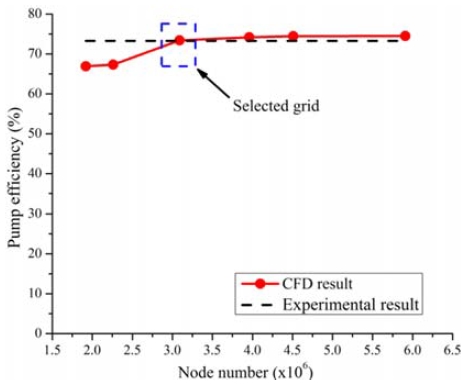
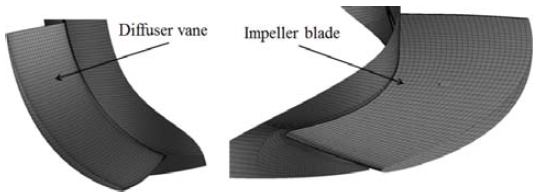
The boundary conditions of whole flow passages are introduced in Table 2. This boundary condition is adopted for all steady state calculations of both pump models. To reduce the calculation time and obtain reliable CFD analysis results, a grid sensitivity test was conducted. All meshes of fluid domains were generated using ANSYS ICEM [10]. Figure 6 shows the results of the grid test in terms of the efficiency of the new pump and different grid sizes of all fluid domains. From the comparison of the pump efficiency with the mesh number, a mesh of three million nodes was selected for CFD analysis. The averaged near-wall treatment y+ value of the main fluid domains of the selected grid are shown in Table 3. Meshes of one pitch of impeller blade and diffuser vane of the selected grid are illustrated in Figure 7.
4. Results and discussion
4.1 Performance curves
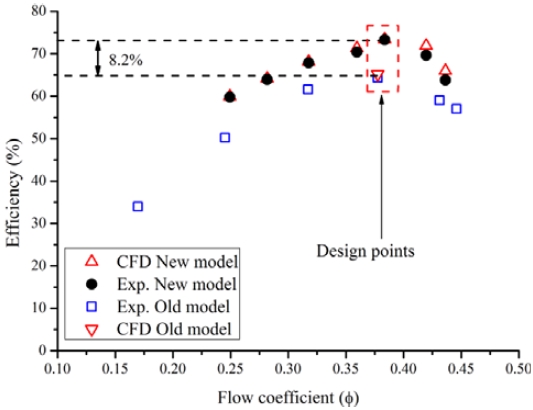
The performance curves of both pump models presents at various flow coefficients in Figure 8. The best efficiency points (BEP) of each pump model matched with the design points. The old pump model was chosen as a reference model with which to evaluate the performance of the new pump model and to validate the CFD results. The CFD results matched well with the experimental results for both models. In the experimental results, the efficiency of new model reached 73.4%, which is 8.2% higher than the efficiency of the old model at the design point. Moreover, under the all-flow conditions, the efficiency of the new model was higher than that of the old model.
4.2 Hydraulic loss analysis
Using hydraulic loss analysis for the pump models is a helpful way to understand the reason for the varying performances of the different designs of pump model. Hydraulic losses of all fluid domains were calculated using Equation (6) and Equation (7).
| (6) |
| (7) |
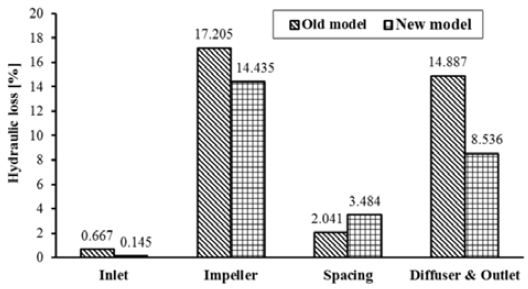
where Δp is the change of total pressure in the analyzed domain, Q is flow rate pumped of the pump model, T is the torque provided to the impeller through the shaft of the motor, and ω is the angular velocity of the impeller. The subscript “Imp.” means the impeller domain. A comparison of the hydraulic losses of the old and new models at the design point is shown in Figure 9. The hydraulic losses of the new model declined significantly compared with those of the old model in most of the fluid domains. The loss of impeller domain decreased from 17.2% in the old model to 14.4% in the new model. The losses of the diffuser and outlet domains reduced drastically from 14.9% in the old model to 8.5% in the new model. The loss of impeller domain showed the highest loss in both pump models. Thus, the internal flows of the impeller fluid domain need to be investigated in further detail.
4.3 Pressure contours in impeller domain
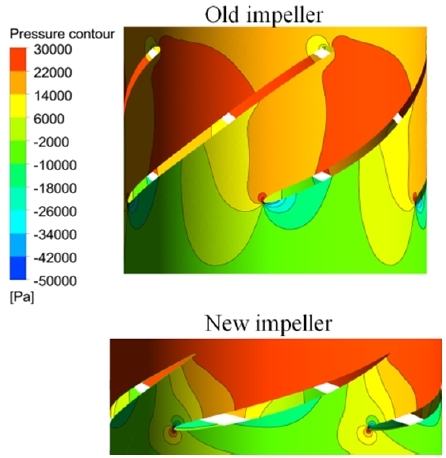
Figure 10 shows the static pressure contours of flow passages in both impeller models on a plane perpendicular to the flow direction at the middle of the impeller blades, at the BEP. The figure indicates a gradual increase in static pressure contours from the suction side (SS) to the pressure side (PS) of both pump model blades. The pressures that developed inside the flow passages of the new impeller were more uniform than those of the old model. Figure 11 presents the static pressure contours at the mid-span of the impeller models at the BEP. The static pressure in the flow passage around the blades increased owing to the effect of the blade lift force in both pump models. The lowest pressure is indicated at the suction side of the old impeller model. This is position at which where cavitation usually occurs in axial pumps.

Static pressure contours of the impeller models on a plane perpendicular to flow direction (from view of entrance flow) at the BEP
4.4 Streamlines in the impeller domain
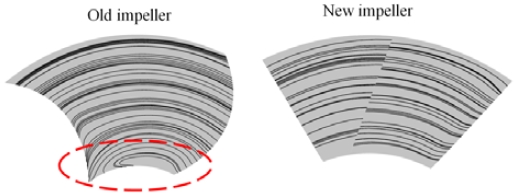
The streamlines of the old and new models are compared in Figure 12. Non-uniform flows were found in the vicinity of the hub area in the old model. Relatively large circulation areas occurred inside the old impeller passages, which is regarded to decrease the flow rate, and consequently the hydraulic power. Moreover, the loss in the impeller domain increased, and the pump efficiency decreased, as seen in the performance curves of the old pump model. In the new pump model, smooth streamlines are shown in the blade passages. Thus, the percentage loss in the impeller domain of the new pump model is lower than that of the old pump model; this demonstrates the higher efficiency of the new pump model.
4.5 Cavitation performance
The results of the internal flow analysis indicate that the lowest pressure areas of both models were in the leading edge. Therefore, the cavitation was analyzed to examine the areas that could start cavitation on the impeller blade. Both pump models were simulated under the BEP condition without changing the static pressure at the inlet of the pump. Thus, the efficiencies of neither pump model changed.
The Rayleigh–Plesset model was adopted as a cavitation model in the calculation analysis. The Rayleigh-Plesset equation [11] describes the growth of a vapor bubble in a liquid. The homogeneous model was selected with a pair of fluids; water refers to a value of “0” and water vapor (air) refers to a value of “1”. The values were used to evaluate the possibility of cavitation occurrence, as well as the areas on impeller surface in which cavitation could appear. The derivation and the parameters in the cavitation model are discussed extensively in F. Bakir et al. [12]. The standard parameters were used for the presented calculations.
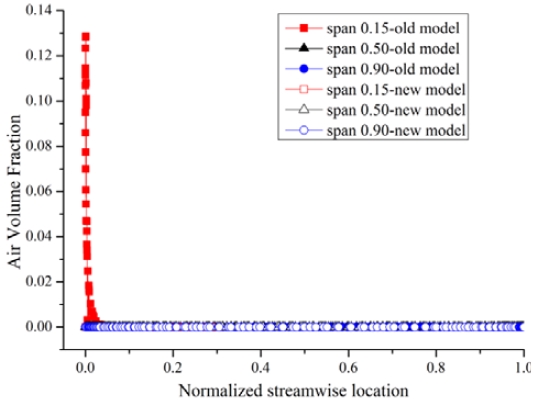
Figure 13 and Figure 14 illustrate the water-air volume fraction (AVF) contours and values on the impeller blade surfaces of both pump models at the BEP. A small area on the leading edge of the impeller blade of the old model indicates a maximum AVF value of 0.13. An AVF value of zero was found in all spans of the new impeller model. This means that both impeller models had a very low possibility of cavitation occurrence at the BEP condition.
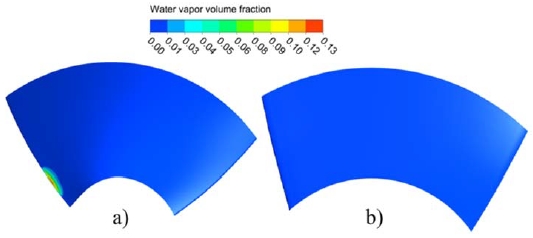
Water-air volume fraction contours on the impeller surfaces of (a) old model and (b) new model at the BEP
5. Conclusions
A new axial-flow pump model was designed to improve the performance of the old pump model. The experimental results matched well with the numerical results in both pump models. The efficiency of the new model achieved 73.4% in the experimental performance test, which is 8.2% higher than the efficiency of the old pump model at the design point. The increase in the efficiency in the new pump model was because of the significantly decreased hydraulic losses in the impeller, diffuser, and outlet domains in comparison with those of the old pump model. The flow passage of the new impeller model had a more uniform static pressure distribution than that of the old impeller model. The streamlines in the flow passages of the new impeller were smooth, unlike the complicated streamlines near the hub of the old impeller passages. The non-uniform flow caused large hydraulic losses in the impeller and outlet domains of the old pump model at the design point. Both impeller models had a very low possibility of cavitation occurrence at the design point.
Acknowledgments
This work was supported by the New and Renewable Energy of the Korea Institute of Energy Technology Evaluation and Planning (KETEP) grant funded by the Korea Government Ministry of Trade, Industry and Energy (No. 20163010060340).
Author Contributions
Conceptualization, V. L. Vu; Methodology, V. L. Vu; Software, Y. D. Choi; Validation, V. L. Vu; Formal analysis, V. L. Vu; Investigation, V. L. Vu ; Resources, V. L. Vu; Data Curation, V. L. Vu; Writing-original draft preparation, V. L. Vu; Writing-review and editing, V. L. Vu; Supervision, Y. D. Choi, Funding acquisition, Y. D. Choi.
References
-
A. Furukawa, T. Shigemitsu, and S. Watanabe, “Performance test and flow measurement of contra-rotating axial flow pump”, Journal of Thermal Science, 16(1), p7-13, (2007).
[https://doi.org/10.1007/s11630-007-0007-4]

-
M. Oshima, “A study on the improvement of performance of the axial flow pump”, Bulletin of JSME, 7(28), p729-737, (1964).
[https://doi.org/10.1299/jsme1958.7.729]

- A. A. Yevtushenko, A. N. Kochevsky, N. A. Fedotova, A. Y. Schelyaev, and V. N. Konshin, “Investigation of flow inside an axial flow pump of “GV-IMP” type”, Fluid Dynamics Issue of Cornell University, http://arxiv.org Accessed November 19, 2004.
-
A. Gusak, O. Demchenko, and I. Kaplun, “Application of small-sized low speed axial stages in well pumps for water supply”, Procedia Engineering, 39, p35-42, (2012).
[https://doi.org/10.1016/j.proeng.2012.07.005]

-
A. Gusak, O. Matvienko, and V. Nenja, “Investigation of energy losses in the flow section of the small-sized axial flow pump”, Applied Mechanics and Materials, 630, p29-34, (2014).
[https://doi.org/10.4028/www.scientific.net/amm.630.29]

- Manjunatha, and J. R. Nataraj, “Design and analysis of impeller blade for axial flow pumps”, International journal of engineering researches and management studies, 2(5), p1-31, (2015).
-
L. J. Shi, F. P. Tang, R. S. Xie, and W. P. Zhang, “Optimal design of multi-conditions for axial flow pump”, IOP Conference Series: Earth and Environmental Science, 49(6), p062028, (2016).
[https://doi.org/10.1088/1755-1315/49/6/062028]

- International standard IEC 60193, 2nd edidtion, International Electrotechnical Commission, Geneva, Switzerland, (1999).
-
V. L. Vu, Z. Chen, and Y. D. Choi, “Design and performance of a pico propeller hydro turbine model”, The KSFM journal of fluid machinery, 21(3), p44-51, (2018).
[https://doi.org/10.5293/kfma.2018.21.3.044]

- ANSYS Inc, “ANSYS CFX Documentation”, ver. 18.1, http://www.ansys.com Accessed May 16, 2017.
- P. J. Zwart, A. G. Gerber, and T. Belamri, “A two-phase flow model for predicting cavitation dynamics”, Fifth International Conference on Multiphase Flow, Yokohama, Japan, (2004).
-
F. Bakir, R. Rey, A. G. Gerber, T. Belamri, and B. Hutchinson, “Numerical and experimental investigations of the cavitating behavior of an inducer”, International Journal of Rotating Machinery, 10(1), p15-25, (2004).
[https://doi.org/10.1080/10236210490258034]


