The influence of water level and flow rate on vortex occurrence in pump sump
Copyright © The Korean Society of Marine Engineering
This is an Open Access article distributed under the terms of the Creative Commons Attribution Non-Commercial License (http://creativecommons.org/licenses/by-nc/3.0), which permits unrestricted non-commercial use, distribution, and reproduction in any medium, provided the original work is properly cited.
Abstract
A pump sump is an indispensable facility in cargo ships, irrigation, drainage, agriculture and industrial processes. The water intake conditions around suction bell mouth significantly affect the performance of the whole pumping system. However, there are different types of undesirable vortices that occur in pump sump, such as submerged vortex and air entraining vortex. Accompanying with the variety of vortex, noise and vibration also appears. In this study, a scaled down model of a pump sump was designed and constructed. The occurrence of the vortex was the concentrated target which was investigated under various suction pipe inlet conditions. With different water levels, flow rates and a fixed distance from the bottom to suction pipe bell mouth, detailed experiments were conducted. Additionally, a computational fluid dynamics (CFD) analysis was performed, verifying the influence of water level and flow rate on visualization and formation of vortex obtained in the experiment. The CFD analysis results were compared with those of the experiment.
Keywords:
Pump sump, Internal flow characteristics, Air entraining vortex, Submerged vortex, Suction condition, Computational fluid dynamic (CFD) analysis1. Introduction
A pump sump, for drawing water from a reservoir or river, is widely used in agriculture irrigation, city drainage, and industrial water supply and cargo ships. The performance of the pump sump significantly affect the water intake system efficiency. Thus, it should satisfy the diverse requirements of the entire system. Many important factors must be considered, such as, the shape and the size of water tank, bell mouth, submergence depth, flow rate, and water level. Usually, some undesirable vortex occur in the connection between the inlet bell mouth and water supply tank in the pump sump, such as submerged or air entraining vortices. If the vortices cannot be suppressed promptly, there is a considerable negative effect on the water intake system, accompanied by terrible noise and vibration.
Up to now, investigations of different types of vortices in the pump sump have been performed. Different standard prototype configurations have been established, for example, Turbomachinery Society of Japan (TSJ) Standard [1], HI Standard of America [2]. To reduce the experimental apparatus costs of pump sump, J. Matsui et al.[3] established a scaling model with relatively high flow rate and used several different computational CFD codes with one-phase flow and the same boundary conditions to simulate the water supply system. The CFD analysis results and experimental data were compared with each other to show the differences. L. Cecilia et al.[4] performed vortex detection to validate the prediction ability of CFD code. The absolute value of the total vorticity was selected as a useful tool for visualizing the different characteristics of the concentrated vortex.
Additionally, A. C. Bayeul et al.[5] also used a commercial CFD code to predict the flow behavior in the pump sump and studied the flow characteristics of air entrainment by comparing multi-phase numerical study results with experimental results. Y. Lee et al.[6] investigated the effect of the suction leaning angle on the pump sump. C. G. Kim et al.[7] examined the flow characteristics around the suction pipe and investigated the effect of an anti vortex device for suppressing the submerged vortex.
This study is aimed to investigate the relationship between water levels and flow rate with a fixed distance from the water tank bottom to the bell mouth and check the flow characteristics in the pump sump via detailed experiments and CFD analysis.
2. Experimental apparatus and numerical method
2.1. Experiment setup
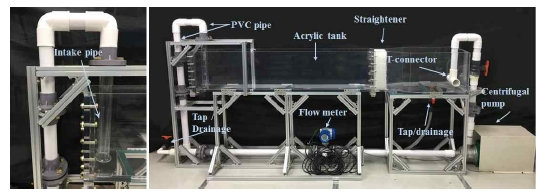
Figure 1 shows the experimental test apparatus of the pump sump. The shape of the water tank flow passage is cuboid. Transparent acrylic resin was used as the construction material for the water tank, which was more convenient for visual observation of different types of vortex. The bell mouth was set under the water level. The centrifugal pump drove the water from the suction pipe to the T-connector and the water was released into the water tank. A straighter in the water tank was employed for combing the water flow pattern to make the water flow smoother. The real-time flow rate through the intake pipe can be measured by a flow meter in the return circuit. At the end of the pump sump experiment, the water remaining in the water tank flow passage can be drained out through two drainage taps, which was convenient for repeating the experiment.
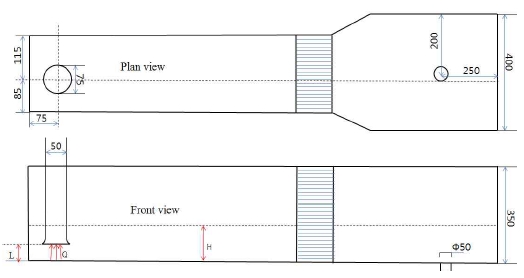
Figure 2 shows the plan and front views of the water tank flow passage model. The size and some parameters of the pump sump experimental apparatus are presented. The height of the water tank is 350 mm. The inlet diameter of the bell mouth and the suction pipe are D = 80 mm and d = 50 mm, respectively. The distance from the rear wall to the center line of the suction pipe was 75 mm. For more easily inducing vortex in the water tank, the location of the suction pipe was not in the center position between the left and right walls. The distance from the suction pipe to the left wall was 85 mm. And the distance from the suction pipe to the right wall was 115 mm. L is the distance between the bell mouth of suction pipe and the bottom floor of water tank. Q is the flow rate of the test centrifugal pump and H is the water level in water tank. These three factors significantly affect the flow pattern and characteristics of the pump sump. In this study, with L fixed. Q and H were investigated via several detailed experiments. Quantitative analysis was conducted to investigate the occurrence of the vortex.
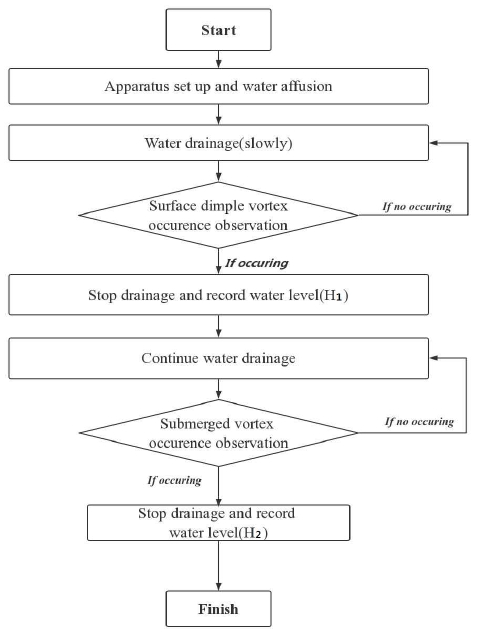
A series of experiments was conducted to find out the relationship between vortex occurrence and the flow rate with respect to water level. The critical value of the water level for the air entraining and submerged vortices at different flow rates was recorded. The flow rates have been set as 2.55, 3.52, 4.45, 5.51, 6.62, 7.43, 8.32 and 9.01 m3/h in the detailed experiment as shown in Table 1. L was fixed as 30 mm. The experiment process is shown in Figure 3. H1 and H2 represent the critical water levels for the surface dimple and submerged vortices, respectively.
2.2. Numerical method
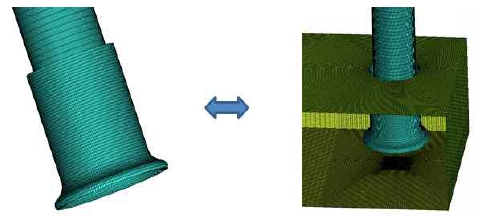
To identify the occurrence of a visible vortex, the flow pattern and vortex characteristics were investigated via numerical method. Additionally, a three-dimensional model was established. The finite volume method of ANSYS CFX [8] was employed to do numerical simulation. The multi-phase flow in the water tank was simulated. J. Matsui et al.[3] have presented different CFD simulation cases with a tetrahedral mesh and a hexahedral mesh using different CFD softwares. According the results of the CFD simulation, the hexahedral mesh could better display the water surface and vortex visualization. Therefore, for the numerical grid, a hexahedral mesh was applied in all the flow field as shown in Figure 4. To ensure more accurate simulation results, the average value of y+ for the full fluid domain was set below 33. The mesh around the bell mouth was refined, and a grid number of about 1.3 × 10⁶ was employed in the whole fluid domain.
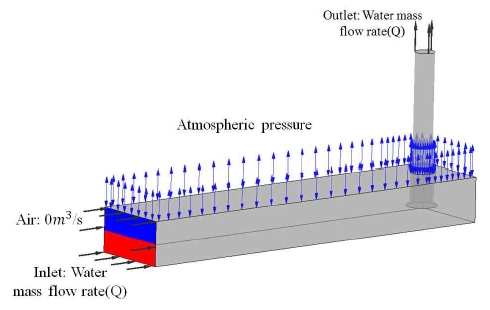
The boundary conditions of the CFD analysis are shown in Figure 5, which are the same with those used in Case 13 of the experiment, water flow rate was set as 8.32 m3/h at both the inlet and the outlet. There is no speed setting in the air above water level. Air flowed freely. The atmospheric pressure was set for the upper surface of the flow passage. The no-slip wall condition was applied to the pump sump wall region and unsteady state calculations were performed. The two equation turbulence model of the shear stress transport was adopted in the numerical simulations.
3. Results and discussion
3.1 vortex visualization
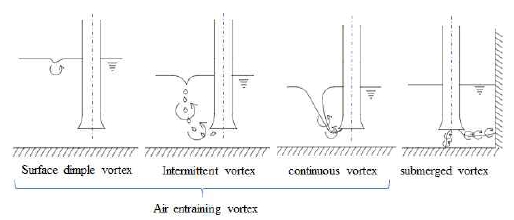
Figure 6 presents the TSJ standard for vortex classification in pump sump. Surface dimple, intermittent and continuous vortex are classified as air entraining vortices. Different types of vortices typically vary significantly in the appearance. Sometimes, multiple types of vortices exist simultaneously. The surface dimple vortex is the easiest to generate. Usually the dimple vortex is located near the water surface around the suction bell mouth, making it an intermittent vortex. Intermittent and continuous vortex can be converted into each other. The submerged vortex is the most difficult to generate and must satisfy many requirements simultaneously. During the experiment, when a submerged vortex occurred, the water surface around the bell mouth changed drastically.
The vortex intensity is affected by many factors. Additionally, the interval between vortex appearance and disappearance is an important factor. further investigation will be conducted in the future study.
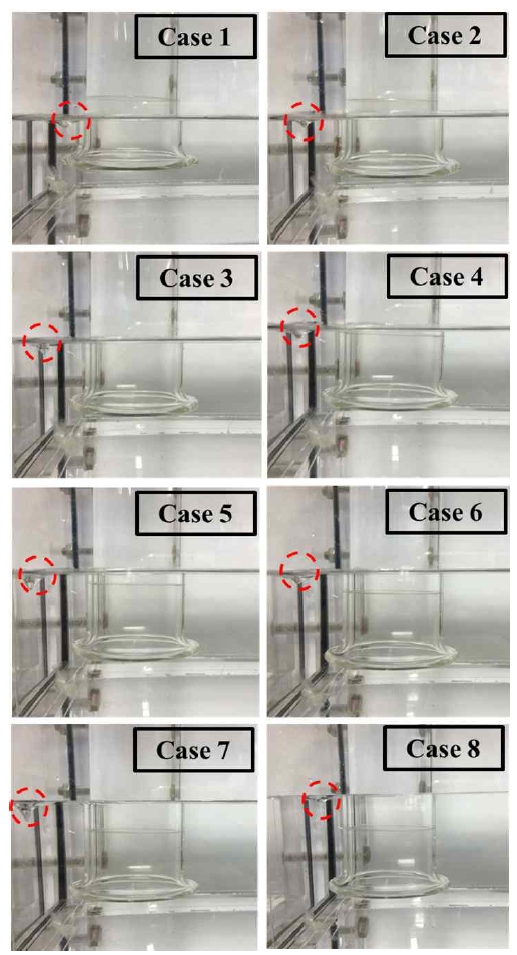
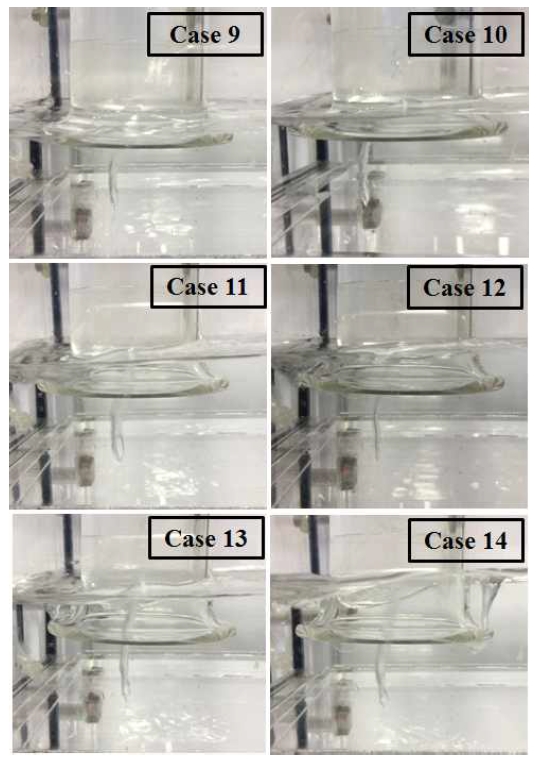
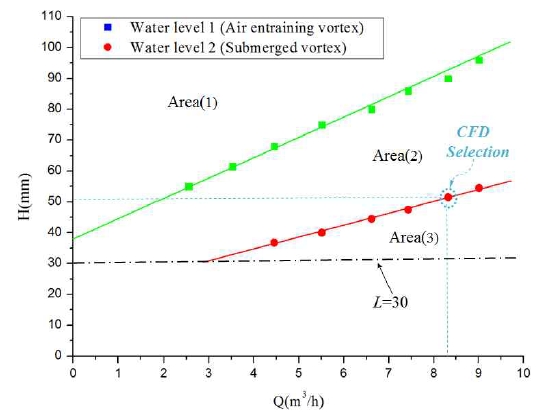
Figure 7 shows that a surface dimple vortex occurred near the water surface. When it occurred, it had a little effect on the fluctuation of the water surface. It disappears and appears irregularly. Figure 8 shows the occurrence of submerged vortex under the water surface. Immediately after this vortex appeared, the critical value was recorded. The occurrence of submerged vortex was always accompanied by the air entraining vortex. Additionally, vibrations and noise appeared. The data recorded during the experiment are presented in Table 2. Water level 1 (H1) and water level 2 (H2) are the critical water levels of air entraining and submerged vortices, respectively. At the height of L = 30 mm, and when submerged vortex occurred, the water surface was unstable. The critical water level value at the flow rate of 4.45 m3/h(Case 9) was 37.5 mm. This means that the bell mouth was only 7.5 mm below the water level. If the water level decreased further, air was inhaled into the suction pipe. Thus, in the series of experiment involving submerged vortex occurrence, six cases were examined. For dimple vortex, there were eight cases.
Figure 9 shows the nearly linear relationship between the water level and the flow rate in the experiment. The distance from the bell mouth to the bottom of the water tank was set as 30 mm. As shown in the graph, the region was divided into three areas. In Area (1), no vortex occurred. And in Area (2), only air entraining vortex occurred. The submerged vortex usually occurred in Area (3). As the occurrence of submerged vortex, it required a higher flow rate and lower water level.
3.2. The formation and behaviour of the submerged vortex
To verify the occurrence of visible vortex, Case 13 was simulated. Water level was set as the critical value for Case 13 recorded when the submerged vortex occurred (H2 = 50.5 mm). Because the formation and behaviour of the submerged vortex are more complicated, it can be more representative. Numerical simulation with two-phase flow was performed by using numerical commercial code of ANSYS CFX.
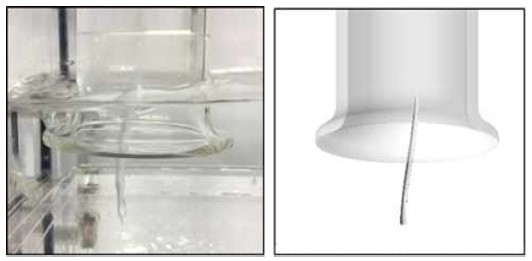
Figure 10 shows a comparison of numerical and experimental submerged vortex (Case 13). The vortex observation revealed the locations of the two vortices were located at little above the bell mouth center. More internal flow characteristics need to be investigated to determine the features of vortex occurrence.
A cut plane was set in the bell mouth of the suction pipe. The diameter of the contour circle was equal to the diameter of the suction pipe bell mouth.
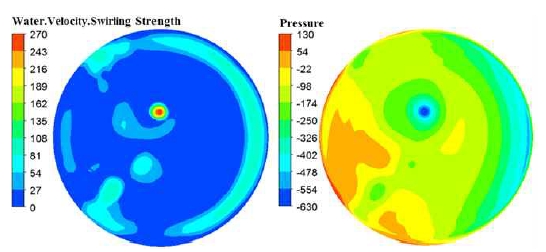
Figure 11 presents the CFD analysis results for the water velocity swirling strength distribution and pressure distribution, respectively. at the location of vortex occurrence, the water velocity swirling strength and pressure were relatively high and low, indicating that in this region, the non-uniformity of the flow pattern was high and the water flow was unstable.
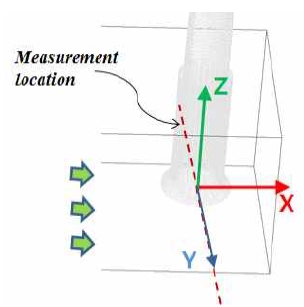
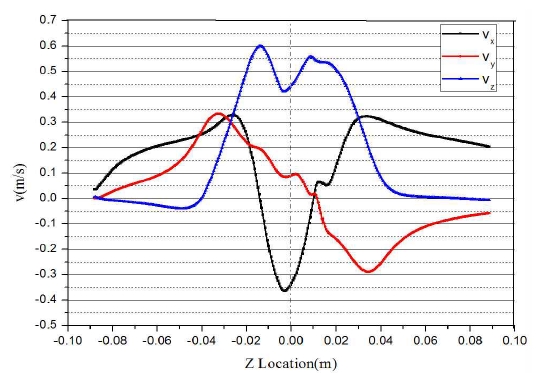
To check the internal flow behaviors and characteristics, the distribution of the component velocity was investigated. The origin of the coordinate system was located at the center of the suction pipe bell mouth and the measurement location of velocity component is shown in Figure 12. Figure 13 shows the velocity component distribution in each direction. There was a large negative velocity component of vx at the center of the bell mouth. The absolute value of vy had an approximately symmetric distribution. The velocity changed from negative to positive, and circulation flow was formed. Therefore, the vortex was generated.
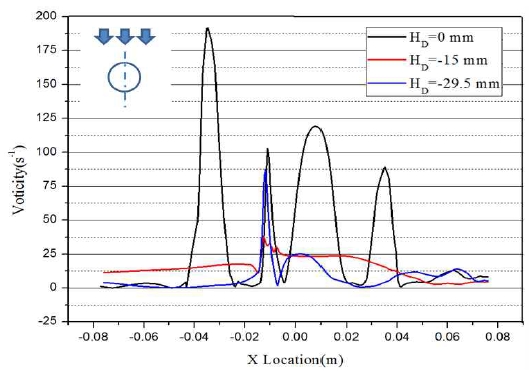
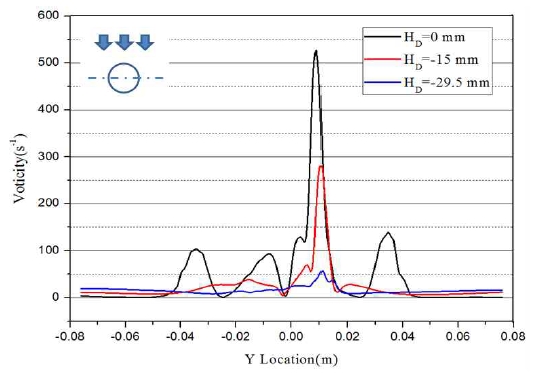
To examine the vortex intensity around the suction pipe, the vorticity at different locations was plotted in Figure 14 and Figure 15. The measurement locations were set at height of HD = 0 mm, -15 mm and -29.5 mm. The HD value of 0 mm and 29.5 mm correspond to the location near the bell mouth and near the bottom of the water tank, respectively. Figure 14 shows the vorticity distribution in the flow direction. The vorticity near the suction bell mouth was higher, indicating large unstable flow patterns. And Figure 15 shows a similar distribution in the direction of channel width. It can be inferred that around suction bell mouth, the water flow is very unstable and flow non-uniformity was higher.
4. Conclusions
A series of experiments was conducted to investigated the suction pipe inlet condition. The critical values of the water level for the dimple and submerged vortices at different flow rates were measured. An approximate linear relationship between the water level and the flow rate was verified at a fixed distance from the bell mouth to the bottom floor.
Additionally, a CFD analysis was performed to examine the behaviour and characteristics of the internal flow. A vortex core has been obtained. The pressure in the vortex core region was lower than that in other regions, and the velocity swirling strength was higher.
The vorticity was higher near the suction bell mouth than other locations. Additionally, the flow pattern was more unstable and flow non-uniformity was higher.
Author contribution
The following statements should be used “conducted the experiments, M. Guo; CFD analysis of the pump sump, M. Guo; wrote the original draft paper, M. Guo; planed the study project, Y. D. Choi; contributed the experiment facility and analysis tools, Y. D. Choi; reviewed the paper, Y. D. Choi.”
References
- Turbomachinery Society of Japan, Standard Method for Model Testing the Performance of a Pump Sump, (TSJ S002), (2005).
- Hydraulic Institute, American National Standard for Pump Intake Design, (ANSI/HI 9.8-1998), (2000).
- J. Matsui, K. Kamemoto, and T. Okamura, “CFD benchmark and a model experiment on the flow in a pump sump”, Proceeding of 23rd IAHR symposium on Hydraulic Machinery and Systems, Yokohama, Japan, (2006).
- L. Cecilia, and L. G. Sergio, “Vortex detection in pump sumps by means of CFD”, Proceeding of 25th IAHR symposium on Hydraulic Machinery and Systems, Punta Del Este, Uruguay, (2010).
- A. C. Bayeul, S. Simonet, G. Bois, and A. Issa, “Two-phase numerical study of the flow field formed in water pump sump: Influence of air entrainment”, Proceeding of 26th IAHR symposium on Hydraulic Machinery and Systems, Lille, France, (2012).
-
Y. Lee, K. Y. Kim, Z. M. Chen, Y. D. Choi, “The effect of suction pipe leaning angle on the internal flow of pump sump”, Jounal of the Korean Society of Marine Engineering, 8(849), p855-2015.
[https://doi.org/10.5916/jkosme.2015.39.8.849]

-
C. G. Kim, Y. D. Choi, J. W. Choi, Y. H. Lee, “A study on the effectiveness of an anti vortex device in the sump model by experiment and CFD”, Proceeding of 26th IAHR symposium on Hydraulic Machinery and Systems, Lille, France, (2012).
[https://doi.org/10.1088/1755-1315/15/7/072004]

- ANSYS Inc., ANSYS CFX Documentation, (Ver. 18.1), http://www.ansys.com Accessed May 3, 2018.

