Effects of number and location of nozzles on flow characteristics in vertical scrubber
Copyright © The Korean Society of Marine Engineering
This is an Open Access article distributed under the terms of the Creative Commons Attribution Non-Commercial License (http://creativecommons.org/licenses/by-nc/3.0), which permits unrestricted non-commercial use, distribution, and reproduction in any medium, provided the original work is properly cited.
Abstract
The allowable emission limit of sulfur oxides from ships was reduced to 0.1% in emission control areas and will be reduced to 0.5% in other areas from 2020. Many technologies have been developed for satisfying sulfur oxide emission limits. A wet scrubber device is being developed as the preferred technology. In this study, a small vertical wet scrubber was examined for high-speed small engines. The effects of the number and location of nozzles on cleaning water distribution and flow distance were investigated. Regarding the nozzle location, the cleaning water distributions and flow distances in the scrubber were better with horizontal nozzles than with vertical nozzles. Regarding the number of nozzles in the scrubber, six yielded the best results.
Keywords:
Vertical scrubber, Nozzle location, Nozzle quantity, Water distribution1. Introduction
Marine engines emit SOX, NOX, and particulates into the atmosphere during combustion, which not only pollutes the atmosphere but also endangers human health. According to the IMO’s MARPOL Annex VI [1]-[3] adopted in 2011, the upper limit of SOX emissions for marine vessels was reduced from 1% to 0.1% staring in 2015 for North America, the Baltic Sea, the North Sea, and the Caribbean Maritime Space, and the upper limit of SOX emission standards for ships will be reduced to 0.5% in global sea areas outside the emission control areas (ECAs). There are three main control measures for satisfying SOX limits: using low-sulfur oil, using low-sulfur gas, and installing SOX scrubbers. B. Y. Yoo et al. assessed the cost of fuels used in a marine engine, and the results showed that liquefied natural gas is better than marine gas oil [4]. G. Belgiorna et al. investigated the effects of the compression ratio for a dual fuel engine [5]. I. Galarraga et al. applied a stochastic model and found that the remaining lifetime and sailing time in ECAs are the determinant factors for the installation of a scrubber rather than the switching fuel [6]. They reported that the installation of a waste gas scrubber is the most cost-effective method. To satisfy the relevant international regulations, many shipping lines and institutions have performed studies for improving the efficiency of dust removal and developing desulfurization for various scrubbers [7]-[18].
This study is based on the D4AK-C diesel engine, which has a small scrubber for a marine engine. The number and location of nozzles and the total flow rate of cleaning water were tested for the small vertical scrubber, and the best conditions were identified.
2. Mathematical Model and Computational Conditions
2.1 Mathematical equations
Computational fluid dynamics based on the following Navier–Stokes equations were used [15]-[18].
Continuous Equation
| (1) |
Momentum Equation
| (2) |
| (3) |
Energy Equation
| (4) |
| (5) |
Here, U is the velocity vector, γ is the stress, SM is the momentum, T is temperature, δ is a unit matrix, ρ is the density, p is the pressure, h is the enthalpy, λ is the heat conduction ratio, v is the volume, u is the internal energy, and SE is the generated energy.
The SST(Shear stress transport) model was used to calculate the turbulent flow.
Turbulent Viscosity
| (6) |
Blending Function
| (7) |
| (8) |
Here, k is the turbulence kinetic energy, ω is the specific dissipation rate, ρ is the density, S is the strain rate magnitude, and a* is the compensation factor.
2.2 Calculation Modeling
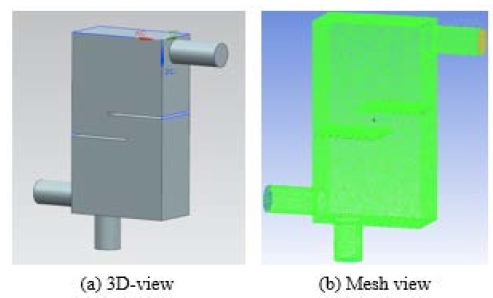
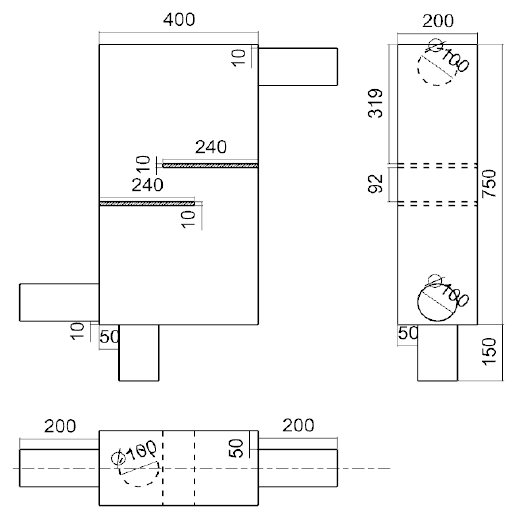
The volume of the small vertical scrubber for a marine engine was 60 L. Fluid simulation was performed under four working velocities of the D4AK-C diesel engine. The exhaust gas was simulated using the vapor model with a gas–liquid ratio of 99:1. A three-dimensional (3D) view of the grids and a sectional view were obtained using NX 9.0, as shown in Figure 1 and Figure 2, respectively.
The scrubber is divided into an air inlet pipe (down left), an air outlet pipe (upper right), a water outlet pipe (down), and a washing room. Exhaust gas enters through the inlet pipe and exits via the outlet pipe, and the washing liquid is discharged to the water outlet pipe.
2.3 Boundary conditions
The specifications of the D4AK-C diesel engine are listed in Table 1. Rotational speeds of 700, 1,000, 1,300, and 1,600 rpm were used for the simulation, and the gas flow rates were calculated according to the working conditions. The exhaust gas velocities of the D4AK-C diesel engine and the corresponding exhaust gas flow rates are presented in Table 2.
Mesh files were set up using ICEM CFD. The same number of mesh elements and nodes was generated to reduce the effect of the mesh on the calculation. The Volume Mesh was adopted, and the mesh type was Tetra/Mixed. The element size of the mesh was 0.009. The mesh number was maintained over 2 million, and the final results remained good.
3. Calculation results and analysis
3.1 Nozzle location
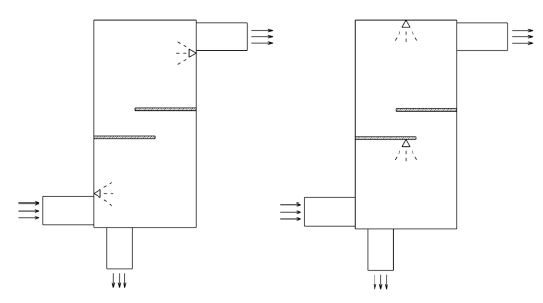
The first simulation was performed in two groups. The variable was the location of the two conical nozzles. For Group 1, two horizontal nozzles were placed on the wall. For Group 2, there were two vertical nozzles: one on top of the wall and another at the bottom of the second baffle. The two scrubbers and the detailed specifications of the nozzles are shown in Figure 3 and Table 3. Exhaust gas entered the scrubber from the bottom-left pipe and was discharged from the top-right pipe. Cleaning water was sprayed from the pipe at the bottom.
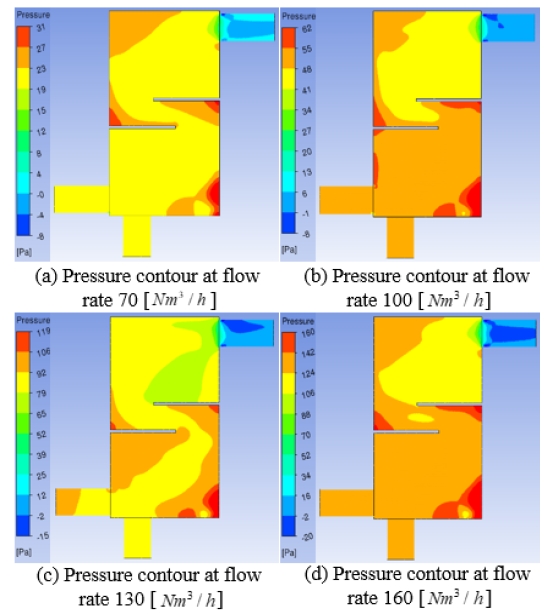
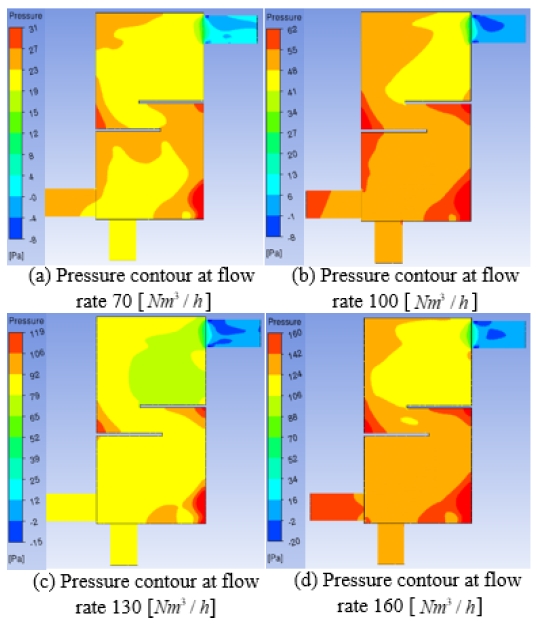
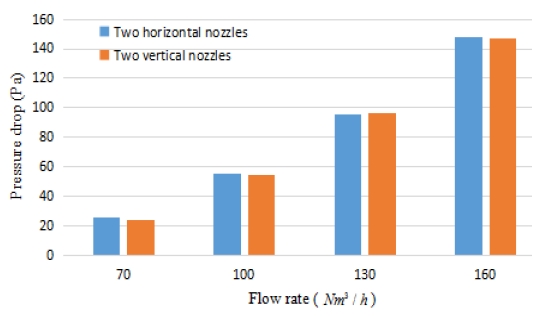
The pressure drop is related to the power and efficiency of a diesel engine. A smaller pressure drop indicates a higher efficiency. The total pressure distribution of the scrubber with vertical and horizontal nozzles is shown in Figure 4 and Figure 5, respectively. A comparison of the pressure drops is shown in Figure 6. According to Figure 4 and Figure 5, at a flow rate of 70 Nm3/h, the inlet pressure of the scrubber with two horizontal nozzles was 25 Pa, and that of the scrubber with two vertical nozzles was 24 Pa. At a flow rate of 100 Nm3/h, the inlet pressure at the horizontal nozzles was 55 Pa, and that at the vertical nozzles was 54 Pa. At a flow rate of 130 Nm3/h, the inlet pressure of the scrubber with the horizontal nozzles was 95 Pa, and that of the scrubber with the vertical nozzles was 96 Pa. At a flow rate of 160 Nm3/h, the inlet pressure at the horizontal nozzles was 148 Pa, and that at the vertical nozzles was 147 Pa. In every case, the outlet pressure was approximately 0 Pa. The pressure decreased from the inlet to the outlet.
In Figure 6, the red and blue histograms correspond to the scrubbers with two vertical nozzles and two horizontal nozzles, respectively. The pressure drop increased with the gas flow rate. The pressure drops for the two scrubbers were approximately the same at each flow rate. This indicates that the two nozzle configurations had little effect on the pressure drop. Additionally, the two scrubbers exhibited no significant differences with regard to power utilization.
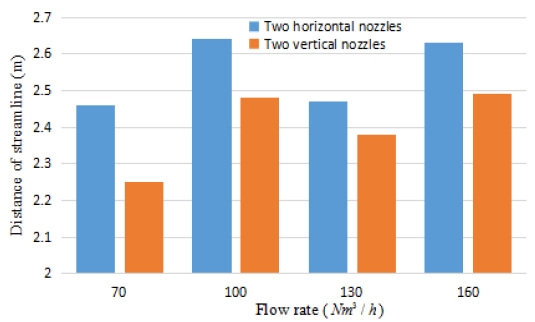
The flow distance is defined as the average streamline distance from the inlet to the outlet. A longer streamline distance indicates a longer mixing time of the exhaust gas and cleaning water. Figure 7 shows the streamline distance of the two scrubbers with different locations of nozzles. The streamline distance of the scrubber with the two horizontal nozzles was longer than that of the scrubber with the vertical nozzles at all the flow rates. The streamline distance increased with the flow rate up to 100 Nm3/h, decreased at a flow rate of 130 Nm3/h, and increased again at 160 Nm3/h. The results indicate that the horizontal nozzles had a better washing effect than the vertical nozzles.
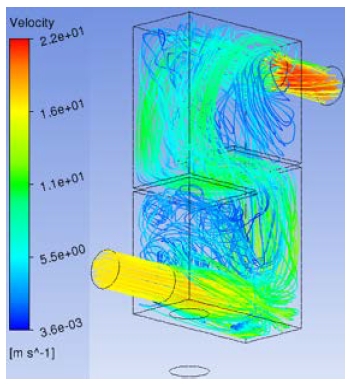
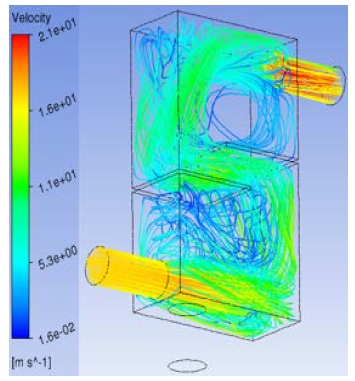
The streamline contours of the two scrubbers at a flow rate of 160 Nm3/h are shown in Figure 8 and Figure 9, respectively. The velocity of the gas increased from the inlet to the outlet. The outlet gas velocity increased with the flow rate.
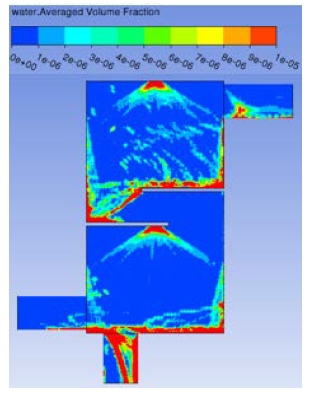
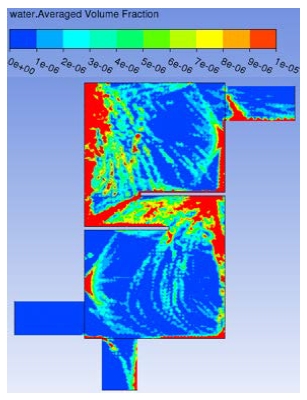
The water volume fraction distributions of the two scrubbers with vertical and horizontal nozzles at a flow rate of 160 Nm3/h are shown in Figure 10 and Figure 11, respectively. In the scrubber with vertical nozzles, the water was concentrated on the upper surface of the baffles at different flow rates, and there was no water at the bottom of the baffles. In the scrubber with horizontal nozzles, the water was well-distributed, filling the whole cavity, and the vapor was concentrated on the wall. The water distributions showed that the washing effect was better with the horizontal nozzles than with the vertical nozzles.
3.2 Number of nozzles
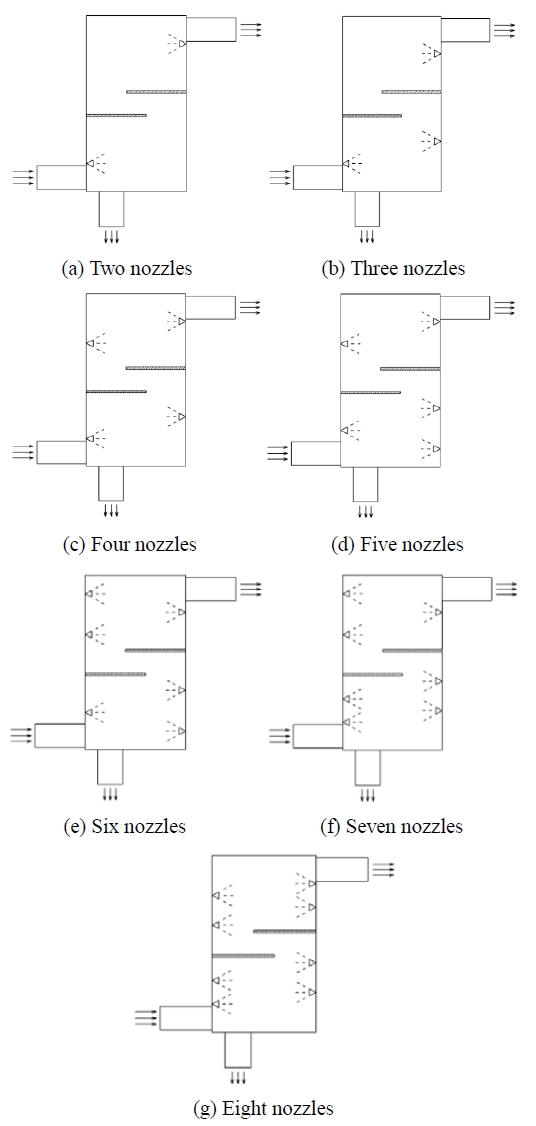
The simulation results showed that the small vertical scrubber with two horizontal nozzles has better performance than that with vertical nozzles. Next, for analyzing the effect of the number of nozzles, the total mass flow rate was kept constant at 0.001 kg/s. The specifications of the nozzles and a sectional view are presented in Table 4 and Figure 12, respectively.
After analyzing the scrubber with different numbers of nozzles, the values of the pressure drop were determined, as shown in Table 5.
According to Table 5, at a flow rate of 70 Nm3/h, the pressure drop was 24 Pa in each case. At a flow rate of 100 Nm3/h, the inlet pressure of the scrubbers with two, three, and four nozzles was 54 Pa, and that for five, six, seven, and eight nozzles was 55 Pa. At a flow rate of 130 Nm3/h, the inlet pressure with five nozzles was 95 Pa, that with seven nozzles was 97 Pa, and that in the other cases was 96 Pa. At a flow rate of 160 Nm3/h, the inlet pressure with two, three, seven, and eight nozzles was 148 Pa, and that with four, five, and six nozzles was 147 Pa. The results indicate that the inlet pressure hardly changed when the number of nozzles was increased and the total particle mass flow rate was kept constant.
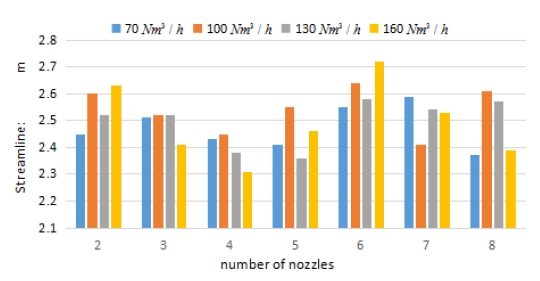
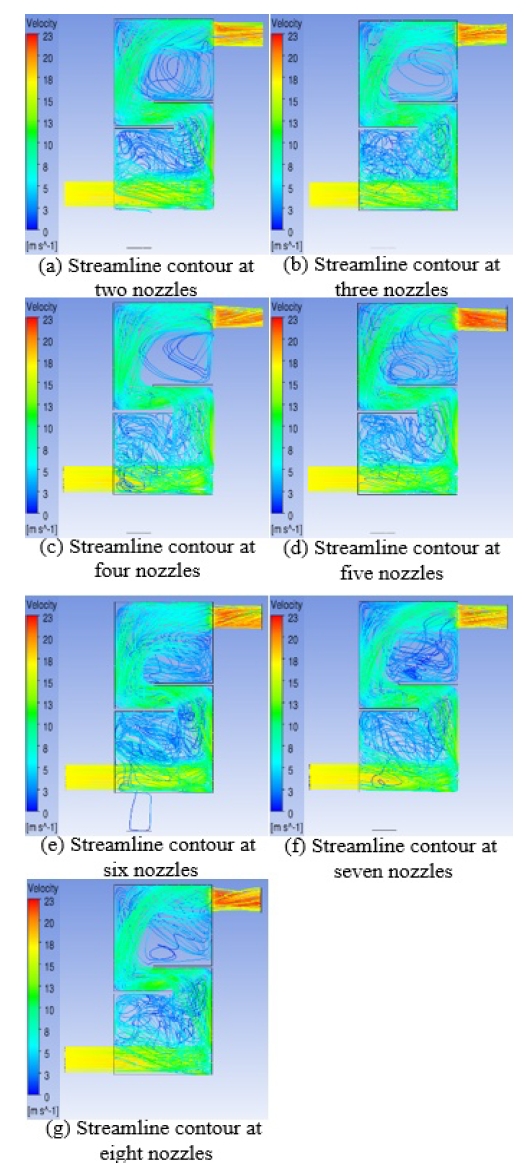
By analyzing the average flow distance, the streamline distributions of all the scrubbers were obtained, as shown in Figure 13. Here, the histograms of different colors indicate different gas flow rates. The streamline distance decreased with the increase of the number of nozzles up to four, increased from four to six nozzles, and decreased again from six to eight nozzles. Overall, the streamline distance was the longest for the scrubber with six horizontal nozzles, indicating that this scrubber had the longest mixing time of the cleaning water and exhaust gas. Additionally, the scrubber with six nozzles had the best washing effect. The streamline distributions are shown in Figure 14. The inlet velocities were approximately 17 m/s in each case. The highest outlet velocity (22 m/s) was achieved with five nozzles. The outlet velocities in the other cases were approximately 20 m/s.
3.3 Detail analysis for optimal structure
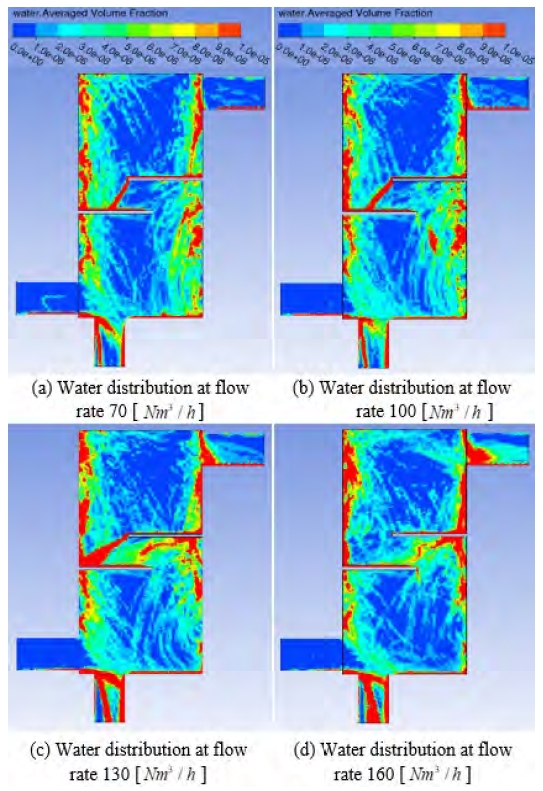
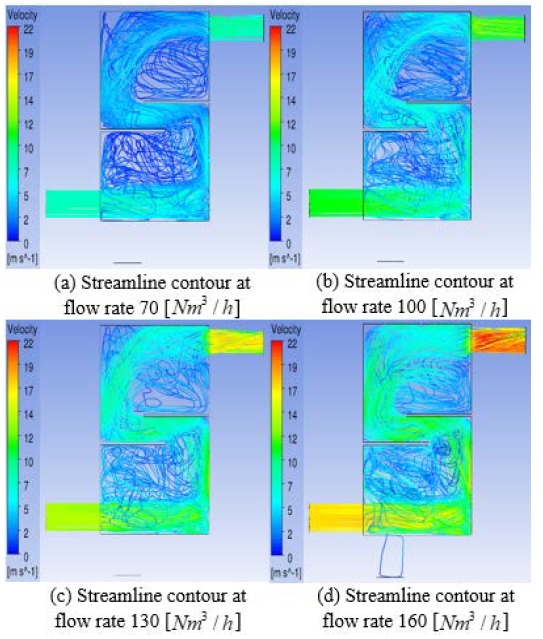
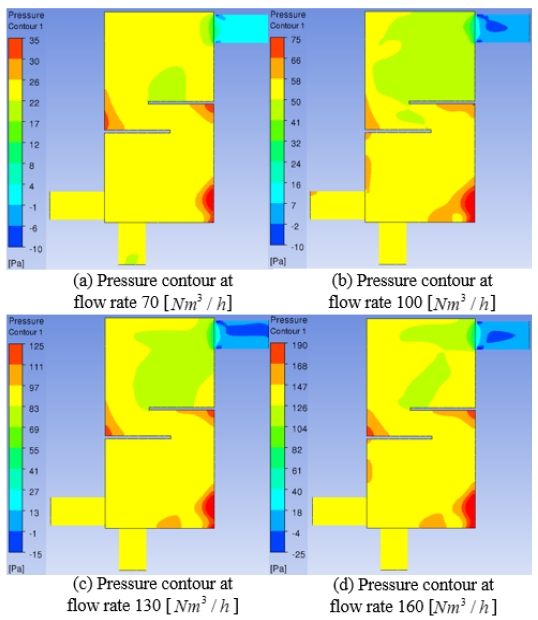
According to the foregoing discussion, the scrubber with six horizontal nozzles had the optimal inner structure. The water distributions, streamline contours, and pressure contours are shown in Figure 15, Figure 16, and Figure 17, respectively.
Figure 15 shows the water distribution for the scrubber with six horizontal nozzles. The water distribution was homogeneous at each flow rate. The chambers were full of water, and the water was concentrated on the walls and at the corners of the scrubber.
Figure 16 shows that the velocity of the gas increased from the inlet to the outlet at each flow rate. At a flow rate of 70 Nm3/h, the inlet and outlet velocities were approximately 7 and 8 m/s, respectively. At a flow rate of 100 Nm3/h, the inlet and outlet velocities were 11 and 13 m/s, respectively. At a flow rate of 130 Nm3/h, the inlet and outlet velocities were 14 and 16 m/s, respectively. At a flow rate of 160 Nm3/h, the inlet and outlet velocities were 17 and 20 m/s, respectively.
Figure 17 shows that the outlet pressures were approximately 0 Pa at each flow rate. At a flow rates of 70, 100, 130, and 160 Nm3/h, the inlet pressure was approximately 25, 58, 97, and 147 Pa, respectively. The pressure decreased from the inlet to the outlet, and the pressure drop increased with the flow rate. The pressure was very high at the corners of the baffles and the bottom-right corner of the chamber.
4. Conclusion
The effects of the number and location of nozzles in a vertical scrubber for small marine engines were investigated.
Regarding the nozzle location, there were no significant differences of the pressure drop between scrubbers with horizontal nozzles and vertical nozzles. The vapor distributions in the scrubber with horizontal nozzles were better than those in the scrubber with vertical nozzles. The streamline distance in the scrubber with horizontal nozzles was longer than that in the scrubber with vertical nozzles.
The number of nozzles in the scrubber was tested with horizontal nozzles. The pressure drops did not differ significantly for different numbers of nozzles, and the streamline distance was the longest for six nozzles.
A detailed analysis was performed for the case of six nozzles. The pressure drop increased with the flow rate, a high pressure appeared in the corner between baffles, and the water was well-distributed over the chamber.
Author Contributions
The following statements should be used “Methodology & Analysis, First Author and Corresponding Author; Writing-Original Draft Preparation, First Author and Corresponding Author; Review & Editing, First Author and Corresponding Author; Discussion, Second and third Author.”
References
-
I. Animah, A. Addy-Lamptey, F. Korsah, and J. S. Sackey, “Compliance with MARPOL Annex VI regulation 14 by ships in the Gulf of Guinea sub-region: Issues, challenges and opportunities”, Transportation Research Part D: Transport and Environment, 62, p441-455, (2018).
[https://doi.org/10.1016/j.trd.2018.03.020]

-
O. Schinas, and Ch. N. Stefanakos, “Selecting technologies towards compliance with MARPOL Annex VI: The perspective of operators”, Transportation Research Part D: Transport and Environment, 28, p28-40, (2014).
[https://doi.org/10.1016/j.trd.2013.12.006]

-
G. A. Moncayo, “Testing the boundaries between the Basel and MARPOL regimes: are they complementary or mutually exclusive?”, Transportation Research Procedia, 25, p233-250, (2017).
[https://doi.org/10.1016/j.trpro.2017.05.391]

-
B. Y. Yoo, “Economic assessment of liquefied natural gas (LNG) as a marine fuel for COZ carriers compared to marine gas oil (MGO)”, Energy, 121, p772-780, (2017).
[https://doi.org/10.1016/j.energy.2017.01.061]

-
G. Belgiorno, G. Di Blasio, and C. Beatrice, “Parametric study and optimization of the main engine calibration parameters and compression ratio of a methane-diesel dual fuel engine”, Fuel, 222, p821-840, (2018).
[https://doi.org/10.1016/j.fuel.2018.02.038]

-
L. M. Abadie, N. Goicoechea, and I. Galarraga, “Adapting the shipping sector to stricter emissions regulations: Fuel switching or installing a scrubber?”, Transportation Research Part D: Transport and Environment, 57, p237-250, (2017).
[https://doi.org/10.1016/j.trd.2017.09.017]

-
L. Jiang, J. Kronbak, and L. P. Christensen, “The costs and benefits of sulphur reduction measures: Sulphur scrubbers versus marine gas oil”, Transportation Research Part D: Transport and Environment, 28, p19-27, (2014).
[https://doi.org/10.1016/j.trd.2013.12.005]

-
I. Panasiuk, and L. Turkina, “The evaluation of investments efficiency of SOX scrubber installation”, Transportation Research Part D: Transport and Environment, 40, p87-96, (2015).
[https://doi.org/10.1016/j.trd.2015.08.004]

-
Z. Chen, H. Wang, J. Zhuo, and C. You, “Experimental and numerical study on effects of deflectors on flow field distribution and desulfurization efficiency in spray towers”, Fuel Processing Technology, 162, p1-12, (2017).
[https://doi.org/10.1016/j.fuproc.2017.03.024]

-
Sh. Darake, M. S. Hatamipour, A. Rahimi, and P. Hamzeloui, “SO2 removal by seawater in a spray tower: Experimental study and mathematical modeling”, Chemical Engineering Research and Design, 109, p180-189, (2016).
[https://doi.org/10.1016/j.cherd.2015.11.027]

-
X. J. Tang, T. Li, H. Yu, and Y. M. Zhu, “Prediction model for desulphurization efficiency of onboard magnesium-base seawater scrubber”, Ocean Engineering, 76, p98-104, (2014).
[https://doi.org/10.1016/j.oceaneng.2013.11.009]

-
C. C. Tseng, and C. J. Li, “Eulerian - Eulerian numerical simulation for a flue gas desulfurization tower with perforated sieve trays”, International Journal of Heat and Mass Transfer, 116, p329-345, (2018).
[https://doi.org/10.1016/j.ijheatmasstransfer.2017.09.024]

-
I. Boscarato, N. Hickey, J. Kaspar, M. V. Prati, and A. Mariani, “Green shipping: Marine engine pollution abatement using a combined catalyst/seawater scrubber system. 1. Effect of catalyst”, Journal of Catalysis, 328, p248-257, (2015).
[https://doi.org/10.1016/j.jcat.2014.12.013]

-
D. Flagiello, A. Erto, A. Lancia, and F. Di Natale, “Experimental and modelling analysis of seawater scrubbers for sulphur dioxide removal from flue-gas”, Fuel, 214, p254-263, (2014).
[https://doi.org/10.1016/j.fuel.2017.10.098]

-
C. Windt, J. Davidson, and J. V. Ringwood, “High-fidelity numerical modelling of ocean wave energy systems: A review of computational fluid dynamics-based numerical wave tanks”, Renewable and Sustainable Energy Reviews, 93, p610-630, (2018).
[https://doi.org/10.1016/j.rser.2018.05.020]

-
H. Huang, T. Sun, G. Zhang, L. Sun, and Z. Zong, “Modeling and computation of turbulent slot jet impingement heat transfer using RANS method with special emphasis on the developed SST turbulence model”, International Journal of Heat and Mass Transfer, 126, p589-602, (2018).
[https://doi.org/10.1016/j.ijheatmasstransfer.2018.05.121]

-
S. M. Lee, and K. H. Park, “Study of inner structure of in-line scrubbers”, Journal of the Korean Society of Marine Engineering, 42(1), p1-9, (2018), (in Korean).
[https://doi.org/10.5916/jkosme.2018.42.1.1]

-
K. Son, J. Y. Lee, and K. H. Park, “The effect of spray flow rate, aspect ratio, and filling rate of wet scrubber on smoke reduction”, Journal of the Korean Society of Marine Engineering, 39(3), p217-222, (2015), (in Korean).
[https://doi.org/10.5916/jkosme.2015.39.3.217]


