A study on oil-film detection technique using IR-UWB radar-based Bi-LSTM
Copyright © The Korean Society of Marine Engineering
This is an Open Access article distributed under the terms of the Creative Commons Attribution Non-Commercial License (http://creativecommons.org/licenses/by-nc/3.0), which permits unrestricted non-commercial use, distribution, and reproduction in any medium, provided the original work is properly cited.
Abstract
Oil-film detection techniques are largely divided into two types: contact and noncontact. Of these techniques, the accuracy of the noncontact type with a wider measurement range degrades as the distance between the water surface and the equipment increases. Thus, this paper proposes a noncontact oil-film detection technique that uses a bidirectional long short-term memory (Bi-LSTM) based on impulse radio ultrawideband (IR-UWB) radar to raise the detection accuracy in terms of the distance and type of oil film. The proposed technique improves the performance of distance measurement by subtracting the background signal other than the oil-film through singular value decomposition to subtract the noise signal generated according to the weather and spatial environment. To solve the memory loss problem that occurs because of the sequence length of the input signal, this study was conducted to improve learning performance as well as real-time detection accuracy. The improvement can be achieved by modulating the signals with spectral entropy and power spectrogram through preprocessing, shortening the sequence and extending the sequence to the frequency domain. To verify the accuracy and effectiveness of the proposed system, an experimental environment was designed to generate oil films. The experiment was conducted by separating the equipment from the water surface with a distance ranging from 0.5 to 1.5 m at 10 cm intervals. Kerosene, diesel oil, cooking oil, and water, with 11 measurement distances, were grouped into 44 categories to analyze the learning and detection accuracy. The experimental results showed that the accuracy of the proposed system was 95.31 % in terms of distance measurement and oil-film detection, which could accurately classify the types and distances of oil films.
Keywords:
IR-UWB Radar, Oil film, Bi-LSTM, SVD, Spectral entropy, Power spectrogram1. Introduction
Water pollution due to oil spills in coastal and river environments can lead to widespread damage, such as ecosystem destruction and property damage, and it can require significant time and effort for repair [1]. Thus, oil-film detectors have been widely installed in facilities, including offshore plants and river purification facilities, to detect oil spills in the early stage of contamination and further minimize damage accordingly. Oil-film detectors can be classified into infrared [2]-[4], laser [5][6], and microwave [7][8] types according to their sensor types, as well as contact type and noncontact type, depending on the detection method. Contact-type detectors having sensors that are in direct contact with the water surface require periodic maintenance, such as the replacement of sensors and removal of foreign materials around the machine. Furthermore, contact-type detectors are disadvantageous in comparison with noncontact-type detectors because of the significantly narrower detection range. However, because noncontact detectors have advantages in that the oil component can be easily identified according to the high oil-film detection rate and the refractive index of the oil film, the causes of the spill can be easily analyzed. Thus, noncontact detectors are commonly applied to rivers and vessels.
Because noncontact oil-film detectors employing infrared and synthetic aperture radar (SAR), depending on the distance, undergo image acquisition and processing, the circuit design can be performed with simplicity and high accuracy in comparison with the other type. However, light disturbance is severe, and it is difficult to distinguish the oil components [9]. Thus, numerous studies have been conducted by combining images and learning algorithms. The latest research related to this trend can be exemplified as follows.
D. B. Chenault et. al. [10] proposed an oil-film detection technique using infrared-based thermal polarimetric sensing. The algorithm in the study is used to distinguish between water and oil by using polarized light and store the results as images alone. In this manner, real-time detection is possible, however it is difficult to distinguish the type of oil film.
S. Singha et al. [11] proposed an artificial neural network (ANN)-based classification algorithm that verifies an oil spill by using images acquired through the SAR. The study proposed an algorithm that executes the division and classification of images through two ANN designs, and the experimental results revealed a high accuracy of 91.6%.
However, because that algorithm is customized for long-distance detection, it has limitations on the minimization and utilization of equipment. Furthermore, although the algorithm is suitable in wide locations, such as the ocean, the spatial limitations of that algorithm prevent detection in narrower spaces, such as rivers or water supply facilities. Thus, a new approach is required for miniaturization and better utilization of equipment.
To solve this problem, a new impulse radio ultrawideband (IR-UWB) radar oil-film detection technique based on bidirectional long short-term memory (Bi-LSTM) is proposed. It is a new noncontact type. The proposed method uses IR-UWB radar to obtain the optimal distance between the water surface and the equipment during the learning stage for the oil classification, and it further utilizes singular value decomposition (SVD) to subtract the noise signals that occur depending on the change in spatial environments regarding the learned data, thereby improving the performance of distance measurements. Moreover, to solve the vanishing and exploding gradient problems that occur because of the high sequence length of the input signal, this study uses a spectral entropy and power spectrogram that shortens the sequence and further extends the time series data into the time–frequency domain for analysis, aiming at the improvement of real-time detection and learning, as well as detection accuracy.
2. Related Theories
2.1 UWB Radar Technology
UWB is a wireless communication technology that transmits a high volume of information at a low power by using a frequency band of 500 MHz or more, which is a very wide band in comparison with a spectrum. Because of its short pulse, IR-UWB radar can provide centimeter-scale precision for distance measurement with high utilities, including positioning, people counting, noncontact respiration and heartbeat measurement, and human rescue in disaster situations. In this study, P410 RCM equipment was used, and a P410 module was utilized as the radio transceiver with its operating frequency ranging from 3.1 to 5.3 GHz. The repetition rate for the transmitted pulses was 10 MHz, and the received data could be sampled at a rate of 61 ps. The receiver was configured to generate short pulses continuously while the receiver was connected to the host PC to capture the data. The P410 was used in a monostatic radar mode, and the omnidirectional antenna used in this experiment had a linear phase response, voltage standing wave ratio of 1.75:1, and gain of 3 dBi. The IR-UWB radar could detect and measure distance by using the time-of-arrival method, and it could calculate the range based on the received linear-path signal.
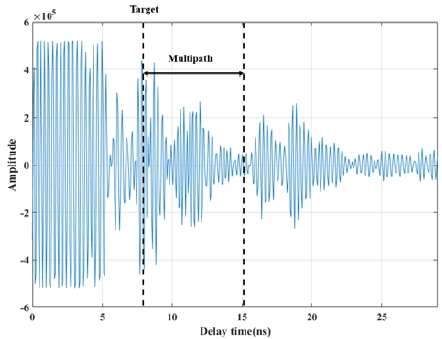
Figure 1 shows the signal received by emitting a pulse through an IR-UWB radar. Here, the x-axis refers to the delay time, and the y-axis refers to the intensity ratio of the received signal. In a real signal, a multipath signal is present behind the linear-path signal, which could cause an error in the distance measurement with respect to the target, because a weak signal or signals with various intensities are received in comparison with a linear path. The mathematical model of the measured signal is can be represented as
| (1) |
where m(t) refers to the signal received by the impulse input, ai and τi refer to the amplitude and propagation delay of the i-th sample in the received signal, and p(t) refers to the waveform of the signal, and n(t) refers to the noise received from the surroundings. Because the received target signal changes depending on the medium present on the water surface, the detected waveform would vary according to the type of oil. However, because the background signal from the surroundings, not to mention the signal of the target, is measured due to noise, this problem should be resolved.
2.2 Long Short-Term Memory Networks
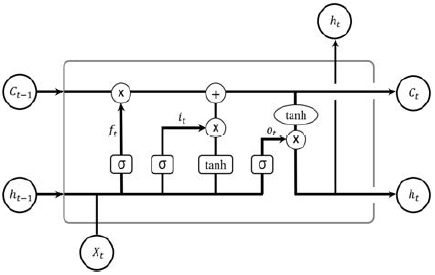
The major feature of a recurrent neural network (RNN) is a type of memory that stores data and is capable of processing sequential information, such as time series data, while a long-term memory loss problem with respect to long-sequence data occurs in an actual RNN. A proposed method to solve this problem is LSTM [12]. Although the basic operation of the LSTM is the same as that of a conventional RNN, the long-term memory loss problem could be resolved by adding input, forget, and output gates inside the cell. Figure 2 shows the cell structure of LSTM.
Here, ct refers to the cell state, ht refers to the current output, and it, ft, and ot refer to input, forget, and output gates, respectively. These are computed as follows
| (2) |
| (3) |
| (4) |
| (5) |
| (6) |
The input gate adjusts the input data, as shown in Equation (4), the forget gate determines how much the cell state of the previous time is reflected through Equation (5), and the output gate adjusts the input data as shown in Equation (6). The W included in each Equation refers to the weight value applied in each state, σ refers to the sigmoid, and tanh is the hyperbolic tangent representing the activation function used in each interval. The LSTM forgets a certain amount of the cell state data at the previous cell state through the forget gate, and further multiplies the previous output value and the current input value by the output from the input gate to control the input data, thus updating the current cell state, as shown in Equation (2). Furthermore, the LSTM multiplies the output of the current cell by the output gate, as shown in Equation (3), to control the number of output data. Thus, because the LSTM updates the current cell state by adjusting how much the previous cell state is forgotten and how much new input data are accepted, the LSTM can learn even long-sequence data without the vanishing gradient phenomenon observed in the basic RNN. However, if the sequence length is too high, the learning time increases, and a memory loss problem arises. Thus, it is necessary to shorten the sequence length to solve this problem.
3. Oil-Film Detection System Using Bi-LSTM Based on IR-UWB Radar
3.1 Architecture of Proposed System
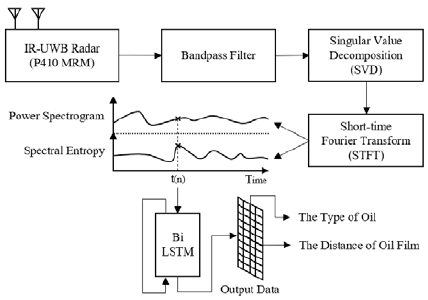
The architecture of the proposed oil-film detection system using an IR-UWB-radar-based Bi-LSTM is shown in Figure 3. From objects and the environment through the impulse signal emitted from the IR-UWB radar, the signals are collected according to the propagation delay. The collected IR-UWB radar signals are converted into power spectrum and spectral entropy through preprocessing and feature extraction to reduce the length of the sequence. The preprocessed signals classify in detail the type of oil film and the distance to the water surface by using Bi-LSTM.
3.2 Feature Extraction Using Preprocessing
In the preprocessing step, the optimal distance between the equipment and the water surface is secured, the influence by the environment is prevented, and the noise signals of the learned data are subtracted to extract the features. For this reason, the received signals are passed through the bandpass filter to minimize the noise, and its background subtraction is performed through SVD. SVD is a technique to diagonalize the matrix as in eigen decomposition. In this study, the background signal, which is the signal generated by the surrounding environment or object with no change according to the time change in the signals collected through IR-UWB, can be obtained. First, the IR-UWB signals collected over time are constructed as follows
| (7) |
where m refers to the measured signal strength, i refers to the number of samples, and j refers to the number of samples according to the time of the received signal. The SVD for the collected IR-UWB signal M is given by
| (8) |
where U is a n × n unitary matrix, V is a m × m unitary matrix, and Σ is a n × m diagonal matrix composed of nonnegative numbers. As a left singular vector, U is an orthogonal matrix having MMT eigenvectors as a column vector, and V, which is a right singular vector, is an orthogonal matrix having MTM eigenvectors as a row vector. Σ is an m × n diagonal matrix having nonzero MMT or MTM eigenvalues as diagonal elements. Because the background signal can be subtracted by using the low coefficient approximation through the matrix that has been constructed in the previously described manner, the learned detector can prevent the overfitting of influence on spatial environment change.
As the length of the sequence increases, the RNN cannot learn because of the vanishing and exploding gradient problems, as the network structure that models time series/dynamic features is extended. Thus, to raise the stability of the detection rate, the data are reconstructed by the instantaneous frequency and spectral entropy in the power spectrogram through the short-time Fourier transform (STFT). The spectral entropy is used to extract the spectral characteristics of the signal components directly or indirectly reflected by the oil. This is summarized by the power spectrum and probability distribution as follows
| (9) |
where p(k;i) refers to the k-th frequency bin of the i-th frame and further denotes the probability mass function of the spectrum obtained using the frequency normalization method. Because learning is effective in deep learning when the size of the input/output data is small, the normalization technique can be represented as
| (10) |
where, μ refers to the average of the entire training dataset, and σ refers to its standard deviation. All input and output data are scaled to the [0,1] interval to improve network performance during training.
3.3 Bi-LSTM-Based Network Design
The impulse data from the IR-UWB radar are time series data composed of signal intensity according to arrival time of the transmitted signal reflected by the object or environment. By converting this signal into a power spectrogram and a spectral entropy according to the arrival time through the proposed preprocessing algorithm, the temporally overlapped features are observed, different from the existing time series. Thus, in this study the signal classification of the IR-UWB radar was performed based on sequential patterns of temporally overlapping features through a Bi-LSTM-based deep-learning model.
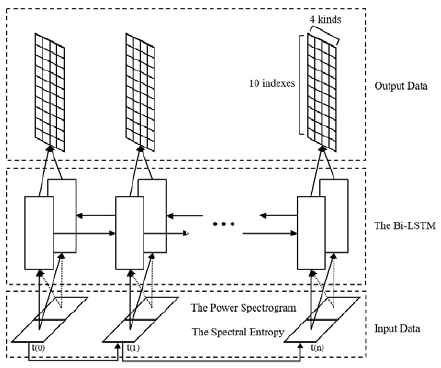
The proposed STFT-based preprocessing algorithm divides the time series signal into short-term segments and further conducts the frequency domain analysis. In this respect, the input of the model is time series data that are structurally scanned according to the period. The features of these signals include the order of the signals, as well as their structural patterns, and the typical unidirectional LSTM structure is relatively vulnerable to structural changes. Thus, this study proposes a feature classification model using Bi-LSTM-based time–frequency that extracts structurally rich features by analyzing input signals bidirectionally. The proposed Bi-LSTM learns the time series data independently separated in the opposite directions from the input of two channels, and it further classifies the oil films at each moment into 40 categories and separates the oil film of each moment. Figure 4 shows a feature classification model using the proposed Bi-LSTM based time–frequency.
As shown in Figure 4, t(n) refers to the n-th moment in a discrete data environment, and the initial time is t(0). The data of the two channels preprocessed at the bottom are input and classified into the 4 × 10 data through the Bi-LTSM layer. Here, the 4 × 10 matrix of the output refers to the type of oil film and the distance categorized by a 10 cm unit.
The output of the proposed model is executed according to a one-hot encoding data structure to reduce the likelihood of misinterpreting the data as linear data at the time of learning by setting any designated numerical criteria for sorting the output label to predict the type and distance of the oil film. For the weight initialization, the weights are set with random variables that follow the Gaussian normal distribution having an average of 0 and a standard deviation of 1. This study uses the Adam Optimizer algorithm to find optimal parameters that can quickly decrease the value of the loss function.
4. Experiment and Results
4.1 Configuration of Learning and Experimental Data
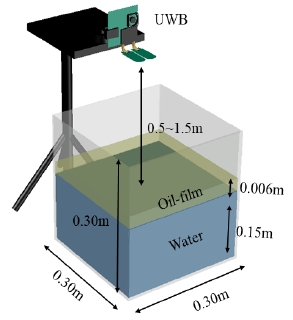
An experiment was performed to verify the accuracy of the proposed algorithm in detecting the oil-film types and measuring the distance between the IR-UWB radar and the water surface. In this respect, the experimental environment was configured as shown in Figure 5. The water was filled to a height of 0.15 m in a water tank having a volume of 0.3 × 0.3 × 0.3 m3, and the thickness of the oil film was set as 0.006 m to measure the changes by varying the types of oil film as diesel oil, kerosene, and cooking oil and the height of the UWB radar by 0.1 m intervals in the range of 0.5 to 1.5 m.
The total scan time of the reflected signal of the IR-UWB radar was 29 ns, and the continuous signal was measured in a 0.0605 ns unit to construct 480 samples. The experiment was designed to detect four types of water surface without an oil film with diesel oil, with kerosene, and with cooking oil and further to measure the distance between the water surface and the IR-UWB radar at 10 cm intervals in the range of 0.5 to 1.5 m. A total of 17,600 datasets was collected with 44 labeled data from this setup. The collected data were used to perform simulations using MATLAB for learning and detection.
This study used 90 % of the training dataset and 10 % of the test dataset to verify the performance and effectiveness of the proposed technique based on this setup, which shows the change according to background signal subtraction and signal compression, learning accuracy, and loss function value. Through the learned network structure, this study was aimed at verifying the accuracy according to the distance as well as the detection accuracy according to the type of the oil film.
4.2 Experimental Results and Analysis
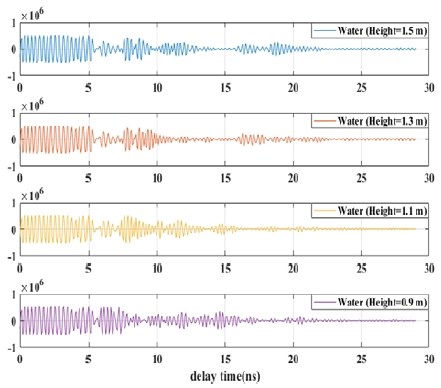
Figure 6 shows the average signal measured at 1.5, 1.3, 1.1, and 0.9 m distances between the IR-UWB radar and the water surface in the time domain. The x-axis refers to the delay time, and the y-axis refers to the reflected signal intensity. Because the delay time occurs in the time domain of raw data according to the distance between the IR-UWB radar and the water surface, the distance could be measured, even with the liquid. However, because of the multipath signal, the signal was further generated in the intervals excluding the target.
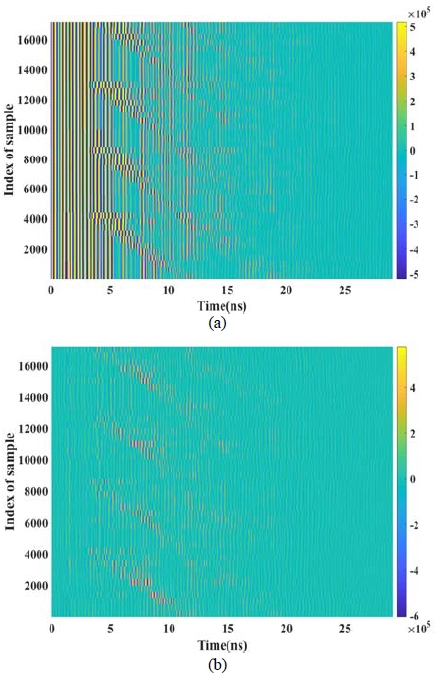
Figure 7 (a) confirms that the collected signals were received together with signals other than those from the target via the IR-UWB radar, and Figure 7 (b) shows the result from the target signals from which the background signal was subtracted through the SVD. The x-axis refers to the time of the reflected signal, and the y-axis refers to the order of the samples. The results show that other signals were significantly subtracted in the intervals excluding the target signal. In this manner, learning together with background signals could be prevented, thereby minimizing the influence by changes in the surrounding environment.
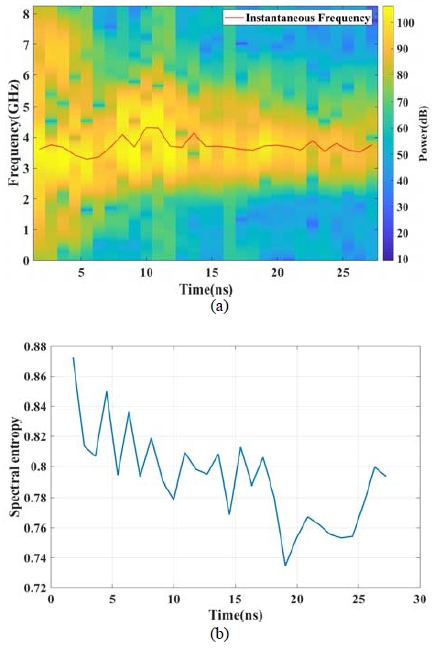
Figure 8 shows the instantaneous frequency as well as spectral entropy according to the power spectrogram to extract the features of the target signal by shortening the sequence and extending the sequence into the time-frequency domain after subtracting the background signal. The x-axis refers to time and the y-axis the frequency and the spectrum entropy. As a result, the input signal was shortened from 480 × 1 to 29 × 1 to resolve the problem that the learning was interrupted when the sequence was long. According to the learning results, the computation amount was significantly reduced from 10 min and 31 s to 3 min and 8 s.
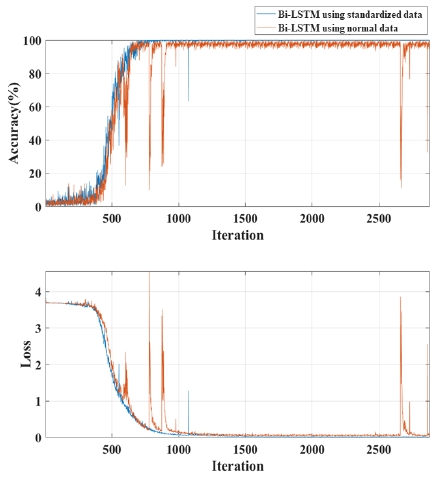
Figure 9 shows the learning results through signal averaging using power spectrogram and spectral entropy. The x-axis refers to iteration and the y-axis refers to the accuracy and loss function value according to the learning iteration. Through a comparison of the results of applying the averaging and the normal data, the accuracy after the learning was determined to be 92.66 % and 97.33 %, respectively, and the loss ratio was determined as 0.2299 and 0.0747, respectively. These results show a satisfactory level of performance enhancement. However, the rate of change for accuracy increases in the iteration interval of 500 to 1000 times, while the application of averaging has significantly reduced the rate of change.
The proposed algorithm for the detection of 1,760 test datasets showed an accuracy of 95.31 %, when obtaining the measurements using Bi-LSTM through the averaged signals, power spectrogram, and spectral entropy. The results further showed that the learning did not proceed when the averaged signal alone was used. The accuracy of the learning in signal processing was determined to be 93.87 % by using the power spectrogram and spectral entropy.
5. Conclusion and Discussion
In this paper, we proposed a new noncontact-type oil-film detection technique based on IR-UWB, which is a near-field radar method to measure the distance between the water surface and the equipment as well as the accuracy of oil-film detection. The proposed algorithm used the SVD to increase the detection rate of oil films and subtract the background signal with respect to other factors, such as water and structures. To solve the vanishing and exploding gradient problems that occur because of the long sequence of the radar input signals, the experiment was designed to model the time series/dynamic features of the RNN type by using spectral entropy and the power spectrogram. The experimental results showed that the learning accuracy was 97.33 % and the detection rate for water, cooking oil, kerosene, and diesel oil was 95.31 %, revealing similar performance in comparison to conventional technologies. However, the results of the system proposed in this study are insufficient for verifying the effectiveness and validity in a realistic environment, because the experiment was restricted to a local range. there are other contaminants that are mixed other than pure oils, as well as a change in the water level that can occur because of external influences in a real environment. Although the effectiveness and validity with respect to these environmental variables should be verified, experiments with mixed contaminants in rivers or oceans could cause actual environmental contamination, which is regarded as a limitation of the experimental environment. Furthermore, although waves can be generated by external influences, such as wind and gravity, it is necessary to analyze the basic environment with limited environmental variables, because it is somewhat difficult to control the external influences in a realistic environment. To overcome this difficulty, future experiments are planned using mixed contaminants that are similar to those in a realistic environment. Because it is difficult to conduct experiments in a realistic environment, this study should be extended to an oil-film detection study considering the change of the water surface through an artificial wave generator.
References
- J. Beyer, H. C. Trannum, T. Bakke, P. V. Hodson, and T. K. Collier, “Environmental effects of the Deepwater Horizon oil spill: A review”, Marine Pollution Bulletin, 110(1), p28-51, (2016).
- H. Y. Shen, P. C. Zhou, and S. R. Feng, “Research on multi-angle near infrared spectral-polarimetric characteristic for polluted water by spilled oil”, International Society for Optics and Photonics, In International Symposium on Photoelectronic Detection and Imaging, 8193, (2011).
- C. Andreou, and V. Karathanassi, “Endmember detection in marine environment with oil spill event”, International Society for Optics and Photonics, 8180, (2011).
-
M. Fingas, and C. Brown, “Review of oil spill remote sensing”, Marine pollution bulletin, 83(1), p9-23, (2014).
[https://doi.org/10.1016/j.marpolbul.2014.03.059]

- M. Fingas, Oil Spill Science and Technology, Gulf Professional Publishing, (2011).
-
A. K. Sarma, and A. G. Ryder, “Comparison of the fluorescence behavior of a biocrude oil and crude petroleum oils”, Energy & fuels, 20(2), p783-785, (2006).
[https://doi.org/10.1021/ef050294f]

- O. P. N. Calla, H. K. Dadhich, and S. Singhal, “Oil spill detection using SSM/I satellite data over Bombay High location in Arabian Sea”, Indian Journal of Radio and Space Physics, 42(1), p52-59, (2013).
- O. P. N. Calla, N. Ahmadian, and S. Hasan, “Estimation of emissivity and scattering coefficient of low saline water contaminated by diesel in Cj band (5.3 GHz) and Ku band (13.4 GHz)”, Indian Journal of Radio and Space Physics, 40(5), p267-274, (2011).
-
A. Myasoedov, J. A. Johannessen, V. Kudryavtsev, F. Collard, and B. Chapron, “Sun glitter as a “tool” for monitoring the Ocean from Space”, IEEE International Conference on 2nd Environment and Transportation Engineering (RSETE), p1-4, (2012).
[https://doi.org/10.1109/rsete.2012.6260759]

- D. B. Chenault, J. P. Vaden, D. A. Mitchell, and E. D. DeMicco, “Infrared polarimetric sensing of oil on water”, Proceedings of International Society for Optics and Photonics, 9999, (2016).
-
S. Singha, T. J. Bellerby, and O. Trieschmann, “Satellite oil spill detection using artificial neural networks”, IEEE Journal of Selected Topics in Applied Earth Observations and Remote Sensing, 6(6), p2355-2363, (2013).
[https://doi.org/10.1109/jstars.2013.2251864]

- S. Hochreiter, and J. Schnidhuber, “Long short-term memory”, Neural computation, 9(8), p1735-1780, (1997).

