Cryogenic flow behavior in porous media with experimental approach
Copyright © The Korean Society of Marine Engineering
This is an Open Access article distributed under the terms of the Creative Commons Attribution Non-Commercial License (http://creativecommons.org/licenses/by-nc/3.0), which permits unrestricted non-commercial use, distribution, and reproduction in any medium, provided the original work is properly cited.
Abstract
When applied to transportation, cryogenic technology uses the efficiency of volume reduction due to gas liquefaction. Much research is underway with the technology expanding to applications for defense and medicine. To use cryogenic technology, an understanding of the entire system, including that of the behavior of cryogenic fluids and the related heat transfer, is essential. In this study, experiments were conducted to investigate the behavior of a cryogenic fluid in a porous medium, which is widely used in cryogenic systems. Results showed that the pressure distribution in the porous medium was nonlinear with a positive curvature. By introducing a mass sink term in the mass conservation equation, this pressure distribution could be explained. In contrast, the pressure distribution in porous media under saturated flow conditions is constant.
Keywords:
Cryogenic fluids, Porous media, Pressure distribution, Phase changes1. Introduction
Cryogenic liquids are liquefied gases kept in a liquid state at low and cryogenic temperatures, that is, below -150 °C or -240 °F [1]. The investigation of cryogenic flow requires skillful and improved low-temperature techniques and a proficient handling system. In the cryogenic engineering field, new applications using cryogenic technology vary from a liquid fuel supply system for rocket engines to a turbo pump system driven by a propellant [2]. Applications of cryogenic systems are among the most widely used and essential engineering applications. Various aspects of cryogenic systems have been reviewed extensively, and many studies have been undertaken. H. B. Lee et al. [3] surveyed cryogenic flow in the insulated walls of cargo containment systems. Q. S. Chen et al. [4] examined multiphase flow of cryogenic liquids, investigating the temperature and pressure in the cryogenic storage tank. M. S. Zakaria et al. [5] and M. W. Shin et al. [6] estimated boil-off gas (BOG) by using a BOG reduction method applied to cryogenic storage tanks. Such studies involve the flow behavior of cryogenic liquid and consequently the heat transfer phenomena. As cryogenic facilities consist of several kinds of porous media for systems such as the insulation system, it is essential to investigate and characterize cryogenic liquid behavior in porous media.
In the present study, cryogenic liquid behavior and consequently its thermal behavior in porous media were investigated experimentally. The pressure drop phenomenon was investigated and is discussed especially from a cryogenic point of view.
2. Characteristics of cryogenic fluid
2.1 Cryogenic fluid
The term cryogenics refers to the production and application of materials at low temperatures. The cryogenic temperature range is usually defined as extending from -150 °C (-238 °F) to absolute zero (-273 °C or -460 °F), which is the temperature at which molecular motion comes as close as theoretically possible to ceasing completely [7]. Cryogenic fluids can be divided according to certain characteristics, the most representative being the boiling point at atmospheric pressure. The varied boiling points in Kelvin for several cryogenic liquids [8] are shown in Table 1.
2.2 Cryogenic applications
Liquefied gases that are at cryogenic temperatures are used in many cryogenic applications. Liquid nitrogen is the most commonly used material in cryogenics and can be legally purchased around the world.
Many applications of cryogenic technology have been developed, as listed in Table 2. These applications include health, electric power transmission, military, and liquefied natural gas (LNG) plants. Regarding cryogenic facilities, most insulation systems consist of porous media. Exact prediction of cryogenic liquid behavior is essential from the standpoint of protection and safety for the cryogenic system.
3. Experimental
3.1 Materials and apparatus
The present study investigated cryogenic flow in a porous medium when a cryogenic liquid was injected into an experimental test apparatus.
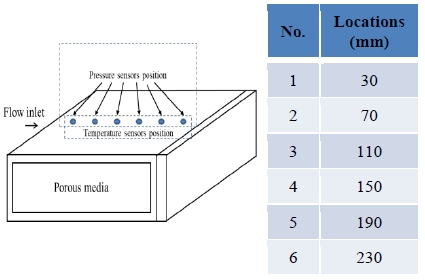
Figure 1 shows a schematic of the cryogenic liquid flow experimental system and apparatus. The test mold consisted of a rectangular duct with open sides and a closed end. The end flange was opposite the injection side such that the flow exited the two sides laterally. The dimensions of the test mold were 300 mm by 300 mm by 30 mm. The mold was made of 15-mm-thick stainless steel. Glass wool made of E-type glass fibers and having a bulk density of 24 kg/m3 (KGM-24, KCC Corporation, Korea) was placed in the mold, providing the porous medium.
3.2 Procedure
The entire test system including the apparatus (the pipe and valves but not the test mold) was pre-cooled to a liquid nitrogen temperature of approximately 110 K prior to the experiment. The flow of the experimental fluid, liquid nitrogen, was controlled by a cryogenic fluid pressure regulator (Series CR, Generant Inc., USA). The fluid injection system was controlled with a 6.35 mm (1/4 inch) cryogenic globe valve. Cryogenic pressure transducers were installed along the flow direction to obtain pressure data. To investigate thermal behavior, Type E thermocouples were installed as shown in Figure 1 they had been calibrated by the manufacturer and had an accuracy of approximately ± 0.1 K. The output data were collected from each sensor and recorded by a data logger.
4. Results and discussion
4.1 Temperature and pressure behavior
To demonstrate flow behavior in a porous medium, liquid nitrogen was injected as the experimental fluid into the test mold for 5000 s at a constant applied gauge pressure of 0.02 MPa. The temperature distribution was observed to determine the flow state. Generally, flow in porous media is Newtonian flow; therefore, the behavior can be explained with Darcy’s law as follows:
| (1) |
where uD is the area-averaged flow velocity, Q is the flow rate, A is the flow cross–sectional area, K is the permeability of the porous medium, μ is the fluid viscosity, and P is the flow pressure. The pressure distribution is obtained by the following relation:
| (2) |
where L is the distance of flow passage.
It was assumed that no structural deformation of the porous medium occurred due to flow during the filling process.
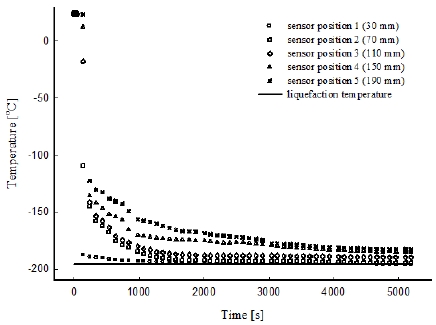
Figure 2 shows the temperature distribution for the 0.02 MPa case in the porous medium along the flow direction. The temperature results obtained with the sensors indicated that, after injection of the cryogenic liquid into the mold, the fluid was in a state of mixed liquid-vapor throughout the mold.
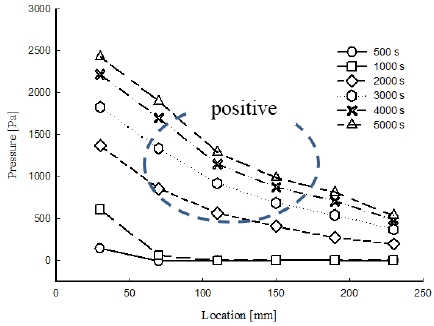
Figure 3 shows the pressure distribution for the 0.02 MPa case in the porous medium along the flow direction. The pressure history was measured during 5000 s. The result for the pressure behavior was distinct in that it showed nonlinear pressure behavior as a function of location. The increase in pressure in the first 1000 s showed that the pressure of the vaporized nitrogen dominated in the porous medium. Sensor 1 indicated the pressure corresponding to the liquid phase of nitrogen below the boiling point. The rapid increase of pressure up to 3000 s was the result of the fluid exceeding its boiling point. After 3000 s, the rate of increase slowed as thermal equilibrium was attained.
A large pressure drop was evident at the locations close to the inlet, between sensors 1 and 2. The increased liquid phase concentration at sensor 1 resulted in a much higher pressure measured at that location than at the sensor 2 location, where the primary phase was vapor. The nitrogen exited the mold in the form of vaporized nitrogen, even in the porous medium opposite the inlet. The vapor phase resulted in a lower pressure compared with the liquid phase, and therefore a large pressure gradient was observed especially between sensor positions 1 and 2.
4.2 Mass conservation and pressure behavior
The evaporation of liquid resulted in a void in the cryogenic liquid, and the flow velocity became lower than the flow velocity at the inlet. The decrease in flow velocity was represented by a change in the pressure gradient, which led to a nonlinear pressure distribution. In addition, a positive curvature of the pressure distribution was observed, as shown in Figure 3.
The mass conservation equation for incompressible liquid flow can be expressed as follows [9]:
| (3) |
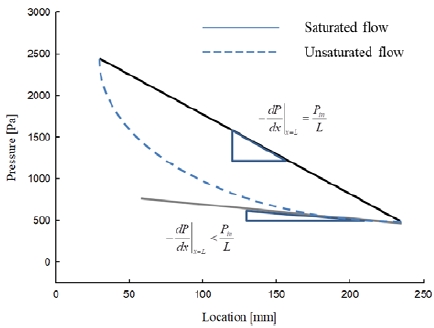
The pressure distribution should be constant and represented by a linear pressure distribution, because the permeability and the viscosity are constant values under saturated conditions. In the case of saturated conditions, the liquid volumetric rate entering the control volume (Qin) is identical to that leaving the control volume ((Qout)).
If the multiphase flow undergoes phase changes, the mass conservation equation should be changed. With phase changes, there is a mass sink due to evaporation. Subsequently, mass conservation can be described as follows [9]:
| (4) |
| (5) |
where Qsink is the mass sink term which is the volumetric flow rate due to phase changes.
Boundary conditions can be applied as follows [9]:
| (6) |
With these conditions, the pressure equation can be obtained as follows [9]:
| (7) |
According to Equation (7), the pressure as a function of location has a nonlinear curved shape. Furthermore, the curvature of the pressure distribution is positive, which corresponds to the pressure results of Figure 4. Since the liquid phase area was greater at locations closer to the inlet, the large liquid phase area at pressure position 1 led to a larger value of pressure. The liquid phase area then increased and expanded radially from the inlet area toward the side of the mold. The liquid phase of the nitrogen changed to the vapor phase due to the difference between the temperature of the medium and that of the liquid.
The nonlinear pressure distribution had a positive curvature over the entire length. When the cryogenic liquid was injected into the porous medium, the liquid evaporated because the temperature of the medium was higher than that of the liquid. This evaporation of the liquid resulted in a further decrease in the pressure of the flow. This phenomenon led to nonlinearity of the pressure distribution.
Under the steady-state condition in which the flow is fully saturated in the porous media, the pressure gradient for the flow is a unique value regardless of the liquid injection condition, as shown in Figure 4. If the flow is not saturated in the porous medium, the pressure gradient has a nonlinear distribution with curvature as shown in Figure 3. Therefore, the degree of saturation of the flow in the porous medium can be represented by the degree of curvature of the pressure as a function of location.
5. Conclusion
The flow behavior of a cryogenic liquid in a porous medium was investigated in the present experimental study. Results showed that the pressure drop was greatly influenced by the phase transition, and a nonlinear pressure profile with positive curvature was observed along the porous medium. By introducing a mass sink term in the mass conservation equation, the pressure distribution under the unsaturated flow conditions could be explained. In contrast, the pressure distribution is uniform under saturated flow conditions in porous media.
Acknowledgments
This work was supported by the fund of research promotion program, Gyeongsang National University, 2018.
References
- V. A. Grigoriev, Yu M. Pavlov, and E. V. Ametistov, Boiling of Cryogenic Liquids, Energiya, Moscow, (1977).
- D. R. Connell, and J. P. Cuffe, “Liquid oxygen gasifying system for rocket engines”, U.S. Patent No. 5,918,460, July, 6), (1999.
-
H. B. Lee, B. J. Park, S. H. Rhee, J. H. Bae, K. W. Lee, and W. J. Jeong, “Liquefied natural gas flow in the insulation wall of a cargo containment system and its evaporation”, Applied Thermal Engineering, 31(14-15), p2605-2615, (2011).
[https://doi.org/10.1016/j.applthermaleng.2011.04.028]

-
Q. S. Chen, J. Wegrzyn, and V. Prasad, “Analysis of temperature and pressure changes in liquefied natural gas (LNG) cryogenic tanks”, Cryogenics, 44(10), p701-709, (2004).
[https://doi.org/10.1016/j.cryogenics.2004.03.020]

-
M. S. Zakaria, K. Osman, A. A. Yusof, M. H. M. Hanafi, M. N. A. Saadun, and M. Z. A. Manaf, “Parametric analysis on boil-off gas rate inside liquefied natural gas storage tank”, Journal of Mechanical Engineering and Sciences, 6, p845-853, (2014).
[https://doi.org/10.15282/jmes.6.2014.10.0080]

-
M. W. Shin, D. Shin, S. H. Choi, and E. S. Yoon, “Optimal operation of the boil-off gas compression process using a boil-off rate model for LNG storage tanks”, Korean Journal of Chemical Engineering, 25(1), p7-12, (2008).
[https://doi.org/10.1007/s11814-008-0002-9]

- Cryogenics PHYSICS, Encyclopedia Britannica, https://www.britannica.com/science/cryogenics Accessed October 25, 2018.
- R. F. Barron, Cryogenic Systems, Clarendon Press, (1985).
-
S. H. Kim, J. W. Jung, M. X Li, S. W. Choi, W. I. Lee, and C. H. Park, “Unsaturated flow behavior in double-scale porous reinforcement for liquid composite molding processes”, Journal of Reinforced Plastics and Composites, 36(2), p85-97, (2017).
[https://doi.org/10.1177/0731684416671422]


