Effect of containment structure on methane gas explosion in fixed roof storage tank
1Ph.D candidate, Department of Mechanical Engineering, Graduate School of Korea Maritime and Ocean University, Tel: 051-410-4367 engbosaad@hotmail.comCopyright © The Korean Society of Marine Engineering
This is an Open Access article distributed under the terms of the Creative Commons Attribution Non-Commercial License (http://creativecommons.org/licenses/by-nc/3.0), which permits unrestricted non-commercial use, distribution, and reproduction in any medium, provided the original work is properly cited.
Abstract
Petrochemical industry sites such as chemical reactors and fuel refineries are the most dangerous sites for explosion accidents. The flame propagation and gas explosion of hydrocarbon gas in a containment is influenced by the structure shape. In this study, a containment structure was tested to understand the effect of the length-to-width ratio on methane gas explosions in a fixed roof storage tank. The results show that the flame development and the pressure curve were stable, and the final averaged pressure remained at 3.8 bar until a length-to-width ratio of three was reached. At a length-to-width ratio of five, the flame front and pressure variation became unstable, the peak pressure increased, and the final pressure decreased; this means that the combustion is a fast-burning and partial explosion. When the structure became longer (ratio greater than eight), the pressure increased sharply to 51.9 bar and then reduced to 3 bar at monitoring point 7 located at the end wall. The pressure behavior shows that the flame propagated over a great distance, which created the explosion condition for the unburned gas in the end area of the containment.
Keywords:
Explosion, Combustion, Fixed roof storage tank1. Introduction
Petrochemical industry sites such as chemical reactors and fuel refineries are the most dangerous sites for explosion accidents [1]-[3]. Typical explosive gases normally constitute a mixture of hydrocarbon and air, and the flame propagation and gas explosion of the hydrocarbon gas in a containment is influenced by the structure shape [4][5]. The flame propagation is also influenced by the interaction with local blockages [6]. Explosions in storage tanks have been studied [7].
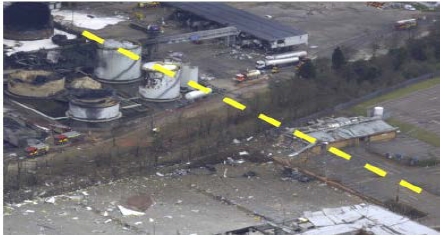
In December 2005, explosions occurred in specific storage depots in Buncefield, UK. The survey of the accident showed that the fire covered the whole area of the site after a large explosion. In this accident, 40 people were injured explosion, and there was major damage to both the commercial and the residential properties surrounding the site [8]. The level of gasoline reached the tank top, and liquefied gas flowed through the vents located in the fixed roof tank [9]. After a 25-min overflow through the vents, the rate of flow almost doubled to 960 m3/h [10]. This increased overflow occurred for 8 min prior to the explosion. A cloud was formed by the explosion, the volume of which reached 300,000 m3 after 25 min, and the rate of gas production was 200 m3/s [11]. The gas was supplied continuously and the explosion propagated through the vicinity. As the volume of the cloud decreased, the cloud spread near the tank as a result of buoyancy [12][13]. Liquid droplets fell from the tank because of the overfill of liquefied gas. This downward motion drew the air down, which enhanced the burning [14]-[16]. The damage is shown in Figure 1.
The installation of a safe layout around the Buncefield site would have worked well to prevent the rapid spread of the explosion around the area [17][18]. Containment design and location were studied to reduce spreading of the vapor to nearby tanks. The results show that it is important to surround all of the storage tanks with dike walls, commonly referred to as bunds. After the explosion in Buncefield, another accident took place in the Indian city of Jaipur (Rajashthan State) from an oil fire on October 29, 2009 [19][20]. The fire led to various explosions at the Indian Oil Corporations (IOC), which destroyed 12 large tanks. The research extended to a marine vessel carrying gas or liquid fuel such as LPG or LNG. The design of dikes in the containment area of explosives or flammables has been studied [21]-[24].
The structure shapes are also important for the control of flame behavior and to prevent severe explosions; however, there are limited studies that address this. In this study, the containment structure was tested to understand the effect of the length-to-width ratio on methane gas explosions in a fixed roof storage tank.
2. Mathematical Model and Conditions
2.1 Mathematical Model
This study used transport equations for the combustion and explosion, given as follows [25].
Conservation of mass:
| (1) |
Momentum equation:
| (2) |
where σij is the stress tensor.
Transport equation for enthalpy:
| (3) |
Transport equation for fuel mass fraction:
| (4) |
where Rfuel is the fuel reaction rate.
Transport equation for the mixture fraction:
| (5) |
Transport equation for turbulent kinetic energy:
| (6) |
Transport equation for the dissipation rate of turbulent kinetic energy:
| (7) |
The stress tensor in Equation (7) is given by:
| (8) |
The effective viscosity is defined as follows:
| (9) |
2.2 Calculation condition and geometry
In this simulation, the initial conditions were a temperature, pressure, and equivalence ratio of 300 K, 1 atm, and 1.1, respectively, and the test fuel was methane gas.
Table 1 shows the test conditions for six different cases, which are classified by the length-to-width ratio of the rectangular chamber. The ratio varied from one in Case 1 to eight in Case 6, while the chamber volume was fixed at 1000 m3.
3. Result and Discussion
3.1 Combustion Product
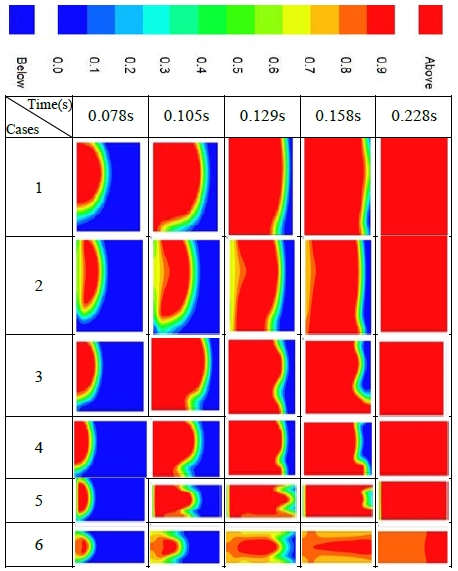
Figure 2 shows the variation in concentration of the combustion product. Red represents the complete combustion region, which indicates flame development. In Case 1, which is a cube structure with the same value for the three directions of length, width, and height, the flame developed widely soon after ignition, and then propagated slowly to the upper, lower and right-side walls. The behavior of the flame propagation signifies ordinary burning with no explosion.
In Case 2, which has a slightly longer structure than Case 1, the flame behavior was similar to that of Case 1. When the containment was enlarged with a longer structure such as in Cases 3, 4, and 5, the flame front became unstable and wrinkled, and the flame speed increased. The longer the structure shape, the faster the flame speed. Case 6 is the longest structure with a length eight times greater than the width or height. In this case, the flame developed through the centerline soon after ignition, and then propagated in the longitudinal direction at very high speed. The pressure and temperature of the unburned gas increased rapidly with the high-speed flame development. This condition was reached in the detonation region of the methane and air mixture. The rapid flame detonated the end gas, which is defined as a flame-induced explosion.
3.2 Temperature Variation
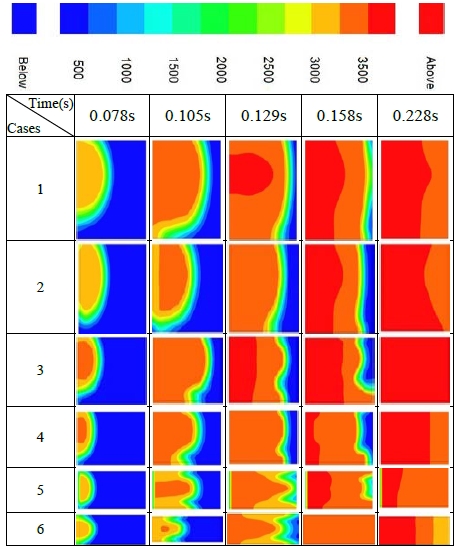
The temperature variations are given in Figure 3 for the six cases. In Case 1, which has a wide space near the ignition point, the temperature developed spaciously and a high-temperature region occurred in the upward region of the containment. The behavior in Case 2 was very similar to that in Case 1. The longer structures of Cases 3 and 4 showed slightly unstable distributions with wrinkled front surfaces. In Cases 5 and 6, which have considerably longer geometrical structures, the high temperature area was shown near the centerline.
3.3 Pressure Variation
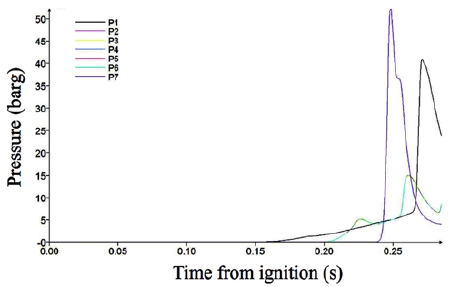
The pressure was measured at seven points during the flame development. The first measuring point of P1 was placed at the center of the left wall, and the last measuring point of P7 at the center of the right wall. The other points from P2 to P6 were evenly distributed on the centerline.
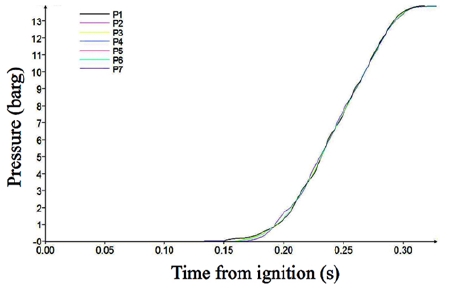
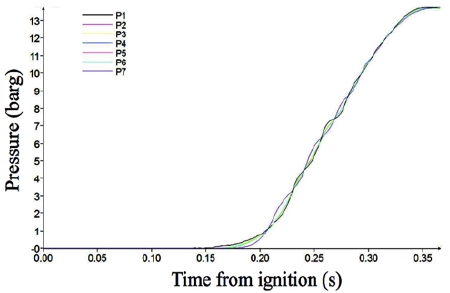
Figure 4 shows the pressure variation with time from ignition. In Case 1, the pressure at all of the monitoring points appears very similar, which means that the burning speed was sufficiently low to propagate the pressure over the containment. The pressure began to increase at 0.15 s, which represents the ignition delay. Then, the pressure increased smoothly with main combustion occurring up to 13.8 barg. The smooth variation indicates that the combustion was a normal burning phenomenon.
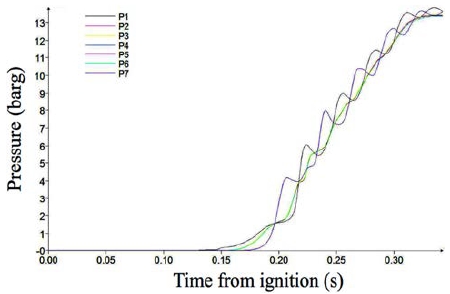
Figure 5 shows the pressure variation in Case 2, which is slightly longer than Case 1. The pressure development behavior appears similar to that of Case 1.
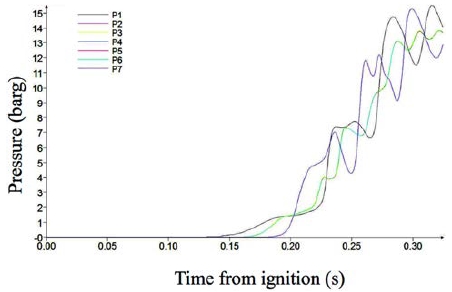
Figure 6 shows the pressure variation in Case 3. The pressure variation became unstable, but the end maximum pressure reached 13.6 barg, which is very similar to in Case 1. This means that the burning process was slightly unstable, but the fuel gas burned out completely.
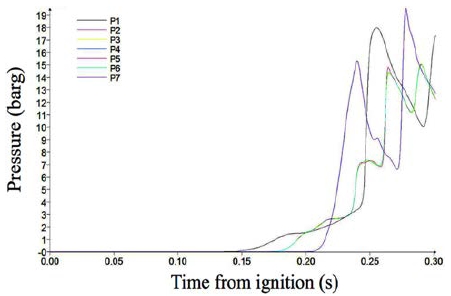
Figure 7 and Figure 8 show the pressure variations in Case 4 and Case 5 in which the length-to-width ratios are three and five, respectively. In these cases, the pressure became highly unstable and the peak pressure increased up to 19.3 barg in Case 5. This means that fast-burning or partial explosions occurred. The final pressure in Case 4 approached 13.8 barg, which is similar to in Case 1; this indicates that the fuel in the containment was burned out completely. However, the end pressure decreased below 13 barg in Case 5, which means that the fuel gas did not burn completely until the end of the combustion. The pressure variation behavior shows that detonation initiated at a length-to-width ratio of five.
Figure 9 shows the pressure variations in Case 6. The case structure has a length-to-width ratio of eight, which indicates that the long structure has a length eight times greater than the width. In this case, the pressure remained near zero until 0.24 s, sharply increased to 51.9 barg, and then reduced to 3 bar at monitoring point 7 located at the end wall. The pressure behavior shows that the flame propagated for a great distance, which created the explosion condition for the unburned gas in the end area of the containment.
4. Conclusion
In this study, the containment structure was tested to understand the effect of the length-to-width ratio on methane gas explosions in a fixed roof storage tank. The flame and pressure results are as follows:
Up to a length-to-width ratio of three, the flame development and the pressure curve were stable, and the final averaged pressure remained at 3.8 bar; this means that the combustion was a normal premixed burning.
At a length-to-width ratio of five, the flame front and pressure variation became unstable, the peak pressure increased, and the final pressure decreased; this means that the combustion was a fast-burning and partial explosion.
When the structure became longer (ratio greater than 8), the pressure remained near zero until 0.24 s, sharply increased to 51.9 bar, and then reduced to 3 bar at monitoring point 7 located at the end wall. The pressure behavior shows that the flame propagated for a great distance, which created the explosion condition for the unburned gas in the end area of the containment. These results indicate that the length-to-width ratio must be less than four to avoid explosion.
References
-
J. A. Alderman, “Introduction to LNG safety”, Process Safety Progress, 24(3), p144-151, (2005).
[https://doi.org/10.1002/prs.10085]

-
R. J. Alonzo, M. J. Russo, and K. Stavinoha, “Changes in API RP500-2012: Combustible liquids and vapors”, IEEE Petroleum and Chemical Industry Committee Conference (PCIC), p1-10, (2015).
[https://doi.org/10.1109/pcicon.2015.7435121]

- W. E. Baker, J. J. Kulesz, P. S. Westine, P. A. Cox, and J. S. Welbeck, A Manual for the Prediction of Blast and Fragment Loadings on Structures, Roport No. SWRI-02-5594, Southwest Research Institute, San Antonio, Texas, (1981).
-
V. Cozzani, and E. Salzano, “Threshold values for domino effects caused by blast wave interaction with process equipment”, Journal of Loss Prevention in the process industries, 17(6), p437-447, (2004).
[https://doi.org/10.1016/j.jlp.2004.08.003]

-
A. M. Cruz, L. J. Steinberg, and R. Luna, “Identifying hurricane-induced hazardous material release scenarios in a petroleum refinery”, Natural Hazards Review, 2(4), p203-210, (2001).
[https://doi.org/10.1061/(asce)1527-6988(2001)2:4(203)]

- T. Ennis, “Pressure relief considerations for low-pressure (atmospheric) storage tanks”, Institution of Chemical Engineers, 151, p910, (2006).
- X. Fei, S. Wenhua, C. Zhen, and L. Lingyue, “The applied research of Thomas model in the pool fire risk assessment in fire embankment of dichloropropane storage tank area”, 4th International Conference on Multimedia Information Networking and Security (MINES), p496-499, (2014).
- M. Grujicic, A. Arakere, B. Pandurangan, A. Grujicic, A. Littlestone, and R. Barsoum, “Computational investigation of shock-mitigation efficacy of polyurea when used in a combat helmet: A core sample analysis”, Multidiscipline Modeling in Materials and Structures, 8(3), p297-331, (2012).
-
M. R. Ryu, and K. H. Park, “Hydrogen explosion effects at a containment building following a severe accident”, Journal of the Korean Society of Marine Engineering, 40(3), p165-173, (2012), (in Korean).
[https://doi.org/10.5916/jkosme.2016.40.3.165]

-
J. Taveau, “Explosion hazards related to hydrogen releases in nuclear facilities”, Journal of Loss Prevention in the Process Industries, 24(1), p8-18, (2011).
[https://doi.org/10.1016/j.jlp.2010.08.002]

- N. Yukio, Design Recommendation for Storage Tanks and Their Supports with Emphasis on Seismic Design, Edition 10, Japan, Architectural Institute of Japan, (2010).
-
J. Taveau, “Explosion of fixed roof atmospheric storage tanks, part 1: Background and review of case histories”, Process Safety Progress, 30(4), p381-392, (2011).
[https://doi.org/10.1002/prs.10459]

-
G. K. Hargrave, S. J. Jarvis, and T. C. Williams, “A study of transient flow turbulence generation during flame/wall interactions in explosions”, Measurement Science and Technology, 13(7), p1036-1042, (2002).
[https://doi.org/10.1088/0957-0233/13/7/310]

- D. J. Park, A. R. Green, and Y. C. Chen, “Analysis of local flame propagation in gas explosions with multiple Obstacles”, 15th Australasian Fluid Mechanics Conference, p13-17, (2004).
- A. R. Masri, S. S. Ibrahim, N. Nehzat, and A. R. Green, “Experimental study of premixed flame propagation over various solid obstructions”, Experimental Thermal and Fluid Science, 21(1-3), p109-116, (2004).
-
Q. Duan, H. Xiao, W. Gao, L. Gong, and J. Sun, “Experimental investigation of spontaneous ignition and flame propagation at pressurized hydrogen release through tubes with varying cross-section”, Journal of Hazardous Materials, 320, p18-26, (2016).
[https://doi.org/10.1016/j.jhazmat.2016.08.005]

-
M. Foster, and H. Pearlman, “Cool flame propagation speeds”, Combustion Science and Technology, 179(7), p1349-1360, (2007).
[https://doi.org/10.1080/00102200601147864]

-
S. M. Aceves, D. L. Flowers, J. Martinez-Frias, J. R. Smith, R. Dibble, M. Au, and J. Girard, “HCCI combustion: Analysis and experiments”, SAE Technical Paper, no. 2001-01-2077, (2001).
[https://doi.org/10.4271/2001-01-2077]

-
T. Yoshioka, M. Suemitsu, T. Yokomori, R. Ohmura, and T. Ueda, “Flame propagation over a methane hydrate with surface temperature variation in a natural convective flow field”, Mechanical Engineering Letters, 1, (2015).
[https://doi.org/10.1299/mel.15-00370]

-
T. Yoshioka, Y. Yamamoto, T. Yokomori, R. Ohmura, and T. Ueda, “Experimental study on combustion of a methane hydrate sphere”, Experiments in Fluids, 56(10), (2015).
[https://doi.org/10.1007/s00348-015-2041-4]

- K. Z. Mendera, A. Spyra, and M. Smereka, “Mass fraction burned analysis”, Journal of KONES Internal Combustion Engines, (3-4), p193-201, (2002).
-
D. Razus, C. Movileanu, V. Brinzea, and D. Oancea, “Explosion pressures of hydrocarbon–air mixtures in closed vessels”, Journal of Hazardous Materials, 135(1-3), p58-65, (2006).
[https://doi.org/10.1016/j.jhazmat.2005.10.061]

-
G. Atkinson, S. Coldrick, S. Gant, and L. Cusco, “Flammable vapor cloud generation from overfilling tanks: learning the lessons from Buncefield”, Journal of Loss Prevention in the Process Industries, 35, p329-338, (2015).
[https://doi.org/10.1016/j.jlp.2014.11.011]

- M. H. Abbasi, E. Benhelal, and A. Ahmad, “Designing an optimal safe layout for a fuel storage tanks farm: Case study of Jaipur oil depot”, World Academy of Science, Engineering and Technology, International Journal of Chemical, Molecular, Nuclear, Materials and Metallurgical Engineering, 8(2), p147-155, (2014).
- FLACS v9.1 User’ Manual, qthelp://com.gexcon.flacs.9_1/doc/index.html Accessed January 10, 2018.

