Analytical study of effects of transportation and industrial growth on Kuwait air pollution
Copyright © The Korean Society of Marine Engineering
This is an Open Access article distributed under the terms of the Creative Commons Attribution Non-Commercial License (http://creativecommons.org/licenses/by-nc/3.0), which permits unrestricted non-commercial use, distribution, and reproduction in any medium, provided the original work is properly cited.
Abstract
The air pollution in Kuwait has rapidly increased since 1991 due to the growth in the urban development and investment plan. Under this plan, the oil and gas industries and the road transportation were further expanded, which adversely affected the air pollution in the country. The purpose of this study is to address the issues related to the emissions from road transportation and oil industries in Kuwait. The effects of the emissions on the air pollution were investigated by analyzing the data gathered from the different districts related to oil industries, road transportation, and residential sites. The analytical result shows that the emissions from road transportation and industrial sites were the main sources of the bad air quality in Kuwait, and the effects were even greater in the urban and residential areas surrounded by industrial sites. The monthly concentrations of sulfate and nitrogen oxides were mainly affected by heavy traffic volumes. Therefore, to improve the air quality, long-term measures are necessary, taking into account the regional characteristics.
Keywords:
Air pollution, Transportation, Emission, State of Kuwait1. Introduction
Transportation emissions have increased rapidly worldwide because of the increase in traffic with growing urbanization. The urbanization depends on the economic status of a country. Kuwait is one of the high-income countries with the highest gross domestic product (GDP) and the lowest fuel price. This provides a perfect opportunity to own vehicles, causing an increase in the number of vehicles. Moreover, the weather of Kuwait also plays a major role in this issue. Kuwait has long, hot summer that lasts for nine months with temperature over 55°C.
Kuwait has no railway, metro, and sea transport lines. Therefore, the road transportation is the only means of transport. With the increase in the number of vehicles, the fuel consumption has also increased. Consequently, the transport sector is considered the most energy consuming industry in Kuwait. Road vehicles represent 80% of the total transport fuel consumption. With the increasing population, road vehicles have also increased from 543 thousands in 1980 to around 1,830 thousands in 2014 [1] with an average annual growth of 6.5%. The current situations make the air pollution worse in Kuwait.
The major air pollutants emitted by motor vehicles are carbon monoxide (CO), oxides of nitrogen (NOX), sulfur oxides (SO), hydrocarbons (HC), lead (Pb), and suspended particulate matter (SPM). These pollutants cause serious damages to both human health and ecology. With the increase in the number of vehicles, the increase in transportation-related pollutants is of growing concern. Various numerical and experimental studies have been performed to estimate and measure the concentrations of air pollutants in different areas of Kuwait to identify the sources and main parameters causing the air pollution [2]-[7].
In this study, the effects of road transportation emissions and oil industries on the air pollution in Kuwait are investigated by analyzing the data gathered from different districts related to oil industry, transportation, and residential sites.
2. Urban, oil refineries and rural districts
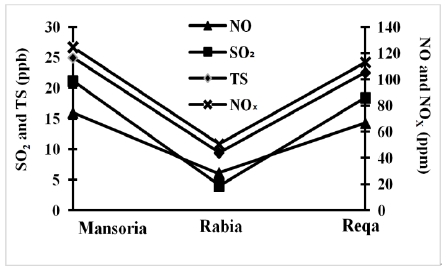
An experimental study was conducted by Kuwait Environmental Public Authority (KEPA) to investigate the mean monthly concentrations of air pollutants SO2, NO, NOX, and total sulfate (TS) for seven years (1998 - 2004) at three different locations in Kuwait. The three stations were located at the central urban district with high traffic density and daily congestions (Mansoria), the oil refineries district far away from Kuwait urban area (Reqa), and the rural district in between these stations (Rabia), respectively. The distance between the monitoring stations was about 25 km. The measured data collected from the stations also included temperature, humidity, wind speed, and wind directions for seven years.
The concentrations of air pollutants at three stations are shown in Figure 1.
It can be seen from Figure 1 that the concentrations of SO2, TS, NO, and NOX are considerably higher in Mansoria and Reqa than in Rabia. The percentage increase in the concentrations of pollutants in Mansoria compared to Rabia were 557% for SO2, 129% for NO, 150% for TS, and 125% for NOX, and the mean monthly level of total sulfate and nitrogen oxides exceeded the standard limits.
The results showed an immense impact of urban auto-traffic and oil refineries on the concentration levels of air pollutants, hence violating the world standard limits.
3. Urban districts
The hourly mean continuous air pollution data from two monitoring stations, located in the major urban districts of Kuwait, were analyzed [9]. The two cities monitored were Al-Mansouriah and Al-Jahra. Al-Jahra is located on the path of the predominantly northwesterly winds that blow throughout the year, transporting pollutants to the city. It is also surrounded by several utility industries. Al-Mansouriah is an urban residential and commercial area affected by the heavy traffic of Kuwait City. It is also surrounded by many industrial sites. The air quality in the Al-Mansouriah and Al-Jahra districts were evaluated in terms of the hourly average concentrations of major air pollutants CO, SO2, PM10 (particulate matter), and NO2 during the winter and summer seasons.
KU–EPA uses fixed air quality monitoring stations (AQMS) to collect air quality data. AQMS measures the concentrations of various pollutants every 5 minutes for the winter and summer seasons.
Figure 2 shows the comparison between the hourly average CO concentrations in Al-Mansouriah and Al-Jahra. Al-Mansouriah data is represented by M and Al-Jahra data is represented by J. The figure also shows the seasonal effects on the air pollution. It can be seen that the variation in the CO concentrations was severe during the summer than the winter in Al-Mansouriah. On the contrary, the variation in the CO concentrations was severe during the winter than the summer in Al-Jahra.
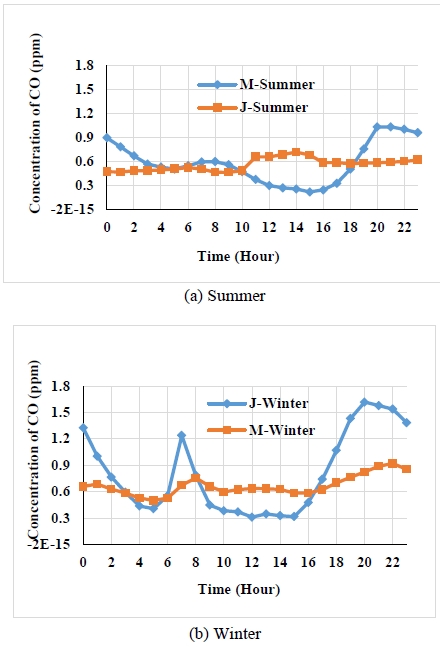
Comparison between hourly average CO concentrations during the summer and winter in Al-Mansouriah and Al-Jahra [9]
The severe variation in the CO concentrations during the summer in Al-Mansouriah was mainly due to industrial and business activities, which mostly occur during daytime. The peaks of the CO concentrations during the winter in Al-Jahra around 7:00 and 20:00 were due to high-traffic volume at these times.
Figure 3 shows the seasonal variation of CO2 concentrations for the two districts. It can be seen that the CO2 concentrations measured in Al-Jahra district were approximately 7% higher than those measured in the Al-Mansouriah district for both seasons. The highest value of the CO2 concentration over the year was recorded during the summer season in Al-Jahra, which was about 381 ppm. This was mainly due to Al-Jahra being located close to power plants that operate at full capacity during the summer to meet the public demand for energy.
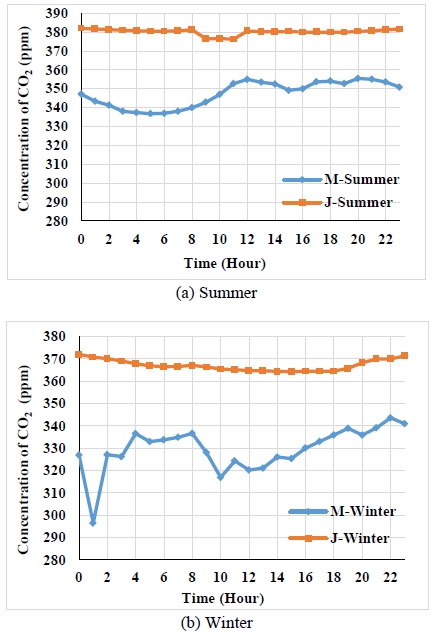
Comparison between hourly average CO2 concentrations during the summer and winter in Al-Mansouriah and Al-Jahra [9]
Figure 4 shows the seasonal variation of SO2 concentrations for the two districts [6][10]. Al-Mansouriah showed a consistent pattern of SO2 concentrations in both seasons, with a maximum value of 4 ppb. The results in summer indicated that SO2 concentrations measured in Al-Mansouriah were approximately 2 ppb higher than those measured in Al-Jahra , which was due to on-road diesel vehicles and Al-Mansouriah being surrounded by other major cities and a number of major highways. Winter monitoring data showed the opposite. The SO2 concentrations measured in Al-Jahra city were approximately 5 ppb higher than those measured in Al-Mansouriah. The difference was due to the flue gases emitted by power stations and oil refineries directly into the Al-Jahra City.
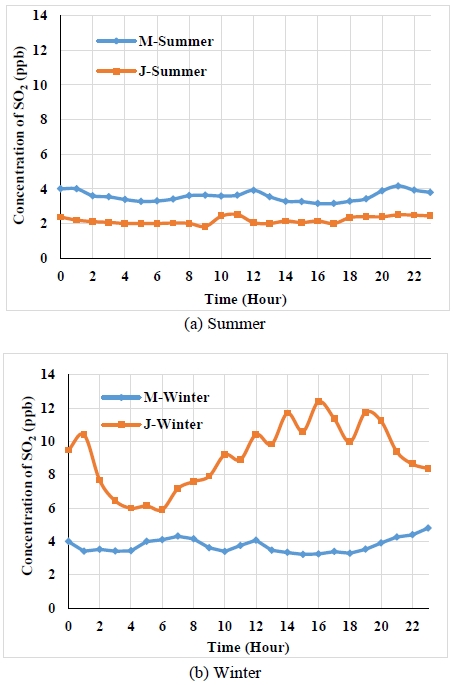
Comparison between hourly average SO2 concentrations during the summer and winter in Al-Mansouriah and Al-Jahra [9]
Figure 5 shows the hourly average of NO2 concentrations during the summer and winter in Al-Jahra and Al-Mansouriah. Summer measurements indicated almost the similar trends for the two districts with lower NO2 concentrations in Al-Jahra. The lowest NO2 concentrations were recorded between 13:00 and 15:00. This was mainly due to the high temperature during the summer. The high temperature and solar radiation reduced the NOx concentrations by intensifying photochemical reactions, causing the breaking down of NO2. On the other hand, the highest concentrations were recorded for both districts at 7:00 and 20:00 with low solar radiation intensity. As shown in Figure 5, the NO2 concentrations measured in Al-Mansouriah during summer were consistently higher than those measured in Al-Jahra.
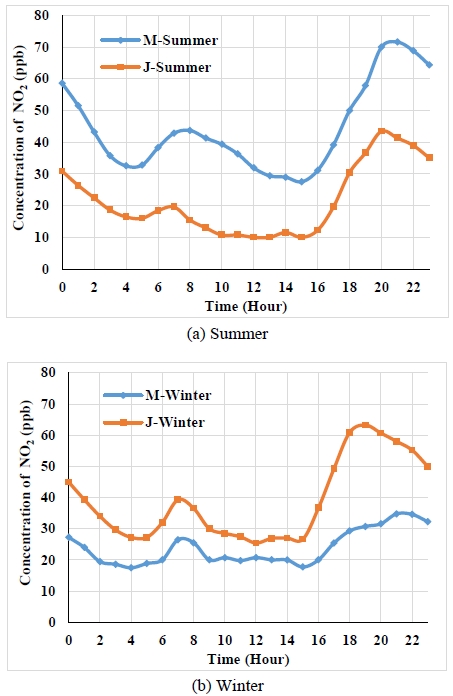
Comparison between hourly average NO2 concentrations during the summer and winter in Al-Mansouriah and Al-Jahra [9]
The higher NO2 concentrations were attributed to the location of Al-Mansouriah district near the downtown area, which is a central urban district with high-traffic density, surrounded by main highways, and cities with tall, urban buildings, which result in poor pollutant dispersion. On the other hand, Al-Jahra district is considered an open rural district in comparison to Al-Mansouriah. It is surrounded by deserts and the newly constructed city of Sa’ad Al-Abdullah, where the summer winds blow in gusts, thus diluting the concentrations of pollutants .
During the winter, similar trends and lower levels were observed for both districts. However, the NO2 concentrations measured in Al-Jahra during this season exceeded those measured in Al-Mansouriah, mainly because Al-Jahra is located near a power station and oil fields, releasing large volumes of NO2.
4. Kuwait city
In this case study, SO2, NO, NO2, H2S, O3, NH3, and VOCs, in Kuwait city using IVL passive sampler technology, were measured on monthly basis during the period from March 2011 to February 2012 at 10 locations [11].
Kuwait City is the capital city of Kuwait and it is located in the eastern part of the country on the shore of the Arabian Gulf with an estimated current population of 56,200 [11]. Kuwait city is the center of most governmental and commercial offices. In general, it is the political, cultural and economic center of the state. The traffic survey carried out by the Ministry of Interior in October 2010 for one week indicated that the average hourly number of vehicles running on the main roads in Kuwait city ranges from 611 to 2792 vehicles/hr. Moreover, Kuwait city is surrounded by industrial areas, which highly contribute to air pollution in the city.
In this study, passive samplers were used to measure SO2, NO, NO2, H2S, O3, NH3 and VOCs at 10 locations in Kuwait city for 12 months, from March 2011 to February 2012. The samplers were systematically located over Kuwait city. The measured data are shown in Table 1.
The concentrations are satisfied the air quality standards by Kuwait EPA in all sites. The concentration of NO2 is 55 μg/m3, which is 82% of the KEPA annual standard of 67 μg/m3.
Figure 6 and Figure 7 show the monthly concentrations of NOx measured in each site and averaged, respectively. The results indicated high concentrations of NO and NO2 during the winter (43.3 μg/m3 and 35 μg/m3, respectively) and an average increase in NO and NO2 concentrations between winter and summer months reached up to 34 μg/m3 and 25.6 μg/m3, respectively. This indicated the effect of traffic in Kuwait. Heavy traffic volume occurs in winter due to the increase in number of visitors during this period, and low in summer when majority of people leave the city for the summer vacation.
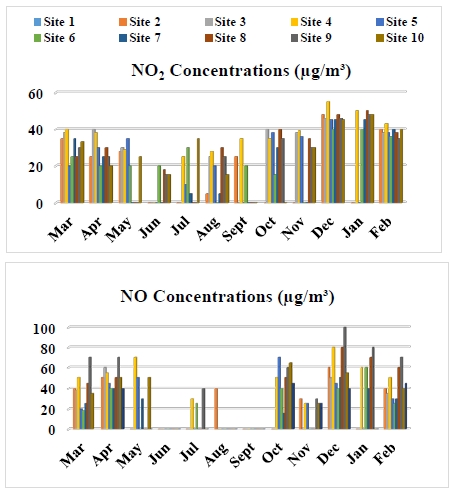
NO and NO2 concentration (μg/m3) measured at 10 locations in Kuwait City during March 2011 to February 2012 [11]
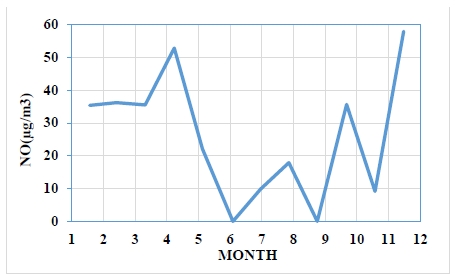
Average monthly variation of NO and NO2 (μg/m3) in Kuwait City from March 2011 to February 2012 [11]
The results show that motor vehicles are the biggest source emitting nitrogen oxides.
5. Conclusion
In this study, the effects of emissions from road transportation and oil industries on the air pollution in Kuwait were investigated by analyzing the data gathered from different districts related to oil industries, transportation, and residential sites. The results were as follows:
In Mansoria, an urban residential and commercial district with heavy traffic surrounded by many industrial sites, the concentrations of nitrogen oxides and sulfur oxides were 2.5 times and 5.5 times, respectively, higher than those in the rural district.
In Reqa, a district close to oil refineries, but far away from urban area, the concentrations of nitrogen oxides and sulfur oxides were slightly lower than those in Mansoria, but higher than in rural area.
In Kuwait City, the capital city located in the eastern part of the country on the shore of the Arabian Gulf, the average value of air pollution was lower than the standard value suggested by KEPA. However, the pollution varied greatly depending on the location.
According to the above results, the air pollution was highest in the urban area surrounded by the industries, and the concentrations of pollutants varied depending on the different locations in the same city. Therefore, long-term measures are necessary to combat high pollutant emissions from vehicles and industries to improve the air quality of the country.
References
- The Statistics Portal, https://www.statista.com/statistics/652178/registeredvehicles-in-kuwait-by-type/ Accessed January 10, 2018.
- S. Abdul-Wahab, W. Bouhamra, H. Ettouney, B. Sowerby, and B. D. Crittenden, “Predicting ozone levels: A statistical model for predicting ozone levels”, Environmental Science and Pollution Research, 3(4), p195-204, (1996).
- S. Abdul-Wahab, W. Bouhamra, H. Ettouney, B. Sowerby, and B. D. Crittenden, “Analysis of ozone pollution in the Shuaiba industrial area in Kuwait”, International Journal of Environmental Studies B: Environmental Science and Technology, 57(2), p207-224, (2000).
-
R. S. Ettouney, S. Abdul-Wahab, and A. S. Elkilani, “Emissions inventory, ISCST, and neural network: Modelling of air pollution in Kuwait”, International Journal of Environmental Studies, 66(2), p193-206, (2009).
[https://doi.org/10.1080/00207230902859929]

- R. S. Ettouney, F. S. Mjalli, H. Ettouney, J. G. Zaki, M. A. El-Rifai, and H. Ettouney, “Forecasting of ozone pollution using artificial neural networks”, Management of Environmental Quality, 20(6), p668-683, (2009).
-
R. S. Ettouney, J. G. Zaki, M. A. El-Rifai, and H. M. Ettouney, “An assessment of the air pollution data from two monitoring stations in Kuwait”, Toxicological & Environmental Chemistry, 92(4), p655-668, (2010).
[https://doi.org/10.1080/02772240903008609]

- S. Al-Mazaidi, Measuring the Percentage of Air Pollutant Concentration from the Exhaust of Gasoline Type Motor Vehicles in Kuwait, Kuwait Institute for Scientific Research, Report No. KISR720, Kuwait, (1982).
- Shell International Petroleum Company Ltd, Motoring and the environment, England, Shell Briefing Service, (1992).
- A. Raslan Alenezi, and S. Bader Al-Anezi, “An assessment of ambient air quality in two major cities in the state of Kuwait”, International Journal of Engineering & Technology, 4(2), p358-368, (2015).
-
M. S. Al-Rashidi, V. Nassehi, and R. J. Wakeman, “Investigation of the efficiency of existing air pollution monitoring sites in the state of Kuwait”, Environmental Pollution, 138(2), p219-229, (2005).
[https://doi.org/10.1016/j.envpol.2005.04.006]

-
J. M. Al-Awadhi, “Measurement of air pollution in Kuwait city using passive samplers”, Atmospheric and Climate Sciences, 4(2), p253-271, (2014).
[https://doi.org/10.4236/acs.2014.42028]


