A comparison of coupled and uncoupled dynamic analysis for the flexible riser in shallow water
Flexible risers have been used extensively in recent years for floating and early production systems. Such risers offer the advantage of having inherent heave compliance in their catenary thereby greatly reducing the complexity of the riser-to-rig and riser-to subsea interfaces. Another advantage with flexible risers is their greater reliability. Concerns about fatigue life, gas permeation and pigging of lines have been overcome by extensive experience with these risers in production applications. In this paper, flexible riser analysis results were compared through coupled and uncoupled dynamic analyses methods. A time domain coupled analysis capability has been developed to model the dynamic responses of an integrated floating system incorporating the interactions between vessel, moorings and risers in a marine environment. For this study, SPM (Single Point Mooring) system for an FSU in shallow water was considered. This optimization model was integrated with a time-domain global motion analysis to assess both stability and design constraints of the flexible riser system
Keywords:
Dynamic analysis, Coupled analysis, Flexible analysis, Harmony search algorithm1. Introduction
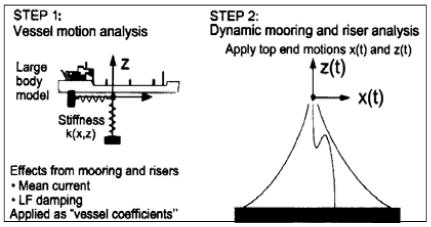
Traditionally, the motions of a floating vessel and the load effects in mooring lines and risers have been analysed by a separated two step-procedure [1]:
1) Compute motions of the floater based on large body (diffraction/radiation) theory in which load effects from risers are modeled as a linear restoring force only. This is typically a linear frequency domain procedure, or a more sophisticated de-coupled time domain procedure can be used.
2) Apply the vessel motions computed in step 1 as a terminal excitation of the mooring line or riser system in order to computed dynamic load effects. This is typically carried out using a non-linear time domain procedure due to inherent non-linarites present in these systems.
The main shortcomings of this separated approach are:
• Mean loads on riser and mooring lines due to current is not accounted for.
• The important damping effect from the mooring and riser system on the LF (Low Frequency) motions can only be included in a simplistic way.
• The dynamics of mooring lines will not influence the WF (Wave Frequency) motions of the floater.
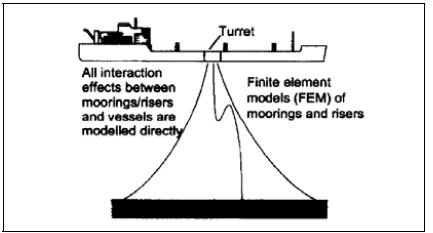
The effect of these shortcomings will increase considerably when water depth increase. In deep water, the interaction between mooring lines/ risers and the floater will be pronounced, and a separate analysis approach may be too inaccurate. In a coupled approach the total floater and slender structure response is solved for simultaneously at every time step in the simulation. In this way, the full interaction between floater and slender structure is accounted overcoming the limitations by a separated approach.
2. Coupled analysis methodology
All the system components are described in a finite element (FE) model. The applied FE procedure is a displacement formulation that allows for unlimited displacements and rotations in the three-dimensional space, while the strains are assumed to be moderate.
2.1 Coupled effects
Coupling effects refer to the influence on the floater mean position and dynamic response from slender structure restoring, damping and inertia forces. These force contributions are elaborated as follows.
Restoring:
1) Static restoring force from the mooring and riser system as a function of floater offset
2) Current loading and its effects on the restoring force of the mooring and riser system
3) Seafloor friction (if mooring lines and/ or risers have bottom contact)
Damping:
4) Damping from mooring and riser system due to dynamic, current, etc.
5) Friction force due to hull/ riser contact.
Inertia:
6) Additional inertia forces due to the mooring and riser system
In a traditional de-coupled analysis, 1) can be accurately accounted for. 2), 4) and 6) may be approximated. Generally, 3) and 5) cannot be accounted for. However, a coupled analysis as described previously can include consistent treatment of all these effects.
2.2 De-coupled analysis
In a de-coupled analysis the equations of the rigid body floater motions are solved in time domain, but the effects of the mooring and riser system are included quasi-statically using non-linear springs, i.e. quasi-static restoring force characteristics. All other coupling effects, e.g. contributions from damping and current loading on the slender structures, need to be given as input to the analysis based on a separate assessment.
2.3 Coupled analysis
In a coupled analysis the complete system of equations accounting for the rigid body model of the floater as well as the slender body model for the risers and mooring lines are solved simultaneously using a non-linear time domain approach for dynamic analysis. Dynamic equilibrium is obtained at each time step ensuring consistent treatment of the floater/slender structure coupling effects. The coupling effects are automatically included in the analysis scheme.
2.4 Coupled equations of motions
The governing dynamic equilibrium equation of the spatially discretized system is expressed by
where RI, RD and RS represent inertia, damping and internal reaction force vectors respectively. RE is the external force vector. r,
 and
and
 are the structure displacement, velocity and acceleration vectors [2].
The inertia force vector is expressed as
where M is the system mass matrix that includes structural mass, mass accounting for internal fluid flow in pipes, and hydrodynamic mass. The damping force vector is expressed as
where C is the system damping matrix that includes contributions from internal structural damping as well as hydrodynamic damping.
The internal reaction force vector RE(r,
 , t) is calculated based on the instantaneous state of stress in the elements. The external load vector accounts for weight and buoyancy, forced displacements, environmental forces and specific forces. Equation (2) expresses a nonlinear system of differential equations. Nonlinearities may be due to the displacement dependencies in the inertia and damping forces and due to the coupling between the external load vector and structural displacements and velocity.
Introducing the tangential mass, damping and stiffness matrices at start of the time increment, and implementation of the residual force vector from the previous time step, the linearized incremental equation of motion is given by
where ∆
 , ∆
, ∆
 and ∆r are the incremental nodal accelerations, velocities and displacements respectively. All force vectors and system matrices are established by assembly of element contributions and nodal component contributions in a common global reference frame.
In a coupled analysis the floating vessel is treated as a nodal component assuming the vessel acts as a rigid body. The forces on the vessel, represented by large volume body, are computed separately at each time step end included in the external load vector RE. The exception is the vessel inertia forces representing the vessel mass and the frequency-independent part of the added mass which are included in the mass matrix of the system.
3. Harmony search algorithm
This paper identifies the factors affecting the flexible riser configuration design. Existing 15” flexible riser was designed as a way to optimize by HS (harmony Search). This paper was written on the paper, based on the price of the mooring line optimization achieved in the design of shallow water in the clean-up, and a combination of variables that affect the optimization of the mooring line and the variables that affect the design of a flexible riser impact of were identified [3].
Compared to other simulation-based meta-heuristic optimization algorithms such as simulated annealing, tabu search, and generic algorithm [1][2][4]-[6], HS was adopted from musical process of finding ‘pleasant harmonies’.
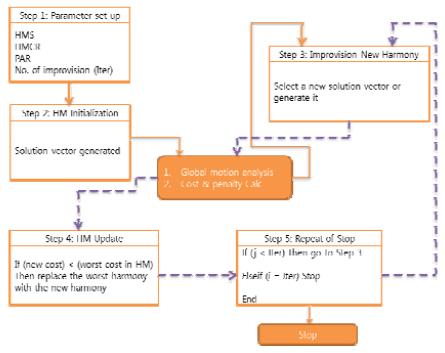
Fundamental five steps of an HS for the cost-optimum riser system design are shown Figure 3, and they are summarized as follows [7]:
Step 1: Design variable / algorithm parameter initialization;
Step 2: Harmony memory initialization;
Step 3: Generation of a new harmony
Step 4: Harmony memory update if needed; and
Step 5: Improvisation stopping criterion check
3.1 Step 1: Parameter set-up
From the constraints in the configuration design of flexible riser affecting shallow water such as water depth, environmental loads, FPSO's Turret types (Internal turret or External turret position), FPSO's offset (Near, Far and Cross position and D (Diameter). The design environment condition is summarized in Table 1.
A JONSWAP spectrum was used to model wave, while the NPD spectrum was used to model the gustiness of the wind. The principal characteristics of the FPSO are shown in Table 2. Table 3 shows FPSO offset when mooring lines are connected to FPSO.
The flexible riser designs are affecting by these dependent variables such as loading conditions, internal fluid, buoy property, riser property, marine growth and Cd (Drag coefficient). Table 4 shows that 15” riser property that existing installed in areas. Table 5 shows that flexible riser analysis cases. Flexible riser and buoy were designed through optimizing the HS based on various constraint and dependent conditions. In other word, buoy was designed according to the variables of each dependent conditions like that the required size of the buoy, buoy number, location and spacing of the buoy.
3.2 Step 2: HM initialization
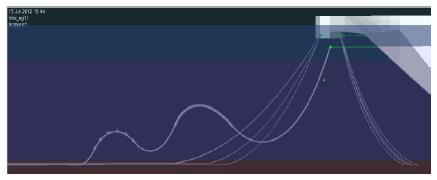
The initial HM consists of different solution vectors of HMS. Each solution vector has diameter and length values for each buoy component and riser system. In this study, riser design and analysis was performed according to the existing design 15” riser system. Existing design 15” risers mean configuration is shown in Figure 4. Riser was designed in the shape of the ‘double lazy-S and a total length of 195m. Buoy was divided into DB1 and DB2 were each 6 and 8 per installed.
3.3 Step 3: Generation of a new harmony
Improvisation of a new harmony is performed based on three rules: (i) memory consideration, (ii) pitch adjustment, and (iii) random selection [8]. Riser and FSU were implemented modeling, hydrodynamic analysis and riser analysis using DNV SESAM program software. The riser weight and diameter have been evaluated for the various fluid conditions.
4. Analysis and Results
4.1 Compute line shape
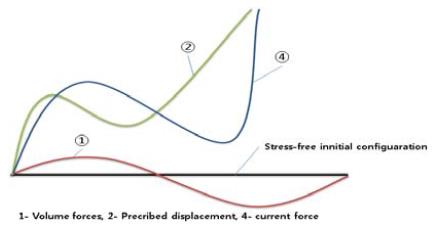
In static analysis it is convenient to distinguish between the following basic load types [2]:
1) Volume forces (weight and buoyancy)
2) Specified displacements (i.e. displacements from stress-free configuration to final position of nodal points with specified boundary conditions)
3) Specified forces (nodal point loads)
4) Position dependent forces (current forces)
The incremental loading procedure starting from stress-free configuration is organized in a sequence of load conditions where each load condition consists of one or more of the basic load types. Figure 5 illustrates the compute line shape method. Each load condition is applied in a specified number of load increments [2].
4.2 Analysis
Static analysis was carried out lumped load and mass formulation and dynamic analysis performed uncoupled analysis by irregular time domain. The purpose of this analysis is to find the most suitable riser configuration, the extreme riser top excursions may be accommodated in the most unfavorable environmental conditions i.e. the 100-year thunder storm condition [9].
The crucial parameters of this design verification are:
1) Minimum radii of curvature of the flexible pipe.
2) Loads induced by the risers on the top connections.
3) Loads in the risers at the TDP (Touch Down Point).
4) Relative positions of the riser sag with respect to the sea bed.
5) Relative position of the riser top section with respect to the FSU vessel shell.
6) Lateral excursion of the risers.
4.3 Results
A flexible riser was analyzed by two methods such as uncoupled analysis and coupled analysis. Also, through compute line shape analysis was performed a flexible riser configuration optimization. From the configuration optimized riser, global response analysis compared with coupled analysis. The results of analyses for full loading and ballast conditions are explained briefly below:
Full-loading condition
1) Near position: At +11.03m near position, the three cases : case 1, case 2 and case 3 are failed to have the stable solutions. However at +6m near position from the mean, case 1 satisfy the stable criteria. For marine growth of 50%, case 1 and case 2 are stable except case 3. However, for marine growth of 100%, the risers become heavy causing the riser to contact with seabed for all cases.
2) Cross position(y+20m): The cross position means when the riser moves 20m to y direction. All cases show stable for the cross position. However for 100% marine growth, none of cases is stable since the riser contacts seabed. For the 50% marine growth, case 2 and case 3 indicate stable with bottom clearance of 1~2m.
3) Far position (-11.61m): For the far position of -11.61m, all cases become stable.
Ballast condition
1) Near position (+11.3m): All cases are resulted unstable for the near position. However, for marine growth of 50%, all cases show stable. For marine growth of 100%, the riser of all cases contacts seabed.
2) Cross position(y+20m): All cases show stable regardless of fluid properties or marine growth.
3) Far position (-11.61m): All cases are stable.
Table 6 summarizes the results of uncoupled analysis and Table 7 is coupled analysis results.
Compare to the uncoupled analysis, coupled analysis results are more stable especially in API 20” case due to the weight. However, there are not much different in two analysis method.
5. Conclusions
In this study, comparisons between the uncoupled and coupled approaches are presented. To obtain the uncoupled results, a low frequency quasi-static computation was first performed using zero frequency asymptotic value for the added mass and damping coefficient, neglecting also the line inertia. The RAO and mooring stiffness are computed once for all in the position of static equilibrium under stationary loads.
A method for coupled motion analysis of floating moored structures is outlined and applied to case example of a turret-moored ship operating in 55m water depths. Turret motions, line tensions and clearance with seabed from simulation, uncoupled analysis and coupled analysis are compared.
Through this study, the shallow water of a flexible riser design to a number of constraints that were identified and the biggest factor is the offset of the FPSO. So, riser must be having an enough stability to be ensured within the range of FSU offset. Buoy design is not easy to satisfy all the conditions of the fluids in shallow water because the production riser has different internal fluid cases.
Depending on the fluid of S.G dynamic characteristics are very different. Therefore, depending on a variety of fluid S.G under the various conditions, many case studies are required to optimize buoy design. For an economical buoy design, considering the number of buoy, size, price, spacing and etc. the detailed design is required.
Acknowledgments
This work was supported by the Manpower Development Program for Marine Energy of the Ministry of Ocean and fisheries the Korean government and the Technology Innovation Program funded By the Ministry of Trade, industry & Energy (MI, Korea). The authors grateful to INHA University for the funding research grant.
Notes
References
-
H. Ormberg, and K. Larsen, “Coupled analysis of floater motion and mooring dynamics for turret-moored ship”, Applied Ocean Research 20, (1998).
[https://doi.org/10.1016/S0141-1187(98)00012-1]

- DNV, Deep User Manual, Det Norske Veritas, (2008).
- S. Ryu, Heyl, Caspar, and Duggal. A, “Mooring cost sensitivity study based on cost-optimum mooring design”, The Korean Society of Ocean Engineers, 23(1), p1-6, (2009), (in Korean).
- M. C. Cunha, and J. Sousa, “Water distribution newtwork design optimization: simulated anneling approach”, American Society of Civil Engineers, 125(4), p215-221, (1999).
- S. H. Kim, J. H. Kwon, and J. Kim, “Study on the airfoil shape design optimization using database genetic algorithms”, The Korean Society of Marine Engineering, 31(1), p58-66, (2007).
-
I. Lippai, J. P. Heaney, and M. Laguan, “Robust water system design with commercial intelligent search optimizers”, American Society of Civil Engineers, 13(3), p135-143, (1999).
[https://doi.org/10.1061/(ASCE)0887-3801(1999)13:3(135)]

-
S. Ryu, A. S. Duggal, C. N. Heyl, and Z. W. Geem, “Mooring cost optimization via harmony search”, Proceedings of the 26th International Conference on Offshore Mechanics and Arctic Engineering, p355-362, (2007).
[https://doi.org/10.1115/OMAE2007-29334]

- Michael W. J. Wyllie, “Fast track FPSO`s for deepwater and ultra-deepwater”, Proceedings of the Offshore Technology Conference, p205-211, (2004).
- API, Design of Risers for Floating Production Systems(FPSs) and Tension-leg Platforms (TLPs), American Petroleum Institute, (1998).
